


Introduction
Jutulstraumen, an ice stream in Dronning Maud Land (Fig. 1), is fed by an approximately 124000 km2 catchment basin, about 1% of the Antarctic ice sheet (Reference Van Autenboer, and DecleirVan Autenboer and Decleir, 1978). Jutulstraumen Hows into Fimbulisen, where it protrudes as a floating ice tongue, named Trolltunga. This ice tongue has retreated considerably after a major calving event in 1967, when an iceberg approximately 100 km lougand 50 km wide broke off (Reference Vinje,Vinje, 1977).

Fig. 1. Fig. 1. Jutulstraumen at the zero meridian in Dronning Maud Land (mар from Norsk Polarinstitutt).
Previous studies of the mass balance of Jutulstraumen did not include its entire discharge. Reference Gjessing.Gjessing (1972) collected gravity and velocity measurements between Jutulrøra and northern Nashornkahen (also investigated in the present study; profile 1 in (Fig 1). Reference Decleir,, Аutenboer. and Craddock.Decleir and Van Autenboer (1982) recalculated the bottom topography from Reference Gjessing.Gjessing’s (1972) gravity measurements and estimated the discharge through this profile as 12.5 km3 a−1, assuming plug flow. On the basis of this estimate, Reference Bentley,, Giovinetto., Weller,, Wilson, and Seberin,Bentley and Giovinetto (1991) calculated that accumulation exceeds outflow by 50%. However, a large part of the Jutulstraumen accumulation area drains through Viddalen, between Nashornet and Istind (profile 2 in Fig. 1). No velocity data were available for the section across the outer part of Viddalen and the outflow there has so far been neglected. Satellite images indicate that as much as one-third of the ice mass in Jutulstraumen may flow through Viddalen. The outflow cross-sectional area in this study is based on the depth profiles of Reference Decleir,, Аutenboer. and Craddock.Decleir and Van Autenboer (1982) (Table (1)).
Table 1. Absolute velocity, normal velocity and ice flux.

The field work of this project was carried out during the Norwegian Antarctic Research Expedition 1992–93 (NARE 92–93) (Reference Høydal,Høydal, in press), in co-operation with Reference Melvold. and Hagen.Melvold and Hagen (in press). It has two objectives: (1) To clarify the mass balance of Jutulstraumen, and (2) to investigate the dynamics and the variation in the stress fields of this type of ice stream. Jutulstraumen is bounded by bedrock like alpine glaciers and therefore should differ in behaviour from the more comprehensively studied ice streams of West Antarctica.

Fig. 2. Upper part: relative horizontal movements of the stakes. The longest line represents 443 m a−1. Lower part: relative position of each stake and elevation contours. The numbers refer to stake and velocity data in Table (1).
The surface-velocity profiles consisted of 42 stakes across Jutulstraumen (Fig. 2). Twenty-seven of the stakes were arranged in 3 × 3 rectangular strain nets (Fig. 2). The stakes were surveyed using the Global Positioning System (GPS).
The strain-rate measurements from the three strain nets are used to calculate deformations, stresses and velocities at depth.
Measurements and Data Analysis
The relative positions of profile stakes were surveyed using phase-tracking kinematic GPS techniques (Reference Gjessing.Eiken, in press). Three (WGS 84) GPS receivers were used for each survey. Two receiver antennas were mounted on fixed stakes at each end of the profile and continually recorded GPS signals. The third, roving, receiver and antenna was mounted on a sledge, towed by a snowmobile. The snowmobile drove along the profile. making short stops at each stake and placing the antenna on the top of each stake. At each end of the profile, the roving antenna was interchanged with the fixed antenna. Relative positions of the stakes were computed using signals recorded by all three GPS receivers and Ashtech XII GPPS post-processing software.
The profiles were surveyed twice. The interval between each survey was 14 d. The computed surface velocities are plotted in Figure. 2 and velocities are listed in Table (1). These velocities are in good agreement with those measured by Reference Gjessing.Gjessing (1972).
Stake-positioning errors (standard deviation) from the GPS measurements and processing are 0.05–0.06 m for net 1 and 0.02–0.03 m for nets 2 and 3. 0.005 m error on the stake positions results in about 0.1% error in the velocity for the slowest part of the ice stream. The maximum strain-rate error is 0.2 × 10⁻³ a−1 or about 10% of the values for net 1 given in Table (2). The stresses are proportional to the strain rates and will contain the same error as the strain rates. The true errors in the strain rates at the nodes in Table (2) are considered to be smaller, because they are based on averages from four stakes and are more accurate positions for the stakes in nets 2 and 3. The standard deviation for the vertical positioning is larger than for the horizontal positioning. The maximum is 0.25 m and may result in a 5% error in the shear stresses for net 2, where the surface slope is smallest.
Table 2. Surface strain rates (a−1) and stresses (kPa).

Force-balance calculations require four sets of strain rates and the surface slope for each 3 × 3 strain net. Surface slope is computed from relative elevations of the outermost stakes. Measured velocities are transformed into surface-parallel components and gridded to a regular 1 km grid using linear interpolations. The coordinate system is Cartesian with the x axis eastward along the profile, the y axis pointing northward and the z axis positive upward normal to the local snow surface. Figure. 3 illustrates the local coordinate system used in each strain net. Strain rates are computed in each quarter of a strain net, bounded by four stakes. The average normal strain rates from two sides are ![]() and
and ![]() , while
, while ![]() is an average from all four sides. All three quantities apply to the geometric centre of the square. This point is a node and a net consisting of 3 × 3 stakes gives four nodes. The values from these four nodes, together with the centre velocities and the surface slopes, are used in the model to compute stresses at the centre point of each strain net.
is an average from all four sides. All three quantities apply to the geometric centre of the square. This point is a node and a net consisting of 3 × 3 stakes gives four nodes. The values from these four nodes, together with the centre velocities and the surface slopes, are used in the model to compute stresses at the centre point of each strain net.

Fig. 3. The lefthand figure illustrates the local coordinate system used at each strain net. The righthand figure illustrates the surface element spanned by the four nodes. The vertical arrows indicate a positive direction for ![]() at each node; horizontal arrows indicate a positive direction for
at each node; horizontal arrows indicate a positive direction for ![]() and the half arrows indicate a positive direction at the corners of the shear stress
and the half arrows indicate a positive direction at the corners of the shear stress ![]() . All of these stresses act on surfaces parallel to the z axis. These surfaces are close to vertical and
. All of these stresses act on surfaces parallel to the z axis. These surfaces are close to vertical and ![]() is later called “vertical shear stress” in Figures 6. 7 and 8.
is later called “vertical shear stress” in Figures 6. 7 and 8. ![]() and
and ![]() are the longitudinal deviator stresses.
are the longitudinal deviator stresses.
Force-balance Theory
Two simplifications are made to the well-established force-balance method of Reference Van der Veen. and Whillans,Van der Veen and Whillans (1989a). First, a Cartesian coordinate system is defined with the z axis perpendicular to the snow surface. In this paper, planes parallel to the z axis are called vertical. Next, a simplifying assumption regarding the hydrostatic pressure is made. The changes are described below.
For an element with density ρ and sides ∂x, ∂y and ∂z parallel to the coordinate axes, the stress-balance equations are:

where σxx, σyy, σzz are normal stresses, σxy, σxz, σyz are shear stresses and gx, g,y gz are components of gravity in the x, у and z directions.
Stress-deviator components are obtained by subtracting the average normal pressure ![]() from the normal stresses. The shear-stress components remain unchanged.
from the normal stresses. The shear-stress components remain unchanged.
By assuming the average normal stress to be constant along planes parallel to the surface, a good approximation to the stress-balance equations is achieved by replacing the derivatives of the normal stresses directly with the derivatives of the deviator-stress components:

where ![]() are deviator-stress components.
are deviator-stress components.
Stresses are linked to strain rates ![]() through their deviator components (σ′) in the generalized flow law:
through their deviator components (σ′) in the generalized flow law:
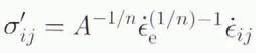
where A is the flow parameter among other features dependent on temperature. n is an empirical derived constant, here taken to be equal to 3 (Reference Paterson,Paterson, 1981).
The effective strain rate ![]() is defined as;
is defined as;

In the field, velocity is measured at discrete locations. Horizontal strain rates at the surface are:
Assuming no vertical shear (e.g. (∂uz )/(∂x) = 0 and (∂uz )/(∂y) = 0), horizontal strain rates below the surface are computed using:
The strain nets measured on Jutulstraumen were restricted to 3 × 3 arrays of stakes. This means that just one derivative of each surface-stress component can be calculated for each net. Instead of introducing additional points outside the measured area to provide lateral boundary conditions at depth (as in Reference Van der Veen,Van der Veen, 1989), the strain rates measured at the surface are kept constant with depth. This is believed to be the best assumption, There can never be any physical control of the boundary conditions at the margins of a strain net. Keeping the surface strain rates constant leads to decreasing longitudinal deviator stresses at depth because ice temperature, and thus softness, increases.
The effective strain rate ![]() is included in both Equations (4) and (5) and includes both
is included in both Equations (4) and (5) and includes both ![]() and
and ![]() . This coupling of
. This coupling of ![]() and
and ![]() requires that Equations (4) and (5) are solved simultaneously. This is done by iterations where the effective strain rate is updated, representing the average effective strain rate in the integration layer.
requires that Equations (4) and (5) are solved simultaneously. This is done by iterations where the effective strain rate is updated, representing the average effective strain rate in the integration layer.
Equations (4) and (5) are solved for ![]() and
and ![]() for thin layers parallel to the surface. The upper-boundary conditions are a stress-free surface and surface velocity. Stresses and velocities at the lower surfaces can then be progressively calculated downward to the base.
for thin layers parallel to the surface. The upper-boundary conditions are a stress-free surface and surface velocity. Stresses and velocities at the lower surfaces can then be progressively calculated downward to the base.
Temperature Model and Input
A model of temperature variation with depth is needed to estimate the values of the flow parameter A. Values for A as a function of temperature have been tabulated in Reference Paterson,Paterson (1981). The temperature profile is estimated using a simple model from Reference Robin.Robin (1955). The following assumptions are made:
-
1. Temperature distribution and ice geometry do not vary with time (i.e. steady state).
-
2. The basal temperature is below the melting point of ice.
-
3. The horizontal temperature gradient is negligible compared to the vertical temperature gradient. Thus, horizontal heat advection is negligible.
-
4. Heating from internal friction is mainly important in the lower layers and may be accounted for by increasing the geothermal heat flux, and similarly for heat generated by basal sliding.
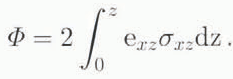
Heating due to internal deformation. Φ depends mainly on horizontal shear stresses. However, this is not known a priori. An initial estimate is made using the flow law and assuming that σxz = ρghα:
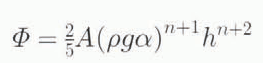
where A is the flow rale in the flow law. g is gravity, h is ice thickness and α is surface slope. When force-balance calculations are carried out, a better estimate is found from:
The healing from basal sliding is:
where σb is basal shear stress and vb is basal sliding. This heating is initially set to zero.
The inputs required to compute a depth-temperature profile are accumulation, geothermal heat flux and surface temperature. Reference Schytt,Schytt (1958) measured accumulation at four locations along profile 1 in 1949 and 1950, with an average of 0.3 m w eq. a−1 as a representative accumulation for the area.
The lower part of Jutulstraumen lies in a structural fault, Pencksökket (Penck Trough). It is believed that Pencksökket was formed during the Precambrian, so that heating associated with orogenesis should no longer influence heat flow. The geothermal heat flow is assumed to be −54.6 mW m−2 or −1.72 × 10⁶ J m−2 year−1. This is a typical value (Reference Sclater,, Jaupart and GalsonSclater and others, 1980) for Precambrian shields.
The average annual surface temperature at the profiles is −23°C and is found from temperature measurements made in shallow boreholes (Reference Melvold. and Hagen.Melvold and Hagen, in press). The average annual temperature is approximately −23°C. This agrees well with Reference Schytt,Schytt’s (1958) estimates of average annual temperature of −21.4°C at 770 m and −24.7°C at 1280 m elevation. By interpolating Schytt’s values, −22.2°C is found at 900 m and −22.9°C at 1000 m elevation. The profiles are all located at about 900 m a.s.l. (Fig. 2).

Fig. 4. The surface profile between Nordre Nashornkalven and Jutulrøra (profile 1).
The advection of ice from higher elevations undoubtedly causes a reversed temperature profile in the upper layers, as has been demonstrated in other sites (e.g. Reference Van dar Veen, and Whillans,Van der Veen and Whillans, 1989b). The altitude of the upper accumulation area in Jutulstraumen is above 2500 m (67% of the area is above 2500 m) with an annual temperature between −35° and −40°C. A reversed temperature profile in the upper layers at Jutulstraumen is therefore to be expected.
This temperature model might seem too simplified for the present application. In an ice stream like Jutulstaumeu, the basal temperature is possibly at the pressure-melting point, violating Reference Robin.Robin’s (1955) assumption (2). However, this solution must be valid when the temperature is close to the pressure-melting point, because a small change at the base will not significantly change the shape of the profile. The value of the flow parameter. A, is known at best within a factor of 5 (Reference Høydal, and Peltier,Hooke, 1981; Reference Paterson, and Budd,Paterson and Budd, 1982). An error of 5°C in the temperature estimate will change the flow parameter by a factor of about 3. It is believed that the estimated temperature curves are accurate within ±5°C and will not have much influence on the accuracy of the flow parameter.
To summarize: sliding and internal deformation produce heat that influences the temperature curve, so calculating ice temperature and deformation is a coupled problem. This is solved by successive calculations of the temperature and the deformation. The procedure is described below.
Results
Temperature
Heating due to internal deformation is first estimated according to surface slope and a flow parameter representing −20°C (Equation (13)). The initial heat flows, 109, 82 and 57 mW m−2, are used to compute the basal temperatures that are −11°, −6° and −16°C for nets 1, 2 and 3, respectively. The initial temperature profile is used in force-balance calculations to compute basal velocities and shear stresses. The cold, undeformable ice and large surface velocity result initially in large basal velocities. The theoretical heat generated by this “cold basal sliding” is an order of magnitude larger than the geothermal heat flow. The heat flow needed to keep the base at the pressure-melting point is just 182, 104 and 211 m W m−2 for nets 1, 2 and 3, respectively. Reference Van dar Veen, and Whillans,Van der Veen and Whillans (1989b), and the ensuing calculations, show that the ice temperature or variation in the flow parameter has a smaller influence on calculated horizontal shear stresses. Heat generated by internal deformation (Equation (14)) will then increasingly limit Equation (15) the closer to the base the differential movements occur. For all three nets, the heat generated by differential movements is more than necessary to keep the base at the pressure-melting point. The final temperature curves are shown in Figure. 5.

Fig. 5. Temperature curves for strain nets 1–3. a, calculated temperature; b, average effective strain rate: temperature calculated; c, average effective strain rate: isotherm.
The force-balance calculations result in internal heating (Equation (14)) + heating by sliding (Equation (15)) equal to:
The excess of heat results in basal melting, Taking only the heat produced by sliding into account, the basal melting is about 0.03, 0.10 and 0.05 m year−1 for nets 1, 2 and 3, respectively, or 0.06 m year−1 as a mean. The difference in heat production at the three locations is mainly due to differences in the surface velocity. As long as the resulting sliding velocity produces more heat than is needed to keep the base at the pressure-melting point, the temperature curves in Figure. 5a, d and g are expected to be a good approximation.
In order to test the dependence of the results on temperature, force balance is calculated assuming the ice is isothermal at −25°C.
Effective strain rate
The average effective strain rate, the average value from the four nodes at each vertical level is plotted in Figure. 5. Two temperature profiles, one isothermal at −25°C and the other computed as described above, are considered. In the isothermal case (Fig. 5c, f and i), the effective strain rates at the base are twice the surface values. When the estimated temperature profiles (Fig. 5a, d and g) are used, the changes in effective strain rate are much larger, with basal strain rates an order of magnitude larger than at the surface.
The large difference in effective strain rates between the isothermal and temperature-varying models is a result of the non-linearity of the flow law and the temperature-dependence of its flow parameter. In the isothermal case, the surface-measured stresses at the bed are reduced to ∼63% ![]() of the surface value (Figs 6, 7 and 8). In the temperature-varying case, there is a feed-back effect from the effective strain rate, due to the increased flow parameter. The order-of-magnitude increase in effective strain rate at the bed decreases the measured surface stresses to 21%
of the surface value (Figs 6, 7 and 8). In the temperature-varying case, there is a feed-back effect from the effective strain rate, due to the increased flow parameter. The order-of-magnitude increase in effective strain rate at the bed decreases the measured surface stresses to 21% ![]() of the surface value. The change in the temperature from the surface to the bottom increases the flow parameter about 50 times. This reduces the deviator stresses to 27%
of the surface value. The change in the temperature from the surface to the bottom increases the flow parameter about 50 times. This reduces the deviator stresses to 27% ![]() of the surface values. The effect on the increased effective strain rate is larger than the effect of larger flow parameter. Together, the two effects result in basal stresses that are only 5% of the measured surface stresses.
of the surface values. The effect on the increased effective strain rate is larger than the effect of larger flow parameter. Together, the two effects result in basal stresses that are only 5% of the measured surface stresses.

Fig. 6. Strain net No. 1. Velocities and stresses are calculated (1) by using the temperature profile in Figure. 5 and (2) by assuming the ice temperature is constant and equal to −25°C.
Updating the effective strain rate to take account of increased temperature at depth has a positive feed-back effect on the deformation. This can be seen in Figures 6, 7 and 8 for “average longitudinal deviator stresses” and “average shear stress on vertical planes” where temperature curves are included in the calculations. The strong reduction of the surface-measured stresses at the base are here caused by the combination of soft ice and high stress level at the base. At the base, the effective strain rate is totally dominated by horizontal shearing. The horizontal shear stress is only weakly affected by the ice temperature, while the effect on the horizontal velocity is more dramatic (Figs 6, 7 and 8). Keeping the effective strain rate constant at depth will then have only a small effect on the horizontal shear but a greater effect on the estimated horizontal velocity profile at depth. If the effective strain rate had been kept constant at the surface-measured value, the surface-measured stresses would have been reduced lo about 27% of those at the bed.


Force-balance calculations are often made with the effective strain rate measured at the surface kept constant at depth. This makes it possible to integrate directly the force-balance equations to the base. This is equivalent to adjusting the flow parameter to local conditions and solving the force balance with a linear flow law. If the effective strain rate (or effective shear stress) is more or less constant, the depth variation is mainly associated with the temperature-dependence of the flow parameter. Reference Van dar Veen, and Whillans,Van der Veen and Whillans (1989b) found a relatively small variation in the effective shear stress with depth and proposed a flow law where the flow parameter included the effective shear stress measured at the surface. They found no significant difference using linear (n = 1) and non-linear (n = 3) flow laws. In Jutulstraumen, the basal shear stress is about 4 times the basal shear stress at the Byrd Station Strain Network for which Van der Veen and Whillans’ calculations were made. The larger basal shear stress makes the choice of exponent in the flow law more important in Jutulstraumen.
To summarize: assumptions about the value of n in the flow law and how the effective strain rate are incorporated have a greater effect on the results than a few ℃ error in the calculated temperature profiles.
The surface velocities and stress fields
The magnitudes of the stresses are related to the velocities and the location in the ice stream. Table (2) shows the values of the interpolated strain rates from measured stake positions and the calculated surface stresses. Figure. 4 shows the surface elevation along the profile and, together with the elevation contours in Figures 1 and 2, this helps to clarify the flow patterns. The degree of surface-elevation variation along the profile is surprising considering that the ice thickness is more than 2 km. The flow patterns are consistent with those seen on satellite images.
Net 1
The ice here just passes the last of three nunataks in the Nashorn ridge. Further downstream the surface slope decreases. Thus, there is compression in the flow direction (∼y direction) and extension in the lateral direction (∼x direction) (Table (2)). The difference in flow direction between stakes 30 and 31 (Fig. 2) creates open crevasses and reverses the sign of the vertical shear stress (the side drag) at node 4.
There is lateral divergence between nets 1 and 2 but a convergence between net 1 and the ice stream from Viddalen (profile 2).
The average vertical shear (the side drag) at the surface is 94.5 kPa. which is of the same magnitude as net 3.
Net 2
The net lies over the thickest part of the ice stream where the velocities are largest. In the lateral direction (x direction) there is mainly extension. The net lies on a small hill with a depression or channel to the east. Surface velocities from net 2 and eastward indicate lateral convergence into this channel.
Lateral compression might be expected in the shallow depression between nets 1 and 2. However, there is a lateral divergent flow between nets 1 and 2. At the deepest part of the depression there is a large open crevasse transverse to the profile, the only place along the profile with such a large open crevasse. The crevasse belongs to a system that increases in size downstream. Standing at the side of this crevasse, one gets a weak impression of being situated in a trough. Further upstream, K. Melvol (personal communication) has reported a larger trough.
The flow patterns in the profiles indicate that flow west of stake 4 is controlled by the bedrock depression in Viddalen, while ice flow east of stake 4 is controlled by the depression in the middle of profile 1. The basal relief should then be significant compared to the ice thickness.
The vertical shear stress at net 2 is less than half of that measured at nets 1 and 3.
Net 3
The net is situated in an area with a constant surface slope. There is only small variation in the velocities but the y component increases laterally, with a lateral compression due to narrowing of Jutulstraumen as it passes Jutulrøra. The stresses in the y direction are small. The vertical shear stress is −101 kPa (opposite turning of net 1).
Basal shear stresses and velocities at depth
The driving stresses at nets 1, 2 and 3 are 180, 122 and 111 kPa. respectively. The maximum surface slopes are 0.27°, 0.32° and 1.01°, respectively. Errors in the surface slope cause up to 5% error in the basal stress at net 2 and about 1% in nets 2 and 3. Errors which originate from surface slope will be of a similar magnitude for the calculated basal stresses. The calculated basal shear stress at net 1 is 180 kPa, i.e. equal to the driving stress. This indicates that the surface stresses balance each other. At net 2 the basal shear stress is 227 kPa, twice the driving stress. This is caused by imbalance of surface stresses and a relatively constant stress field in the upper 1500 m. The basal shear stress at net 3 is 146 kPa, 32% higher than the driving stress. The difference between the driving stress and the Irasal shear stress in net 3 is small compared with net 2, because the stresses are integrated over a smaller depth interval. The ice temperature has a smaller influence on the calculated horizontal shear stresses. The results from “temperature-calculated” and “isothermal” (Fig. 5) profiles differ by less than 3% at net 1 where the driving stress is almost equal to the basal shear stress. When the surface stresses become more important, as in nets 2 and 3, assumed softer ice at depth makes the basal shear stress 13% less (for both nets 2 and 3) than for the case where the ice is treated as being cold and stiff.
Both driving stresses and calculated basal stresses are large, indicating that the base supports the stresses. The basal shear stress in net 2 is 186% larger than the driving stress. That is mainly due to longitudinal deviator stress in the lateral direction. Net 2 is located on a topographic high that probably overlies a hill in the basal topography. The basal hill supports the stresses from the deeper areas at the sides.
At the ice-stream margins (nets 1 and 3), the basal shear stress is lower than in the middle. Side drag is of the same magnitude as basal shear stress and equally important in supporting driving stresses.
Velocities calculated at depth are shown in Figures 7 and 8. The basal velocities are calculated as 50, 171 and 110 m a−1 for nets 1, 2 and 3, respectively. Velocity at depth is strongly dependent on the ice temperature through its effect on the flow parameter. If the lower 1–2% of the ice thickness is treated as softer ice (by increasing the flow parameter 5 times), the basal velocities become zero at all nets. Thus, sliding velocity cannot be accurately calculated and the only conclusion that can be drawn with confidence is that there is a steep velocity gradient close to the bed.
At net 2 the flow direction at the base is significantly different from that at the surface. The y component of the velocity decreases to zero, while the x component remains unchanged. In theory, the force-balance method should accurately predict such changes at depth. The effects of basal topography on flow direction should diminish upward into the ice. The ice at the base will, if possible, divert flow around the obstacle while the ice at the surface is much less affected by bedrock undulations. The flow direction at depth in net 2 turns in the direction of the depression in surface topography shown east of the strain net in Figure. 4. The depression is one possible reason for the turning.
In Equations (1), (2) and (3) the gravity components balance the stresses acting on the surface of an element. During integration of the force-balance equations, it is assumed that the measured strain rates and the indirectly measured gravity components (the surface slope) are representative at depth. As a guide, the distances between stakes should equal the ice depth where the deformations need to be studied. The surface slopes and strains could be calculated from increased surface areas during the vertical integration process. However, this would cause loss of resolution at the depth where interesting deformations originate. Looking at Figure. 7, a “representative gravity angle” in the x direction at net 2 increases when a larger distance at the surface is used. A larger surface angle causes a larger decrease of the x component at depth but does not necessarily diminish the turn of the flow direction. A larger surface angle in the x direction also influences the velocity field in the y direction, because the effective shear stress at depth increases. Using a surface angle in the x direction to calculate zего x velocity at the base gives a high negative velocity in the y direction (the main flow direction)! Thus, the turning cannot be explained from surface-angle input.
The calculations and their sensitivity to surface angles indicate that the y component of the velocity decreases due to internal deformation, while the x component is more stable at depth. The extension in the x direction supports this. The flow direction at the surface is mainly governed by the surface slope. Closer to the bed, bedrock topography will have more influence and changes in the channel geometry introduce longitudinal stresses.
The stress variations over short distances are greater in Jutulstraumen than reported for some other ice streams (Reference Van dar Veen, and Whillans,Van der Veen and Whillans, 1989b). Jutulstraumen flows within a wide channel in the bedrock and, together with high basal shear stress, this distinguishes such ice streams in East Antarctica from many counterparts in West Antarctica. Even though the ice thickness is more than 2000 m, the surface seems to be influenced by bottom topography. This implies that the velocity close to the bed is significant, regardless of whether there is pure sliding or strong basal deformation. The ice fabric at the base, together with high basal shear stress, probably supports a significant basal movement by deformation. The basal ice is probably highly plastic, so that the strain rates are not well defined as a function of the deviator stress components (Reference Høydal, and Peltier,Høydal, 1993). If so, then any prediction of velocity changes close to the base can only be hypothetical.
The large gradient in surface velocity from the sides towards the middle of the ice stream do probably also cause basal movements of cold ice around the nunataks. Glacial striations are found on the top of the nunatak Nordre Nashornkalven. They originate probably from the last ice age with a colder climate than today. The ice thickness was then at least 100 m thicker than today.
Mass flow
Volume flux through the profiles is determined using depth-varying velocities rather than by assuming plug How. For each strain-net location, the along-flow velocity is integrated over depth and die ratio of the depth-averaged velocity to the surface velocity is computed as 0.93, 0.87 and 0.96 for nets 1, 2 and 3, respectively. Error in the factors is estimated to be less than 10%. The factor is interpolated between strain-net locations and used to compute volume flux through the entire profile. The calculations are shown in Table (1). The volume flux between Jutulrøra and Nashornkalven is 10.78 km3 a−1 and 2.35 km3 a−1 across Viddalen. This gives total 13.13 km3 a−1 outflow at 72°15′S. The error with respect to the above factors should be less than 1.0 km3a−1.
Reference Decleir,, Аutenboer. and Craddock.Decleir and Van Autenboer (1982) calculated the discharge between Jutulrøra and Nashornkalven as 12.48 km3 a−1 or 1.7 km3 a−1 higher than the present study. They made no attempt to estimate the reduction of horizontal flow with depth. This, together with the higher resolution of surface velocities used in the present study, explains the deviation of their result. The flow out of Viddalen also belongs to the Jutulstraumen drainage system and must be included; when this is added, the present study gives an outflow about 5% higher than that of Reference Decleir,, Аutenboer. and Craddock.Decleir and Van Autenboer (1982). Reference Bentley,, Giovinetto., Weller,, Wilson, and Seberin,Bentley and Giovinetto (1991) used 16 Gta−1 as input (accumulation) and an outflow equal to 11 Gta−1 and concluded that Jutulstraumen was not in balance. A large uncertainty is caused by poorly known accumulation and at present it is not possible to say whether the area is truly in or out of balance. Planned Norwegian field work for the coming years includes obtaining better accumulation estimates from shallow snow cores.
The main uncertainly in these calculations is the ice thickness from gravity measurement presented by Reference Gjessing.Gjessing (1972) and reinterpreted by Reference Decleir,, Аutenboer. and Craddock.Decleir and Van Autenboer (1982). Minor errors in the depth profiles probably have little influence on the mass-flow shape factors. The flux in Table (1) is then proportional to ice thickness and improved ice-thickness data would reduce the error in the flux estimates.
The lower part of Jutulstraumen (downstream of the profile) is estimated to be 6200 km2 or 5% of the total catchment area. Assuming that the net balance here is 0.40 m a −1 (in w.e.), this gives a volume of 2.5 km3 a−1. The total outflow from Jutulstraumen across the grounding line should then be about 15.6 km3 a−1.
Summary
Jutulstraumen is an ice stream with a warm base and large basal shear stress. The temperate ice at the base is caused by the movements of the ice stream itself. Large basal shear stresses lead to high effective strain rates. It is important that the force-balance calculations are performed such that the effective strain rate is calculated progressively downwards. Assumptions about the flow law and temperature are not important in computing the basal shear stress. However, these assumptions are important in relation to the depth variation of the horizontal velocity. The large basal shear stress and warm basal temperatures computed here imply that basal sliding occurs. Calculated values of basal sliding range from 50 to 171 ma−1.
The basal topography controls the flow direction and this indicates that the basal relief is significant compared to the ice thickness. There is good agreement between measured deformations and observed flow patterns and topography.
The discharge between Istind and Nordre Nashorn-kalven is 2.35 km3 a−1. Between Nordre Nashornkalven and Jutuirøra the discharge is 10.78 km3a−1. The total discharge through the profiles is 13.1 km3 a−1.
Acknowledgements
I thank J. Kohler, I. Whillans and O. Orheim for helpful comments during the writing process and especially I thank C. Hulbe for suggesting improvements on the structure of the paper and improving the clarity of the writing.
I also thank the members of NARE 92/93 who participated in the field work. They were B. Barstad, T. Eiken, J.О. Hagen, В. Lytskjold, К. Melvold. H.H. Thomsen and J.G. Winther. This paper is Norsk Polarinstitutt Contribution No. 310.


