


Introduction
Dielectric relaxation and internal friction of ice in the audio-frequency range have been attributed to the Bjerrum defects, i.e. either the absence of a proton or the double occupancy of a single hydrogen bond in the ice structure (Bjerrum, 1951; Gränicher and others, 1957; Onsagar and Dupuis, 1962 ; Bass, 1958). This mechanism has been recently questioned, since up to five separate dielectric relaxation spectra have been observed with the advent of more sensitive equipment and better samples, indicating that many other mechanisms are operating (Von Hippel, 1971).
These new data cannot be adequately explained by a single point-defect mechanism. No theory based on the point-defect mechanism could successfully incorporate the new relaxation data involving the effects of handling and annealing. A series of experiments, on which a paper is in preparation, which measured the charge on dislocations in ice as well as the dependence of dielectric properties on sample handling, age, and plastic deformation indicates that some of the dielectric relaxation spectra in the audio-frequency range may be controlled by the motion of charged dislocations. To define the extent of dislocation contribution to the dielectric relaxation spectra, measurements of the dielectric properties of dislocation-free ice were undertaken.
Experiment
Vapor-grown ice crystals, such as hoar frost, generally have a relatively large dislocation-free area (Mizuno, 1973). A Lang X-ray topogrami of a hoar-frost crystal shown in Figure 1 illustrates the dislocation-free area in the drawn circle. The dark parallel lines are due to Pendelösung fringes caused by differences in thickness or stacking faults (personal communication from A. Higashi). No dislocation lines are seen within the circle. Field directions of all measurements were very close to the <0001> direction.

Fig. 1. X-ray topogram of vapor-grown (hoar-frost) ice crystal. Differences in thickness make the parallel lines. Dielectric relaxation was measured in the dislocation-free area in the circle before and after scratching. Length of diffraction vector (arrow) is 1 mm.
The size of the crystal is small and any kind of handling may introduce dislocations. A special mercury electrode system was therefore used to measure small sample areas without introducing dislocations into the crystal. Figure 2 indicates the schematic diagram of the electrode system. The area of contact was roughly 1 mm2 depending on the applied pressure. A General Radio GR 1615 a.c. bridge system was used for the capacitance and loss measurements at frequencies between 20 Hz and too kHz. Since no air gap is formed, most problems associated with solid electrodes can be avoided, although direct contact of mercury on the ice crystals would cause an electrode polarization which may affect the results. The situation is still comparable to most previous measurements which used evaporated gold electrode systems. Every effort was made to establish the maximum possible contact area so that stray capacitance is minimized. Sample temperature was measured by a thermocouple in the air near the sample.

Fig. 2. Schematic diagram of electrode system.
Results
The real and imaginary parts of the capacitance C′, C″ of dislocation-free ice are shown in Figure 3 by dashed lines. A Cole-Cole plot of the dielectric measurements is shown in Figure 4 by triangles. Note that very little change is observed in the plot of C′ and C″ versus frequency, still the Cole–Cole semi-circle is a reasonable shape considering the difficulties in measuring such a small sample. Absolute values of dielectric constants and loss could not be determined since the area of the electrodes varies with the pressure applied to the crystal and the thickness of the crystal was also not uniform. Assuming that κ? ′ = 3.2 (the value for 100 kHz), the static dielectric constant κ0 ′ was calculated as 3.8 and the relaxation time τ was 8.3 × 10⁻⁶ s at —20°C for this particular sample (M20/6). τ and κ0 ′ were calculated from the slope and intercept from a plot of C′ versus κ″ω after Von Hippel and others (1971). A rough calculation of κ?′ determined from the thickness of the ice and the size of the electrodes agreed within an order of magnitude. The range of values of other samples is shown in Table I.
The same area was then scratched by the tip of a hypodermic needle through the upper mercury electrode to introduce dislocations, and dielectric relaxation was measured again. The result, shown in Figure 3 by solid lines, indicates an enormous change in both the real and imaginary parts of the dielectric constants. Little change in C′ at 100 kHz was observed before and after the scratching indicating that the change in contact area is not the cause of this drastic change. Although the Cole–Cole plot shown in Figure 4 by filled circles was considerably skewed, two pronounced spectra (τ = 8.85 × 10⁻⁶ and 6.23 × 10⁻³ s at —18°C) were found neither of which fit the range of spectrum 3 defined by Von Hippel and others (1971).

Fig. 3. Frequency versus real (C′) and imaginary (C″) parts of capacitance before (M 20/6) and after (M 20/7) scratching.

Fig. 4. Cole–Cole plot of the data from M 20/6, M 20/7, and M 21/1, assuming that the dielectric permittivity for 100 kHz is 3.2.
Table I. Data with κ 0 ′ smaller than 10

The same batch of hoar frost also included crystals with very high dislocation density (as shown in Fig. 5), presumably due to interaction with neighboring crystals. The dielectric relaxation of the encircled area in Figure 5 is shown by solid lines in Figure 6, together with the data from dislocation-free ice (dashed line). Both C′ and C″ were very large compared with the dislocation-free area. Even the high-frequency end of the spectrum is considerably higher than for the dislocation-free ice. As shown in Figure 4 by open circles, the Cole–Cole plot was close to that of normal ice. Therefore, the anomalously small relaxation strength also shown in Figure 4 is not an artefact due to this peculiar electrode system or sample preparation.

Fig. 5. X-ray topogram of crystal with high dislocation density. Dielectric relaxation of the circled portion is shown in Figure 6. Length of diffraction vector (arrow) is 1 mm.
Dielectric relaxation measurements on the second crystal were made in areas with some dislocations (A) and with no dislocations (B) shown in Figure 7. As shown in Figures 8 and 9, small numbers of existing dislocations drastically modified the relaxation spectra, especially in the low-frequency range. Difference in C′ at 100 kHz is small, indicating that the ratios of area to thickness of areas (A) and (B) were not much different. The major source of the difference is, therefore, in the crystal. Analysis of the results from area (A) indicated widely spread relaxation spectra.
It was still suspected that an unobservably thin air gap or dielectric film might have caused the anomalously small dielectric relaxation in dislocation-free ice. An experiment was therefore made using ice with a high dislocation density (κ 0 ′ = 106) in order to determine whether an invisible air gap could be created which reduced κ 0 ′ to the observed range of 4 to 6. No such invisible gap could be created, and κ 0 ′ dropped to the observed range only when the air gap was visible. The apparent relaxation time on this ice–air-gap system also dropped to about one-tenth that of ice. A theoretical calculation of the ice—air-gap system indicated that an air-gap thickness of 0.1 to 0.2 mm would be required to reduce κ 0 ′ to the observed value of 6. This would also reduce the apparent relaxation time to about one-tenth of the original value, as found in the experiment with the deliberately introduced air gap. If a dielectric film is responsible for the reduction of κ 0 ′, the thickness must be thicker than 0.2 mm unless the dielectric permittivity is smaller than 1. The existence of such dielectric material is unknown to us. Therefore, an invisibly thin air gap or a dielectric film cannot be responsible for the anomalously small dielectric relaxation. If the mercury electrodes make visual contact with the ice specimen, the anomalously small dielectric relaxation is not caused by an air gap or film but by the sample itself.

Fig. 6. Frequency, versus C′, C″ of area with high dislocation density (M 21/1, solid lines) compared with the dislocation-free area (M 20/6, dashed lines).

Fig. 7. X-ray topogram of hoar frost with some dislocation (A) and dislocation-free (B) areas. Length of diffraction vector (arrow) is 1 mm.

Fig. 8. Frequency versus C′ and C″ of dislocation free area (dashed line) in the circle B shown in Figure 7 (M 24/2) are compared with that of the area A with some dislocations (solid line) (M 24/1).

Fig. 9. Cole–Cole plots of M 24/1 and M 24/2 indicate the drastic modification of the dielectric relaxation spectra by a small number of dislocations. Relaxation time τ and static dielectric permittivity κ0′ are calculated for the higher frequency range of the relaxation spectrum.
Another possible experimental error which may cause extremely small capacitance in the low-frequency range is stray capacitance in the untouched area. This possibility was pointed out by Dr G. P. Johari (personal communication). Theoretical calculation in the worst case (mercury making contact with ice at the highest point only), however, yielded an apparent static dielectric constant κ0 = 20 for the geometry of the present measurements which was not included in the data presented here. Experiments using high dielectric materials such as titanate ceramics supported this calculation.
Discussion
The results described here indicate that dislocations make large contributions to the dielectric relaxation. Two possible mechanisms to explain this large contribution are:
-
Dislocations may be a source of point defects which are then responsible for the dielectric relaxation (e.g. Bjerrum defects).
-
Since dislocations are electrically charged and are able to be driven by an electric field (Itagaki, 1970), polarization due to displaced charged dislocations can contribute to the dielectric relaxation (Itagaki, 1969; Brantley and Bauer, 1969).
The first mechanism is unlikely, since the analysis of the relaxation spectra indicated that the contribution of spectrum 3 (defined by Von Hippel and others, 1971 and widely attributed to the Bjerrum defect) to the dielectric polarization of dislocation-free ice is very small if any. Frequently a very weak and poorly defined spectrum 3 was observed for strain-free ice of low dislocation density. Dislocation-free ice showed no spectrum 3. Scratching the ice by a hypodermic needle does not produce spectrum 3. If dislocations are the source of point defects which are responsible for the spectrum 3, a strong increase in spectrum 3 should be expected.
Since the high-dislocation area of hoar frost revealed normal spectrum 3, absence of spectrum 3 in dislocation-free hoar frost crystal cannot be caused by any peculiarity in the mercury electrode system nor in the hoar frost sample. Usually a well-defined and developed spectrum 3 was observed in the strain-free ice of low dislocation density only after considerable straining. The theory based on the Bjerrum defect seems to give serious difficulties if one tries to explain the spectrum 3 by it.
Theoretical studies (in preparation for publication) indicated that the second (charged-dislocation) mechanism is able to produce a dielectric polarization, as large as observed, including widely distributed relaxation times. The same dislocation system is also able to cause the internal friction peaks observed in ice (Kneser and others, 1955; Schiller, 1958; Kuroiwa, 1965; VanDevender and Itagaki, 1973). However, the reason why the relaxation strength and relaxation time of spectrum 3 was consistent for the wide range of sample preparation and handling made by previous researchers is not clear to the present author as yet. Probably dislocation networks produced during the heavy deformation may be responsible. None of the previously published data were obtained from strain-free ice.
In order to explain dielectric relaxations by the charged dislocation mechanism, most of the dislocations have to be screw dislocations since dielectric constants have little anisotropy. Edge dislocations cannot move out of the basal plane; therefore, no contribution to dielectric polarization in the c direction by electrically charged edge dislocations is expected.
Hayes and Webb (1965), Webb and Hayes (1967), and Fukuda and Higashi (1969) identified the majority of dislocations in ice as ![]() type screw dislocations. Itagaki (1970) found that most of the dislocations can be driven by an electric field indicating that the screw dislocations can be electrically charged. Attempts were made to establish that the screw dislocations are electrically charged. Although the results obtained are still inconclusive and more well-controlled experiments are required, some hopeful results have been obtained. A brief discussion is given in the Appendix.
type screw dislocations. Itagaki (1970) found that most of the dislocations can be driven by an electric field indicating that the screw dislocations can be electrically charged. Attempts were made to establish that the screw dislocations are electrically charged. Although the results obtained are still inconclusive and more well-controlled experiments are required, some hopeful results have been obtained. A brief discussion is given in the Appendix.
The cause of the residual relaxation is not clear. The values of ,κ 0 ′ and τ were scattered over a wide range beyond the error of the measurements, indicating a feature sensitive to structure. Dislocations may be generated at the edge of the mercury electrodes by the strong surface tension, or some other cause (oxidized mercury seems to be able to create dislocations) may cause the residual relaxation. Bjerrum defects may be another possible cause.
It is interesting to note that d.c. conductivities measured in dislocation-free areas were considerably lower than the conductance of the best quality ice known to date (2 × 10⁻⁹ Ω–1m–1) (Camp and others, 1967). Scratching increased the d.c. conductance one order of magnitude above the value for an unscratched sample. These findings seem to indicate that charged dislocations are also responsible for the d.c. conductance either by the production of point defects (presumably by ionic defects) or by conduction through the dislocation core.
The results described here indicate that a major part of the dielectric relaxation is caused through the dislocation process, though the origin of the charge, as well as the motion of dislocations, may be controlled by the point defects (Glen, 1968; Whitworth and others, 1976).
Appendix
A single crystal of ice from the Mendenhall Glacier was oriented and cut to a 5 ? 5 ? 5 cm3 cube having major axes parallel to the edges of the cube. The cube was deformed about 10% parallel to the basal plane in a <1120> direction by simple shear strain and cut into five slabs parallel to {1010} plane after the deformation as shown in Figure A.1. Since screw dislocations having Burgers vectors of opposite sign would move towards opposite directions under this shear condition, slab A would be dominated by dislocations with Burgers vectors of positive sign while slab E would be dominated by dislocations with Burgers vectors of negative sign after the shear. Dislocations with Burgers vectors of both signs should have the same sign of charge, otherwise the sign of the charge would be different depending on the coordinate system which define the sign of the Burgers vector.
A rectangular bar of 1 ? 1 ? 5 cm3 having its longest axis parallel to <1 120> was cut from each slab. The bar was mounted in a three-point bending system with the basal plane as the bending plane. Silver electrically conducting paint was used to make a pair of electrodes on the {1010} plane in the area where the stress was mostly shear. The pair of electrodes were connected to a General Radio 1230A electrometer through a coaxial cable. Two types of recording were made by using a Hewlett-Packard 7 100B two-pen chart recorder for time versus stress and time versus charge generated. A Hewlett-Packard 7005B X-Y recorder was simultaneously used for stress versus charge generation.

Fig. A.1. How the single-crystal block was sliced into five slabs after about 10% shear creep.
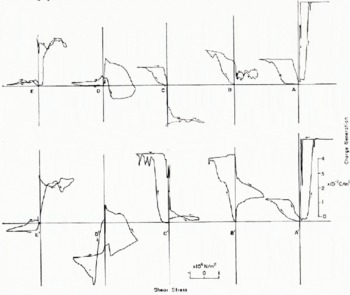
Fig. A.2. Charge generation of slabs A–E of Figure A.1 by shear stress.
Figure A.2 shows the relationship between stress (abscissa) and charge generation (ordinate) for a fresh sample (top) and after several cycles (bottom). These results indicate that very complex processes are involved. Except for the right-hand portion (positive stress) of slab A, however, a definitely different trend between slab E and slabs A, B, and C can be seen. In slab E, positive stress produced positive charge, while in slabs A, B, and C negative stress produced positive charge. Since all slabs were tested under identical conditions, these results can be explained by assuming that slab E was rich in dislocations with negative Burgers vectors while slabs A, B, and C were rich in positive Burgers vectors and slab D contained mixed-sign dislocations. These results are encouraging, although oversimplification of the problem is evident. The source and sink of the dislocations, especially on the surface, may play an important role and the positive stress side of slab A may be controlled by the surface dislocation sources.
Discussion
J. Perez: Do you think that dislocation-free crystals should also have a very small mechanical relaxation?
K. Itagaki: Quite possibly so.
Perez : R. Vassoille in our laboratory has done low-frequency internal-friction measurements on various ice single crystals with dislocation densities from 103 to about 107 cm–2. No fundamental difference was observed in the relaxation peak only the high-temperature internal friction was affected by the variation of dislocation density.
Itagaki: Probably your lowest dislocation density is still too high. [Written addition to reply:] Normally the dislocation density required to produce the observed internal friction peak according to the Granato–Lucke theory is of the order of 105/m2, which is two orders of magnitude lower than the dislocation density you mention. Hoar frost crystals frequently produce a clean high tone when hit by a hard object, unlike ordinary processed and formed ice. Probably this fact indicates that the internal friction is pretty low at around —10°C.
J. G. Paren: How stable is the behaviour you observe ? Your samples have high specfic area and are formed at low temperature (—16°C or —20°C) by vapour deposition. Some measurements suggest that ageing may occur to dielectric behaviour in this configuration.
Itagaki: Unfortunately I cannot keep the crystal from sublimation for more than two days. Within this time span the change was usually negligible. The best flat hoar frost grew around —16°C in air. In the earlier studies I grew hoar frost at a somewhat lower temperature around —20°C, which resulted in a stepped surface structure.


