


Introduction
The dust concentration in Antarctic ice cores has been widely discussed as a proxy for terrestrial material (Reference Fujii, Kohno, Matoba, Motoyama and WatanabeFujii and others, 2003; Reference Delmonte, Petit, Andersen, Basile-Doelsch, Maggi and LipenkovDelmonte and others, 2004b; Reference WolffWolff and others, 2006; Reference Fischer, Siggaard-Andersen, Ruth, Röthlisberger and WolffFischer and others, 2007). Dust is generally measured by melting ice samples, then using the laser scattering method (LSM) to count insoluble particles that remain (e.g. Reference Fujii, Kohno, Matoba, Motoyama and WatanabeFujii and others, 2003) or the Coulter-counter method (e.g. Reference Delmonte, Petit and MaggiDelmonte and others, 2002). Using the Sr-Nd isotopic fingerprint, the different sites located on the East Antarctic plateau (e.g. Vostok, Dome B, European Project for Ice Coring in Antarctica (EPICA) Dome C) have shown that South America and mainly Patagonia is the dominant supplier of dust in East Antarctica during glacial ages (Reference Basile, Grousset, Revel, Petit, Biscaye and BarkovBasile and others, 1997; Reference DelmonteDelmonte and others, 2004a, Reference Delmonte2008a). Conversely, the question is still open for interglacials (Reference Revel-RollandRevel-Rolland and others, 2006; Reference Delmonte, Petit, Basile-Doelsch, Jagoutz, Maggi, Sirocko, Claussen, Goñi and LittDelmonte and others, 2007, Reference Delmonte, Delmas and Petit2008b). There is no report of Sr-Nd isotopic data on dust from the Dome Fuji ice core, but one can reasonably assume the same provenance as for Dome C, Vostok and Dome B.
Unlike dust, the calcium and sodium ion concentrations in an ice core (Reference WatanabeWatanabe and others, 2003; Reference WolffWolff and others, 2006; Reference Fischer, Siggaard-Andersen, Ruth, Röthlisberger and WolffFischer and others, 2007) are usually analyzed by ion chromatography (IC; e.g. Reference Legrand, De Angelis and DelmasLegrand and others, 1984, 1993) or continuous flow analysis (Reference RöthlisbergerRöthlisberger and others, 2000) after melting the sample. Such ion concentrations are considered a proxy for some soluble materials. In deep Antarctic ice cores, for example, the dust and non-sea-salt (nss) calcium ion concentrations are closely related over glacial cycles: both are generally higher in cold stages and lower in warm stages. The nss-calcium ion concentration is therefore considered a proxy for terrestrial material similar to dust (Reference WolffWolff and others, 2006; Reference Fischer, Siggaard-Andersen, Ruth, Röthlisberger and WolffFischer and others, 2007). Sodium ions are thought to come from sea salt in the Southern Ocean and/or southern sea ice (Reference WolffWolff and others, 2006) or from dust (nss-sodium) (Reference RöthlisbergerRöthlisberger and others, 2002). During glacial ages, the ratio of nss-sodium is larger than that during interglacials (Reference RöthlisbergerRöthlisberger and others, 2002).
However, it is natural to assume that insoluble dust and soluble calcium ions are distinct environmental proxies. In the Dome Fuji ice core, calcium and sodium ions have recently been found by Raman spectroscopy to exist as solid salts in ice crystals (Reference Ohno, Igarashi and HondohOhno and others, 2005). Raman measurements provide the chemical forms of several tens of particles per ice sample. However, it is difficult to compare data on solid particle compounds with the number density of dust particles or calcium ion concentration in a statistically meaningful way. On the other hand, calcium ions in particular are thought to exist mainly as calcium sulfate (Reference IizukaIizuka and others, 2008). This compound probably originated in terrestrial gypsum, following the reaction of terrestrial calcium carbonate with sulfuric acids (e.g. Reference Legrand and MayewskiLegrand and Mayewski, 1997; Reference DelmasDelmas and others, 2003). Sodium ions are thought to exist mainly as sodium chloride and sodium sulfate (Reference IizukaIizuka and others, 2008). The latter probably originated in the reaction of sea salt (mainly sodium chloride) with sulfuric acid (e.g. Reference Legrand, Lorius, Barkov and PetrovLegrand and others, 1988; Reference DelmasDelmas and others, 2003). While these arguments are reasonable, deducing the concentrations of chemical compounds from ion concentrations requires some estimation.
This paper discusses the differences between the methods mentioned above, in particular comparing measurements of calcium and sodium compounds in solid particle residues obtained with and without melting the ice sample. We also introduce one technical innovation: a sublimation method capable of collecting several hundred non-volatile particles per sample at −45°C. Using scanning electron microscopy/ energy-dispersive X-ray spectrometry (SEM-EDS), we determine the constituent elements and number densities of those particles which contribute dust, calcium ions and sodium ions to the sample, and compare these results statistically with concentrations measured by IC.
Analytical Method
The Dome Fuji ice core was recovered from a high point of the East Antarctic ice sheet (77.2° S, 39.4° E; 3810 m a.s.l.) (Reference WatanabeWatanabe and others, 2003). The samples used in this study were obtained from Dome Fuji ice-core sections at depths of about 503.4, 515.4, 541.0, 557.6 and 571.9 m (Table 1). The estimated ages of these sections are 18.6, 19.5, 21.6, 22.9 and 24.2 ka BP respectively, corresponding to the Last Glacial Maximum (LGM; 18–25 ka BP). Indeed, the LGM displays the highest dust and calcium-ion concentrations in the whole Dome Fuji core (Reference Fujii, Kohno, Matoba, Motoyama and WatanabeFujii and others, 2003; Reference WatanabeWatanabe and others, 2003). Each sample was separated into two sub-samples (Fig. 1), both taken from the same ice depth. One subsample was used to measure dust, calcium-ion and sodium-ion concentrations using methods described in previous studies (Reference WatanabeWatanabe and others (2003) for calcium ions; Reference Fujii, Kohno, Matoba, Motoyama and WatanabeFujii and others (2003) for dust). We also measured the constituent elements of solid particles by filtering melted samples at 25°C (residue particles). The other subsample was used to measure the constituent elements of solid particles by sublimating the sample at −45°C (non-volatile particles), and by aqueous dissolution of the latter at 25°C (insoluble particles). The particles were analyzed using SEM-EDS. The aforementioned ice sublimation method is a novelty of this study, and permitted us to determine the constituents of many more non-volatile particles than are normally accessible via EDS measurements of the ice surface (e.g. Reference Barnes, Mulvaney, Wolff and RobinsonBarnes and others, 2002; Reference Obbard and BakerObbard and Baker, 2007).

Fig. 1. Flow chart of the analytical procedure.
Table 1. Age, δ18O value, sodium-ion, calcium-ion and dust concentrations for the five LGM sections. The age and δ18O data are taken from Reference WatanabeWatanabe and others (2003). The nss-calcium ion/dust concentration ratios (uncertainty <0.01) and (soluble Ca)/(all insoluble particles) number ratios (uncertainty <0.01) are also shown

To prepare the samples, we took about 10 g of ice from each of the five sections and cut away surface pollution using a clean ceramic knife. The remaining ice was melted in a clean Teflon bottle. About 3 g of the sample was used to measure the concentration of dust particles of 0.52–5.04 μm diameter using the same LSM method described in Reference Fujii, Kohno, Matoba, Motoyama and WatanabeFujii and others (2003) (Fig. 1). The samples were analyzed using a Model-211 spectrometer (Met One Inc.) after dilution by 64–111 times in de-gassed, ultra-pure water. The LSM method determines the dust concentration with a precision of about 10% (Reference Fujii, Kohno, Matoba, Motoyama and WatanabeFujii and others, 2003).
The remaining 7 g from each sample was filtered through a polycarbonate membrane (diameter 13 mm, pore size 0.4 μm). The calcium- and sodium-ion concentrations of the filtrate were measured by IC using the method described by Reference WatanabeWatanabe and others (2003) (Fig. 1). This technology measures the concentrations of soluble ions with a precision of better than 5%. The residue of insoluble particles on the filter was also analyzed for constituent elements (Fig. 1) using a JSM-6360LV (JEOL) SEM and a JED2201 (JEOL) EDS system. The filter paper was put on a chromium holder of inside diameter 13 mm and depth 1 mm. The accelerating voltage was 15 keV, enabling the electron beam to penetrate particles up to several μm in diameter. We also analyzed ultra-pure water with this method, passing it through the same kind of membrane, and found no residue on the filter. Thus, any contamination from our equipment is too low to affect our results. A single filter yielded at least 200 particles greater than 0.4 μm in diameter. Their constituent elements could be determined by SEM-EDS.
We obtained another sample of about 1.0 g by cutting the original sections in a cold room at −45°C, below the eutectic temperatures of major salts (Reference Ohno, Igarashi and HondohOhno and others, 2005). In this environment, almost all the soluble salts (typically NaCl, Na2SO4, NaNO3, CaCl2, CaSO4, Ca(NO3)2, MgCl2, MgSO4 and Mg(NO3)2) exist as solid particles. The ice sample was pulverized using a clean ceramic knife and placed on a membrane filter, which was then placed in a stainless-steel pipe with inside diameter 8 mm and length 100 mm (Fig. 2). The samples were treated under a laminar-flow bench (class 100). Clean, dry air with a dew point of −65°C, containing no oil or solid particles more than 0.03 μm in diameter, flowed through the stainless-steel pipe at a rate of 15 L min−1. The ice sublimated completely after about 30 hours of this treatment (corresponding to a total air volume of 27 000 L). The draft was produced by a 0.78–0.93 MPa air compressor (Hitachi oil-free Bebicon, 0.75OP-9.5GS5/6), an air dryer and a cleaner (SMC Coop. IDG60SV) as shown in Figure 2. The residue of non-volatile particles on the filter was analyzed for constituent elements using SEM-EDS, as described above (Fig. 1d and e). Again, at least 200 particles greater than 0.4 μm in diameter were left on a single filter. We analyzed a sample of frozen, ultra-pure water with exactly the same method under the laminar-flow bench, and found no particles on the filter. With a total of three filters, ice from the 541.0 m section yielded more than 1500 particles.

Fig. 2. Flow chart of the sublimation method shown in Figure 1d, and a cross-sectional schematic of the sublimation chamber.
After the SEM-EDS measurement, we dissolved water-soluble particles by immersing the filter in ultra-pure water at 25°C for 1 day (Fig. 1e and f). The residue of insoluble particles remaining on the filter was analyzed once more using SEM-EDS. In this way we obtained separate measurements of non-volatile and insoluble particles from the same sample. The 541.0 m section yielded more than 600 insoluble particles over the three filters.
With more than 200 particles per filter, the minimum relative uncertainty on any calculation using particle number should be less than 7.1% (= (200)1/2/200). With more than 1000 particles, the uncertainty should be less than 3.2%. This error assumes that the constituent elements of dust, calcium-ion concentration, sodium-ion concentration and total calcium concentration can be treated statistically as measurements from the same population. During sublimation, many chemical reactions may take place on the ice surface. In particular, volatile acids (HCl, HNO3 and H2SO4) may react with non-volatile particles.
However, the amount of contact between the acids (several μmol L−1 in the Dome Fuji LGM ice) and the microparticles (less than several μm in length) is considered to be less than the EDS lower detection limit. Therefore the effect of such acid reactions during sublimation is considered to be too small to detect by EDS.
Table 2 outlines our research scheme. We begin by evaluating significant frequencies of insoluble particles by using the constituent elements of insoluble and residue particles. We then evaluate significant frequencies of soluble particles by using the constituent elements of insoluble and non-volatile particles with insoluble-Ca/insoluble-total and insoluble-Na/insoluble-total ratios. Finally we verify our interpretations of insoluble and soluble particles by our sublimation method, by comparing soluble-Ca/all-insoluble-particles ratios by EDS, and nssCa2+/dust concentration ratios by IC and LSM.
Table 2. Research scheme of this paper

Constituent Elements of Particles Contributing to The Calcium Ion Concentration
Figure 3 shows a typical micrograph and some elemental compositions of non-volatile particles. The diameters of non-volatile particles (those remaining after sublimation), residue particles (those remaining after melting) and insoluble particles (those remaining after immersing the non-volatiles in water for a day) follow similar distributions, with means and 1σ uncertainties of 3.06 ± 2.23 μm (N = 2418 particles), 3.64 ± 1.63 μm (N = 1272) and 3.20 ± 2.06 (N = 1463) μm respectively. We do not detect a significant relationship between particle diameter and elemental composition. Hence, in some of the discussion that follows we assume the particle numbers are indicative of their volume.

Fig. 3. Microscopic photos and X-ray spectra of non-volatile particles. To the right are two SEM images showing the distribution of particles (bright spots) on the filter. From top to bottom, the left-hand panel shows typical spectra of type 1 particles containing calcium and silicate (oxygen, silicon and calcium), type 2 particles containing gypsum and silicate (oxygen, silicon, sulfur and calcium), and type 3 particles containing gypsum only (oxygen, sulfur and calcium). The carbon signal comes from the filter.
Particles were sorted into five types based on their constituent elements:
-
type 1: Si was detected but not S, implying a silicate.
-
type 2: Si and S were detected, implying a mixture of silicate and sulfate.
-
type 3: S was detected but not Si, implying a sulfate.
-
type 4: only Al and O were detected, implying alumina.
-
type 5: neither Si nor S was detected, but the particle was not of type 4.
Within each type, we also identified those particles that contained calcium. Figure 4 shows frequency distributions of the five types for each ice section sampled. More than 99% of residue and insoluble particles were type 1 or type 4. Among the non-volatile particles, 68% were type 1, 24% were type 2, 4% were type 3, 1% were type 4, and 3% were type 5 when all five sections were counted together (N = 2418). Thus, 28% of the non-volatile particles contained sulfur, but more than 99% of the residue and insoluble particles did not. The frequency distributions are similar at all five depths (Fig. 4); the results are typical of LGM ice. Furthermore, the distributions of residue and insoluble particles correspond closely. It is therefore reasonable to compare only the non-volatile and insoluble particle distributions in the following discussion.

Fig. 4. (a) Frequencies of the five elemental compositions in non-volatile (after sublimation) particles from 503.4, 515.4, 541.0, 557.6 and 571.9 m depth, and the total of the five Dome Fuji ice sections. The dark gray bars indicate particles that also contain calcium. Types 1–5 are described in the text. (b) Same as (a), but for the insoluble (after immersing the non-volatiles in water for 24 hours) particles from the Dome Fuji ice sections. (c) Same as (a), but for the residue (after melting) particles from the Dome Fuji ice sections.
Almost all sulfates are dissolved and ionized in the melting process, which changes type 2 particles into type 1 particles. This result suggests that LSM measurements of dust concentrations should detect mainly type 1 (silicate) and type 4 (alumina) particles. On the other hand, the calcium ions detected by IC come from compounds found in type 2, 3 and 5 particles. Most of the calcium is found in sulfur compounds (types 2 and 3, which together account for 264 of all 2418 particles); very little is bound to other elements (n = 25 for type 5 particles containing calcium). Of those type 5 particles that do contain calcium, very few contain nitrogen (n = 2) and none contain chlorine. Thus, assuming all particles containing both calcium and sulfur are composed of calcium sulfate, this compound is clearly the primary source of calcium ions. This assumption is supported by a previous study, which found that, in the Dome Fuji core, calcium sulfate is the primary soluble salt during the LGM, rather than calcium nitrate, calcium chloride or calcium carbonate (Reference IizukaIizuka and others, 2008).
To further justify the above assumption, some type 2 particles were analyzed using Raman spectrometry (e.g. Fig. 5). Because the polycarbonate filter produces many interfering Raman peaks and because it is difficult to sublimate the entire ice sample at −45°C without a filter, we instead perfectly sublimated a 1.0 g ice sample from the 541 m ice section on a brass plate at −15°C in about 24 hours. This procedure was performed on a clean bench, using only the ambient draft. We then identified a number of type 2 particles by SEM-EDS (Fig. 4) and identified their chemical composition using Raman spectroscopy. The Raman spectra were analyzed using the same methods reported previously (Reference IizukaIizuka and others, 2008). The type 2 particle was found to have a Raman peak at 1008 cm−1 (Fig. 5). This result strongly suggests that type 2 (and probably also type 3) particles are at least partly composed of calcium sulfate (Reference Ohno, Igarashi and HondohOhno and others, 2005). The Raman activity of silicate is much weaker than that of calcium sulfate, and particles of less than several μm diameter are expected to produce only limited scattering from this compound. Thus, the Raman spectra show only a 1008 cm−1 peak.

Fig. 5. Microscopic photo, X-ray spectrum (gray) and Raman spectrum (also gray) of a calcium-containing type 2 particle from Figure 2. The particle has a Raman peak at 1008 cm−1. The black curves are control spectra of the brass plate without any particles. The black X-ray spectrum shows copper and zinc, while the black Raman spectrum has no significant peaks.
To test our interpretation of the constituent elements in non-volatile and insoluble particles, we calculated the proportion of insoluble particles containing calcium in each of the five depth sections (Table 3, column 1). We were also able to calculate the ratio of insoluble particles containing calcium among non-volatile particles (Table 3, column 2) by making the following assumptions: (1) any calcium in type 1 particles is insoluble (calcium in silicate); (2) any calcium in particles of type 2, 3 or 5 is soluble; (3) type 2 particles with calcium change to type 1 particles without calcium when immersed in water; and (4) all type 1 and type 4 particles are insoluble. Thus, the only insoluble particles containing calcium among non-volatiles are of type 1, but types 1, 2 and 4 may all be considered insoluble. The ratio in the second column of Table 3 is
Table 3. The ratio of insoluble particles containing Ca to all insoluble particles (uncertainty <0.01), and that of insoluble Na-containing particles to all insoluble particles (uncertainty <0.02). These ratios are determined by two methods: by directly counting the particles remaining after immersing the non-volatiles in water for 24 hours, and by assuming chemical compositions for the non-volatile particles based on their constituent elements. The ratio of insoluble Al-containing particles to insoluble Si-containing particles is also shown (uncertainty <0.07)

where N type1_Ca is the number of type 1 particles containing calcium. The differences between the two ratios for the same depth section range from 0.01 to 0.03. With more than 200 (1000) particles per filter, the minimum relative uncertainty on any calculation using the above equation will be <19.1 (8.6)%. The consistency of these assumptions and calculations suggests that our interpretations are probably reasonable concerning the role of calcium in each type of particle.
Assuming that the ion concentrations measured by IC at 25°C and 1 atm come entirely from calcium sulfate, the solubility of calcium sulfate is 0.015 mol L−1, three orders of magnitude higher than the calcium ion concentrations observed in LGM samples taken from the Dome Fuji ice core (Reference WatanabeWatanabe and others, 2003). It is likely that all calcium sulfates are dissolved during the melting process, while almost all calcium-containing silicates (type 1 particles) resist dissolution. (If acids such as H2SO4, HNO3 or HCl are present in the sample, they may dissolve a few silicates.) Reference SalaSala and others (2008) found calcium carbonates in firn from coastal Antarctica. Almost all calcium carbon ates are assumed to have reacted with sulfuric acid to form calcium sulfate during transportation in the Antarctic atmosphere and/or redistribution in inland firn (Reference IizukaIizuka and others, 2008). We conclude that the insoluble dust consists entirely of silicate particles, and that almost all calcium ions come from dissolved calcium sulfate. Furthermore, the LGM section has one of the highest calcium concentrations in the Dome Fuji core (Reference WatanabeWatanabe and others, 2003).
Constituent Elements of Particles Contributing to The Sodium Ion Concentration
This section discusses the role of sodium in the observed particles. To determine which particles contribute to the sodium ion concentration, we classify the non-volatile, residue and insoluble particles into seven types based on their constituent elements. (Note the roman numerals, distinguishing these types from those defined in the previous section.)
-
type I: Si was detected but neither S nor Cl, implying silicate.
-
type II: both Si and Cl were detected, implying a mixture of silicate and chloride.
-
type III: both Si and S were detected, implying a mixture of silicate and sulfate.
-
type IV: Cl was detected but neither Si nor S, implying chloride.
-
type V: S was detected but neither Si nor Cl, implying sulfate.
-
type VI: only Al and O were detected, implying alumina.
-
type VII: neither Si, S nor Cl was detected, but the particle was not of type VI.
Within each type, we also identified those particles containing sodium. Figure 6 shows the frequency of constituent elements in each of the five sections. More than 99% of the residue and insoluble particles were either type I or type VI. Of the non-volatile particles taken from all five sections (N = 2479), 61% were type I, 7% were type II, 23% were type III, 2% were type IV, 4% were type V, 1% were type VI, and 2% were type VII. Thus, 35% of the non-volatile particles contain sulfur or chlorine; more than 99% of the insoluble particles, however, do not.
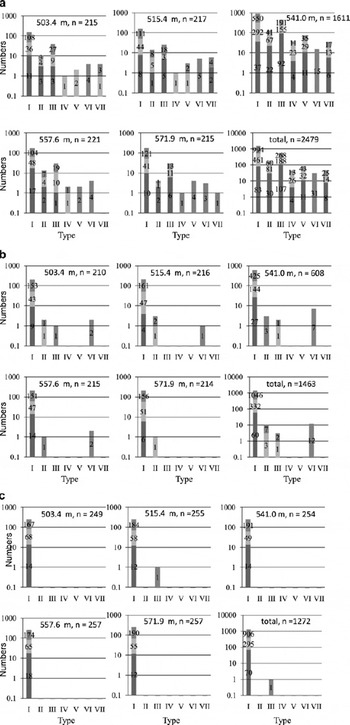
Fig. 6. (a) Frequencies of the seven elemental compositions in non-volatile (after sublimation) particles from 503.4, 515.4, 541.0, 557.6 and 571.9 m depth, and the total of the five Dome Fuji ice sections. The light gray bars indicate particles containing sodium but not calcium, the lower (dark gray) bars indicate particles containing both sodium and calcium, and the upper bars indicate particles containing neither. Types I–VII are described in the text. If a particle has both S and Cl, we classify the particle as both type II and III (this is also the case for types IV and V). For this reason, the total numbers of particles reported here are different from those in Figure 4. (b) Same as (a), but for the insoluble (after immersing the non-volatiles in water for 24 hours) particles from the Dome Fuji ice sections. (c) Same as (a), but for the residue (after melting) particles from the Dome Fuji ice sections.
Following our interpretation of the calcium content, the difference between insoluble and non-volatile particles arises because almost all sulfates are dissolved and ionized in the melting process. Type II and type III particles therefore change to type I particles. The sodium-ion concentrations measured by IC include chemical compounds found in type II, III, IV, V and VII particles. Most of the sodium is bound to chlorine (n = 141 for types II and IV) or sulfur compounds (n = 338 for types III and V). Little is bound to other elements (n = 22 for type VII). If we assume that all particles containing sodium and sulfur are composed of sodium sulfate, and that all those containing sodium and chlorine are sodium chloride, then these two compounds are the primary source of sodium ions. This assumption is supported by recent studies, which have found that sodium sulfate and sodium chloride are the primary soluble salts occurring in the LGM section of the Dome Fuji core (e.g. Reference IizukaIizuka and others, 2008).
To test this interpretation, we calculate the proportion of insoluble particles containing sodium in the five depth sections individually (Table 3, column 3). On the basis of IC and Raman spectroscopy, our previous studies (e.g. Reference IizukaIizuka and others, 2008) suggest that calcium sulfate formed in preference to sodium sulfate where sodium and calcium coexisted in the LGM section of the Dome Fuji core. Thus, particles containing sulfur, sodium and calcium (occurring in types III and V) are assumed to consist of calcium sulfate and sodium-containing silicate.
We were also able to calculate the proportion of insoluble, sodium-containing particles among non-volatile particles (Table 3, column 4) by making the following assumptions: (1) the sodium in type I particles is insoluble, as are the sodium and calcium in type III and V particles (they are in silicates); (2) any sodium in type III and type V particles not bound to calcium is soluble; (3) any sodium in particles of types II, IV and VII is soluble; (4) type II and type III particles change to type I particles when immersed in water for 24 hours; and (5) type I and type VI particles are insoluble. The proportion of insoluble, sodium-containing particles among all insoluble, non-volatile particles can therefore be expressed as
where N typeI_Na, N typeIII_NaCa and N typeV_NaCa are the numbers of particles containing sodium and/or calcium among particles of types I, III and V respectively. The differences between the ratios are less than 0.03 for each depth, as shown in Table 3. Thus, the two measures are statistically equivalent. With more than 200 (1000) particles per filter, the minimum relative uncertainty on any calculation using the above equation should be less than 26.1 (11.4)%. The level of consistency between the two methods strongly suggests that our description of the sodium degeneration due to melting of the sample and dissolution in water is reasonable.
Constituent Elements of The Dust Particles
As described in the previous two sections, most of the insoluble particles in Figures 4 and 6 are type 1/I (silicates) or rarely type 4/VI (alumina). This suggests that LGM dust consists mainly of silicate. The last column of Table 3 indicates the ratio of aluminum-containing particles to all silicate particles of the residue. In all five sections, the ratios are extremely similar (0.88–0.93). Figure 7 shows the number of type 1 particles containing the five major metals (Na, Mg, K, Ca, Fe). These five metals also have similar frequency distributions in each of the five sections. These results imply that insoluble particles (dust) had the same provenance throughout the LGM period, as shown by Reference Delmonte, Petit, Basile-Doelsch, Jagoutz, Maggi, Sirocko, Claussen, Goñi and LittDelmonte and others (2007).

Fig. 7. The occurrence of Na, Mg, K, Ca and Fe in residue particles from the five sections. If a particle has more than one of these metals, it counts in all relevant categories. Thus, the total numbers presented here are different from those presented in other figures.
Comparing Sem-Eds Results with The Dust and Calcium-Ion Concentrations, and Reconstructing The Lgm Environment
Table 1 shows the concentrations of insoluble dust particles and soluble calcium ions measured at each depth. The average values of these two concentrations are similar to past results obtained for the whole LGM section of the Dome Fuji ice core (Reference WatanabeWatanabe and others (2003) for calcium ions; Reference Fujii, Kohno, Matoba, Motoyama and WatanabeFujii and others (2003) for dust). We now compare our SEM-EDS results for non-volatile particles with the dust and calcium-ion concentrations obtained in the previous sections. The average ratio of nss-calcium ions to dust ranges from 0.04 to 0.11 (Table 1). This assumes the density of dust particles is 2.5 g cm−3, which has been used in recent studies (Reference PetitPetit and others, 1999; Reference Delmonte, Petit and MaggiDelmonte and others, 2002, Reference Delmonte2004a; Reference Fujii, Kohno, Matoba, Motoyama and WatanabeFujii and others, 2003), and we calculate the proportion of nss-calcium ions from the average calcium- and sodium-ion concentrations (Table 1) using the method described by Reference WolffWolff and others (2006). The minimum relative uncertainty on any calculation of the ratio is <15%.
For purposes of comparison, we also calculated the ratio between soluble calcium particles and the number of insoluble, non-volatile particles (Table 1). This number assumes that (1) any calcium in type 1 particles is insoluble (calcium in silicate); (2) the calcium in particles of types 2, 3 and 5 is soluble; (3) type 2 particles change to type 1 particles when immersed in water for 24 hours; and (4) all type 1 and type 4 particles are insoluble. We further assume that the densities of calcium sulfate (CaSO4 · 2H2O) and dust particles are 2.3 and 2.5 g cm−3 respectively. The ratio is thus
where N type2_Ca, N type3_Ca and N type5_Ca are the numbers of particles containing calcium of types 2, 3 and 5 respectively. Although the particle number ratios (0.06–0.14) are slightly larger than the concentration ratios (0.04–0.11), their ranges are very similar. Furthermore, any attempt to estimate a concentration ratio from the particles will introduce a large uncertainty due to the difficulty of precisely measuring particle volumes. Taking this into account, it becomes clear that the average ratio of nss-calcium ions to dust is fairly consistent throughout the LGM. With more than 200 (1000) particles per filter, the minimum relative uncertainty on any calculation using the above equation is less than 24.2 (10.8)%. Thus, our SEM-EDS results for non-volatile and insoluble particles can be interpreted with a similar level of confidence to liquid-phase analyses such as IC and LSM.
This ratio and its millennium mean value (0.14) were both lower during the LGM than during the Holocene (0.22). (These values were calculated from data published by Reference Fujii, Kohno, Matoba, Motoyama and WatanabeFujii and others (2003) and Reference WatanabeWatanabe and others (2003). We do not use the calcium ion data around 4.9 and 7.3 ka BP because of suspected contamination in the peaks.) A similar trend to lower calcium/dust ratios during colder stages has been reported for the Greenland Icecore Project (GRIP) ice core (Reference RuthRuth and others, 2007). Ruth explains that the calcium ion composition of the source varies over time due to changes in moisture advection. Reference RuthRuth and others (2008) show that the insoluble dust elements had regime shift during the deglaciation in EPICA Dronning Maud Land (EDML) and EPICA Dome C (EDC) cores, and suggest that either the characteristics of the dust source changed or there was a change in the relative contributions of different sources. Reference Revel-RollandRevel-Rolland and others (2006) and Reference Delmonte, Delmas and PetitDelmonte and others (2008b) pointed out the same conclusion: that the dust source changed between the last glacial and the Holocene, evidenced by the EDC and Vostok cores. Our results imply that the calcium/dust ratios may reflect paleoclimatic signals for dust source environment such as changes in dust geology and/or moisture advection.
Conclusion
We measured the constituent elements of insoluble and non-volatile particles by SEM-EDS, in a sample of LGM ice taken from the Dome Fuji core, and compared our results with IC of the liquid phase. We found that the proportions of insoluble particles containing calcium and sodium are statistically consistent with the same proportions determined by counting non-volatile particles, assuming that the same elements are entirely associated with silicates and sulfates inferred from SEM-EDS. The ratio between the calcium-ion and dust concentrations measured by IC is statistically similar to that obtained by counting soluble calcium-containing particles and dust particles. We conclude that determining the constituent elements of non-volatile particles is a promising method for interpreting the chemistry of the Dome Fuji ice core.
By directly measuring the constituent elements of particles remaining after melting and sublimation of the LGM ice samples, we have drawn several conclusions. First, the insoluble dust consists mostly of silicate. Second, almost all the calcium detected by IC comes from calcium sulfate. Similarly, almost all the sodium ions come from sodium sulfate and sodium chloride. Although these facts can also be deduced by combining IC and Raman spectroscopy, this study verifies the appropriateness of these methods.
Acknowledgements
We thank the Dome Fuji drilling team, the Dome Fuji ice-core consortium and the Japanese Antarctic Research Expedition (JARE) Dome Fuji traverse. The paper was significantly improved as a result of comments by S.H. Faria and an anonymous referee, and the handling by the Scientific Editor, T.H. Jacka, to whom we are greatly indebted. This study was supported by Scientific Research (B) (grant Nos 19710001 and 21710002) provided by Japan’s Ministry of Education, Culture, Sports, Science and Technology (MEXT) and Japan’s Society for the Promotion of Science (JSPS), as well as discretionary funds from the Director of the Institute of Low Temperature Science, Hokkaido University. We also acknowledge Grants-in-aid for Creative Scientific Research (grant No. 14GS0202) and Special Education Study Expenses (cooperation between universities) provided by the MEXT and JSPS.


