


I. INTRODUCTION
Glacier surges occur in only a small percentage (<1% in number) of all glaciers (Raymond, Reference Raymond1987; Copland and others, Reference Copland2011; Quincey and others, Reference Quincey2011), with the exception of the glaciers of Svalbard, where >13% show surge characteristics (Jiskoot and others, Reference Jiskoot, Boyle and Murray1998; Hodgkins and others, Reference Hodgkins, Fox and Nuttall2007). Surging glaciers exhibit two typical features. First, they undergo quasi-cyclic oscillations between shorter active phases (days to decades), and longer quiescent phases during which the glacier retreats to its minimal position (Meier and Post, Reference Meier and Post1969; Raymond, Reference Raymond1987; Eisen and others, Reference Eisen, Harrison and Raymond2001; Harrison and Post, Reference Harrison and Post2003). Second, ice flow exhibits rapid acceleration, reaching 10–1000 times the velocity during the quiescent phase (Jiskoot, Reference Jiskoot, Singh, Singh and Umesh2011). Dowdeswell and Hamilton (Reference Dowdeswell and Hamilton1991) found that the duration of the active phase, ice velocities and surge triggering mechanisms in Svalbard are different than in other regions. Nevertheless, the characteristics of the ice movement, crevasse development and glacier terminus variation are still the basis for judging whether or not a glacier is in a surge state. The main cause for concern related to glacier surges is risk to surrounding infrastructure, dammed lakes and flooding caused by the release of water from glacier-dammed lakes (Hewitt, Reference Hewitt1982; Huggel and others, Reference Huggel2005; Hausler and others, Reference Hausler2011).
Sund and others (Reference Sund, Eiken, Hagen and Andreas2009) reported that surge development occurs in three stages. Stage 1 is characterized by lowering of the ice surface in part of the glacier's ‘reservoir’ area (accumulation basin) in conjunction with increased ice velocity. Stage 2 is characterized by greater mass displacement to the lower levels of the glacier, along with continued surface lowering in the accumulation basin. Accordingly, the surface ice levels decrease upstream, while ice accumulates downstream. Transverse crevasses may be limited during the early part of stage 3 in which ice movement rates increase throughout the glacier, but later become widespread, and large crevasses can often be observed in conjunction with terminus advance. Based on these three stages, surge glaciers can be summarized into three categories. First, a typical surge-type glacier, with all three stages, is characterized by a rapid advance of the terminus during an active phase and stagnation or retreat of the terminus by down-wasting during a quiescent phase (Meier and Post, Reference Meier and Post1969; Raymond, Reference Raymond1987). However, not all glacier surges exhibit all of stage 2 and 3. Partial surges (Sund and others, Reference Sund, Eiken, Hagen and Andreas2009) may not develop beyond stage 2, for example the partial surges of Knoppbreen, KjØlhØbreen and Firmbreen in Svalbard (Sund and others, Reference Sund, Eiken, Hagen and Andreas2009). Finally, an internal surge can occur as in stage 3, with no terminus advance detected. In an internal surge the glacier surge terminates within another tributary of the glacier or its main trunk (e.g. the glaciers in the Panmah region: Maedan into Chiring is a tributary into a tributary, Chiring into Panmah is a tributary into a main trunk; Paul (Reference Paul2015). This type of glacier surge is mainly found in compound valley glaciers. In addition to the above categories of surge glacier, there is another type of glacier surge, mini-surges. A mini-surge can be defined as exhibiting daily movement. For example, the Variegated Glacier in Alaska is a mini-surge type glacier (Harrison and others, Reference Harrison, Raymond and MacKeith1986; Kamb and Engelhardt, Reference Kamb and Engelhardt1987).
Due to the remote locations and wide distribution of glaciers, monitoring is difficult, and there is little in situ monitoring of glacier surges. However, observations and analysis based on remote sensing are well suited to investigating changes in glacier area, looped or folded medial moraines, and glacier surface velocities. These are the key indicators of a glacier surge (Copland and others, Reference Copland2011). A review of the glacier surge inventory in the published literature, based on remote sensing data before 1991 for the Pamir Plateau, Tajikistan, has revealed 215 glaciers with signs of dynamic instability. Of these 51 are surge-type glaciers (Kotlyakov and others, Reference Kotlyakov, Osipova and Tsvetkov2008). However, glacier surges in the Pamir within China were not included in this inventory.
The aim of the present study is to identify and assess the occurrence of a glacier surge on the northern side of Kongur Tagh, a peak in the Chinese Pamir. We monitored the glacier's physical characteristics based on a series of Landsat 8 OLI L1T images as well as ZY-1-02C and Gaofen-1 images. Velocity fields and velocity profiles were derived using the COSI-Corr software (http://www.tectonics.caltech.edu/slip_history/spot_coseis/), and surge development was analyzed based on velocity profiles linked with the development of surface crevasses, changes in glacier surge tongues and folds in medial moraines.
2. STUDY REGION
The Pamir Plateau is located in Central Asia (38°N – 41°N; 73°E – 76°E) and includes parts of Kyrgyzstan, Tajikistan, Afghanistan and China (Fig. 1). Approximately 10 234 glaciers with a total area of 10 233.6 km2 have been recorded on the Pamir Plateau in the Randolph glacier inventory (RGI 5.0; http://www.glims.org/RGI/rgi50_dl.html). The part of the Pamir Plateau in Chinese territory is known as the Eastern Pamir Plateau (Fig. 1). The average elevation of the Eastern Pamir Plateau is >3000 m a.s.l. Muztagh Ata (7509 m a.s.l.) and Kongur Tagh (7649 m a.s.l.) are the two main summits in the region. The Taxkorgan meteorological station (37°46′N, 75°14′E; 3091 m a.s.l.; ~75 km south of Muztagh Ata) recorded a mean annual temperature of 3.5°C and mean annual precipitation of <80 mm (with a maximum of 140 mm) from 1960 to 2011.

Fig. 1. Glaciation on the Pamir Plateau and location of the Karayaylak Glacier on Kongur Tagh.
Several studies have shown that glaciers on the Pamir Plateau have experienced shrinkage since 1962 (Khromova and others, Reference Khromova, Osipova, Tsvetkov, Dyurgerov and Barry2006; Shangguan and others, Reference Shangguan2006; Haritashya and others, Reference Haritashya, Bishop, Shroder, Bush and Bulley2009; Zhang and others, Reference Zhang2016b). However, mass balance on the Pamir Plateau appears to change asynchronously with glacier recession. Shuttle Radar Topography Mission (SRTM) C-band data and SPOT 5 DEMs reveal a positive mass balance in western Pamir from 2000 to 2011 (Gardelle and others, Reference Gardelle, Berthier, Arnaud and Kääb2013), and a positive mass balance was observed for the Muztagh Ata Glacier from 1999 to 2014 (Yao and others, Reference Yao2012; Zhang and others, Reference Zhang2016a). A slight decrease in the surface mass balance of (0.13 ± 0.22) m a−1, equivalent to (2.1 ± 4.1) Gt a−1, was observed in the Gissar (Hissar) Alay ranges of the Pamir Plateau between October 2003 and October 2009 (Gardner and others, Reference Gardner2013). Although glacier surges are known to occur in the Karakoram and Pamir in Tajikistan, they have not been recorded in the mountains to the east, on the border with China.
The Karayaylak Glacier (GLIMS ID: G075254E38623N), the largest glacier on the northern side of Kongur Tagh, on the Eastern Pamir Plateau, covers 115.2 km2, with a total debris cover of 25.6 km2 (where summer pasture is located) and a total length of 20 km, as mapped by the second Chinese Glacier Inventory (Guo and others, Reference Guo2015). The glacier consists of two branches: Branch E (main tributary) with two sub-branches (E1 and E2) and Branch W with two sub-branches (W1 and W2) (Fig. 1b). The altitude of Karayaylak Glacier is 2800–7649 m a.s.l. Observations of Karayaylak Glacier using Advanced Spaceborne Thermal Emission and Reflection Radiometer (ASTER), SRTM and Topographic DEM showed a loss of (0.32 ± 0.19) m w.e. a−1 between 1971–76 and 1999 followed by a gain of (0.37 ± 0.25) m w.e. a−1 between 1999 and 2013/14 during a period of regional climatic warming (Zhang and others, Reference Zhang2016a). The velocity was 0.2–0.5 m d−1 in Branch W of Karayaylak Glacier in summer, 2007 and 2008, faster than in Branch E (<0.3 m d−1) (Jiang and others, Reference Jiang2014). A surge of the Karayaylak Glacier was reported on 15 May 2015. Chinese news media published a description of the event (http://www.chinanews.com/sh/2015/05-15/7279700.shtml). The surge was first reported by a local shepherd from a village below the base of the glacier on 14 May 2015. He informed the local media that his summer pasture had been buried as a result of glacier expansion and lateral ice flow. Although no glacier surge had been previously recorded in the region, older residents remembered that a glacier advance of the Karayaylak Glacier, which led to a GLOF event, had occurred, ~100 a ago.
3. DATA SOURCES AND METHODS
Data sources
In our study, the data sources for glacier monitoring include Landsat 8 OLI L1T multispectral (30 m) and panchromatic (15 m) images, Chinese Gaofen-1 multispectral (8 m) and panchromatic (2 m) images, and ZY-1-02C multispectral (10 or 8 m) and panchromatic (5 or 2 m) images (Table 1). Landsat 8 was launched on 11 February 2013, with two instruments in its payload: the Operational Land Imager (OLI) and the Thermal InfraRed Sensor. The OLI sensor can capture nine spectral bands. We used eight series of Landsat 8 OLI images with either no or low cloud cover. The level 1 images were radiometrically corrected and co-registered to a cartographic projection with corrections for terrain displacement resulting in a standard orthorectified digital image, by the US Geological Survey, Earth Resources Observation and Science EROS Center.
Table 1. Data sources. Landsat OLI images were obtained from the US Geological Survey

Gaofen-1 images were obtained from the Gansu Gaofen satellite center. ZY1-02C images were obtained from China Centre for Resources Satellite Data and Application (http://www.cresda.com).
Gaofen-1 was launched on 26 April 2013, and ZY-1-02C was launched on 22 December 2011. Gaofen-1 can capture one panchromatic band (0.45–0.90 µm) and four multispectral bands (0.45–0.52, 0.52–0.59, 0.63–0.69 and 0.77–0.89 µm). ZY-1-02C can capture one panchromatic band (0.51–0.85 µm) and three multispectral bands (0.52–0.59, 0.63–0.69 and 0.77–0.89 µm). Both the Gaofen-1 images and the ZY-1-02C images use rational polynomial coefficients that provide horizontal accuracy of better than 30 m without requiring ground control points. One limitation of the Gaofen-1 images is that they only cover the glacier's tongue.
Methods
The second Chinese Glacier Inventory included the initial area of the Karayaylak Glacier (Guo and others, Reference Guo2015; Liu and others, Reference Liu2015). We applied a manual interpretation method to delineate parts of the glacier, based on false-color composite images (bands 5, 4 and 3) for Landsat 8. For the Gaofen-1 images, we adopted the panchromatic and multispectral remote-sensing image-fusion technique for spatial enhancement processing (Wang and Jiang, Reference Wang and Jiang2015). After the surge, fresh traces of ice were clearly visible that were previously covered by debris. Consequently, the glacier's area could easily be identified.
We estimated the uncertainty of the glacier area using a buffer of half a pixel for images of regions with bare ice and favorable snow conditions (Bolch and others, Reference Bolch, Menounos and Wheate2010), but we used a buffer of two pixels for debris-covered sections (Shangguan and others, Reference Shangguan2015). This yielded an area uncertainty of 1.8% for the Landsat 8 images and 0.2% for the Gaofen-1 and ZY-1-02C images. After accounting for standard error propagation (Joerg and others, Reference Joerg, Morsdorf and Zemp2012), the final uncertainty related to changes in area was 1.8% between Landsat 8 and Gaofen-1/ZY-1-02C and 0.3% between Gaofen-1 and ZY-1-02C.
To derive an accurate and comprehensive velocity field for the glacier, we applied a cross-correlation algorithm in the frequency domain using the EXELIS VIS ENVI add-on for the COSI-Corr software (Leprince and others, Reference Leprince, Barbot, Ayoub and Avouac2007). The respective window size was determined based on the displacement of surface features (using a reference displacement of ~380 m) using manual measurements from ZY-1-02C images from 28 April 2015 and Gaofen-1 images from 16 May 2015 (Fig. 2). According to the magnitude of the displacement of the surface features and the spatial resolution of the Landsat 8 images (15 m for the panchromatic band), we determined the initial and final window size to be 64 pixels and 16 pixels respectively. The step size was 8 pixels. We used a signal-to-noise ratio of 0.90 as a threshold to remove obvious outliers. All displacement points were input into ARCMAP Software after some abnormal points (such as in cloud covered regions) were removed. Then, triangulated irregular network and GRID of velocities were generated (Fig. 3). Finally, we extracted the velocity profiles (Fig. 4).

Fig. 2. Changes in the area of the Karayaylak Glacier during the surge that occurred in the western tributary (Branch W). (a) Background ZY-1-02C image from 28 April 2015. ‘Photo’ indicates the area shown in Figure 5. (b) Background Gaofen-1 image from 16 May 2015. We used the indicated surface features to measure displacement of the ice based on manual measurements.
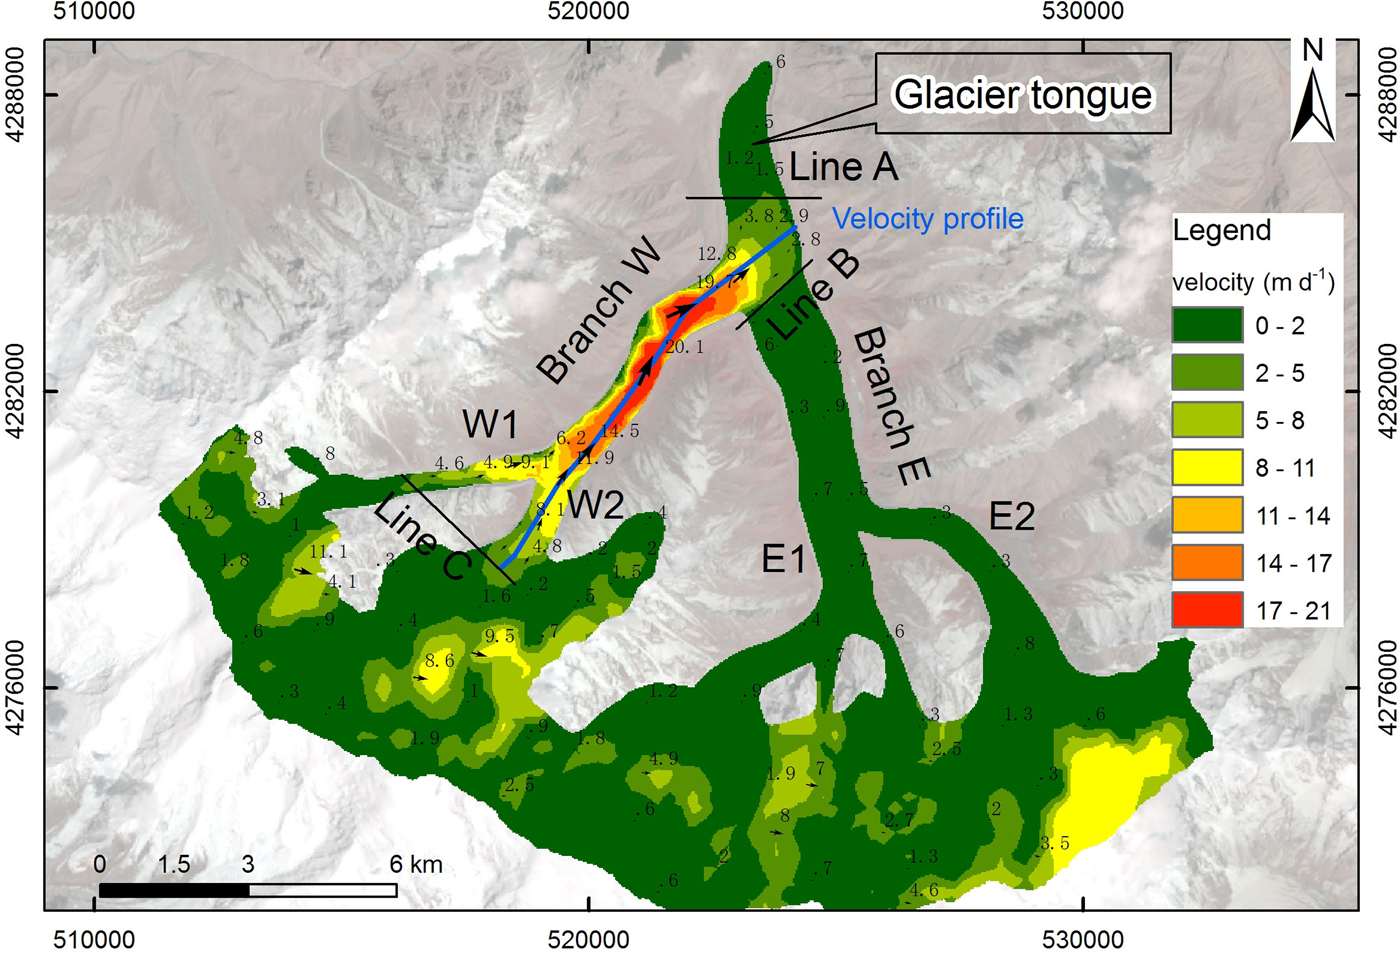
Fig. 3. The surface velocity field of the Karayaylak Glacier determined using the COSI-Corr software based on data from 8 to 15 May 2015. Velocity arrows indicate flow direction and surface velocity. (Background: Landsat 8 OLI image, Path 149, Row 33, acquired on 8 May 2015.).

Fig. 4. Surface velocity profiles along a transect from Line A to Line C (Fig. 3) during different output periods, created using the COSI-Corr software.

Fig. 5. Photographs of the Karayaylak Glacier taken on 19–22 May 2015, showing (a) what remained of the surge event close to sheepfolds and shelters, and heavily broken debris-ice (or debris covered ice). (b) Branch W is heavily crevassed on its two sides but not in the middle part. The broken ice over-rid orographic high lateral moraine.
The displacement uncertainty using optical imagery for kinematic analysis of glaciers depends on several factors, including the ground resolution of the images, the period between surveys and the precision of image registration (Leprince and others, Reference Leprince, Berthier, Ayoub, Delacourt and Avouac2008). Multi-temporal images of Landsat 8 OLI images were successfully co-registered by the US Geological Survey to an accuracy of 0.4 pixels; they used the same registration method and the images were suitable as input, as they covered a larger area of the glacier than ASTER images (Nobakht and others, Reference Nobakht, Motagh, Wetzel, Roessner and Kaufmann2014; Shangguan and others, Reference Shangguan2015). Hence, we could calculate the uncertainty related to co-registration from Landsat panchromatic images, and the uncertainty was ~6.0 m. However, uncertainty related to the image resolution was usually less than half a pixel at the image resolution (Bolch and others, Reference Bolch, Menounos and Wheate2010). Consequently, displacement uncertainty (μ) can be calculated by
 $$\mu = \sqrt {\theta _1^2 + \theta _2^2}, $$
where θ 1 is uncertainty related to co-registration (6 m), and θ 2 is uncertainty related to manual delineation (7.5 m). μ was 9.6 m based on this calculation. Consequently, the velocity standard error (SE) was calculated using
 $${\rm SE}\, = \,\mu /{\rm duration}.$$
4. RESULTS
Several factors, such as looped and folded medial moraines, surface foliation, advance of the terminus, increasing thickening and steepness of the glacier tongue, increasing surface velocities and the development of strand lines can be used to identify glacier surges (Copland and others, Reference Copland2011). In the present study, we analyzed surging of the Karayaylak Glacier and the characteristics of the surges based on changes in the glacier's extent, crevasses and velocity calculated using satellite images. In addition, we investigated the depth change of the ice, which could not be easily estimated because of an insufficient number of crevasses with visible bottoms.
Measured surface velocities
Due to ice fragmentation, it was difficult to calculate the in situ ice velocity. To investigate the dynamic behavior of Branch W (W1) of the Karayaylak Glacier, where the surge occurred, we measured ice surface velocity using Landsat images. We found rapid ice movement between line C and line A (Fig. 3) in this tributary, with a maximum velocity of (20.2 ± 0.9) m d−1 (mean ± SE) from 8 to 15 May 2015. In contrast, at line A, just below the surge tongue, the surface velocity was <(2.0 ± 0.9) m d−1, and at line B, on the upper side of the surge in Branch E, the velocity was <(1.0 ± 0.9) m d−1. Overall, the velocity ranged from (6.0 ± 0.9) to (12.0 ± 0.9) m d−1 in sections of the upper firn basin, with the surge arriving at line A on 15 May 2015.
We also investigated changes in velocity along a profile in Branch W (W2) of the Karayaylak Glacier from 3 October 2014 to 11 July 2015 (Fig. 4). The mean velocity was <1 m d−1 between 3 October 2014 and 13 April 2015, and the velocity increased significantly after 13 April. The feature tracking results indicated that velocities within Branch W(W2) were high from 13 April to 15 May 2015. We also noted that the velocity profile from 22 April to 8 May 2015 changed greatly, with the highest velocity measured at (8.3 ± 0.60) m d−1. The velocities from 22 April to 8 May 2015 were less than for 13–22 April. Velocities from 16 June 2015 to 11 July 2015 remained slightly higher than from 3 October 2014 to 13 April 2015, and were also higher than in the Karayaylak Glacier's Branch E. However, the velocity curve from 16 June 2015 to 11 July 2015 was smooth.
Analysis of the velocity curves along a longitudinal profile through the glacier's Branch W showed that Branch W was in a quiescent phase between 3 October 2014 and 13 April 2015, and was in an active phase between 13 April 2015 and 15 June 2015. After 15 June 2015, the glacier appeared to be shifting back into a quiescent phase.
Changes in glacier area and crevasses
We identified changes in glacier area and crevasses by visual interpretation of the images. The ZY-1-02C images showed that the region from line C to lines B and A (Branch W with parts of W1 and W2; Fig. 3), ~10 km long and ~10 km2 in area, experienced increased surface velocities during the surge period (Fig. 3). Our field investigations showed that the ice had been pushed outwards by ~10–20 m and overrode the lateral moraine in Branch W, resulting in damage to grassland, sheepfolds and summer shelters (Figs 2b, 5). An outward flow that extended a maximum of 100 m covered an additional 0.1 km2 of summer pasture on the northwestern side of Branch W. The surging tongue pushed forward until it flowed over the top of Branch E at the junction of the two Branches (Fig. 2b). However, little of the ice was forced outside the lateral moraine. On average, the lateral moraine ridge was from 10 to 100 m higher than the contemporary glacier surface, indicating that the ice refilled (backfilled) and covered the lateral moraine's ridge. Hence, the overriding ice was >100 m thick in some places.
The surface of Branch W (with W1 and W2) was not heavily crevassed and was entirely covered by debris on 8 January 2015 (Fig. 6). However, the glacier surface subsequently experienced dramatic changes, as clearly demonstrated by the satellite images and photographs (Figs 2, 5). The maximum length of the region that contained surface crevasses was ~7 km, and the region covered an area of 6.8 km2 (Fig. 6). Crevasses developed in the surface of Branch W, resulting in fragmentation, and some transverse crevasses appeared in the Gaofen-1 image from 16 May 2015 (Figs 2b, 5b). The development of intense chaotic crevasses suggests accelerated flow conditions (Haebeli and others, Reference Haebeli2002).
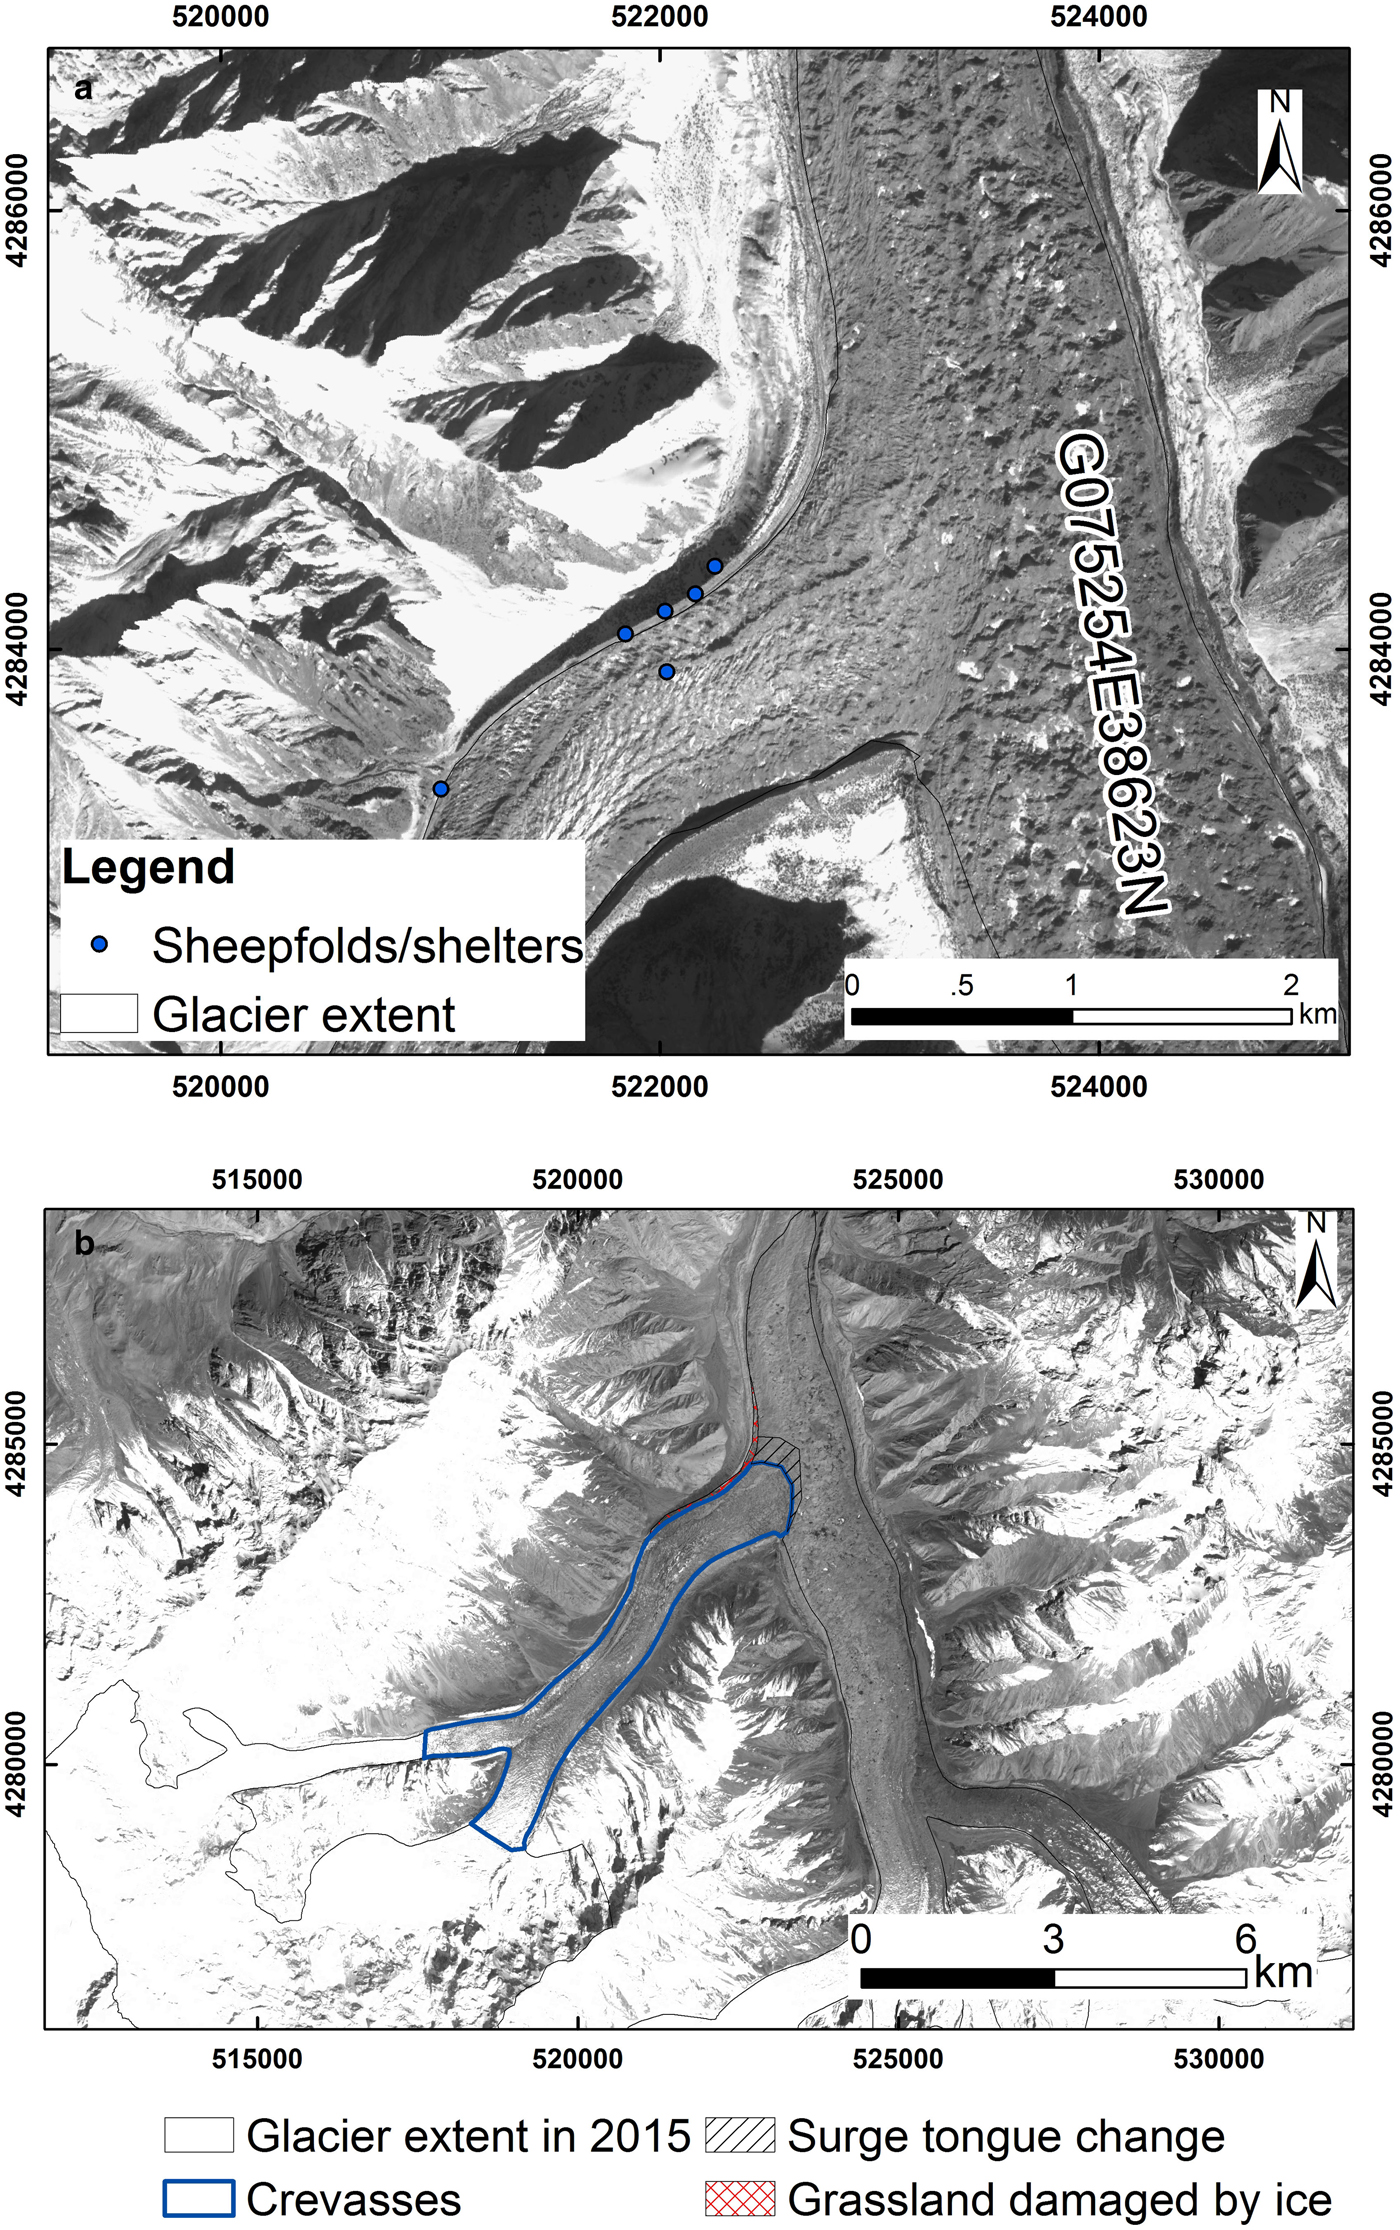
Fig. 6. (a) No surface crevasse development derived from ZY-1-02C on 8 January 2015. (b) Surface crevasse development derived from ZY-1-02C on 28 April 2015.
Identification of surges in the Karayaylak Glacier
Based on the velocities and development of crevasses in the Karayaylak Glacier, our results show that the initial surge of Branch W (with part of W1 and W2) was between 3 October 2014 and 13 April 2015 (Fig. 1). Although we could not accurately determine the start of this glacier surge event, the changes in velocity suggest the glacier was in an active phase from 13 April to 16 June 2015. However, the ice velocity within Branch E remained low. The terminus of the Karayaylak Glacier did not advance. Hence, we categorized this as an internal surge event (Hodgkins and others, Reference Hodgkins, Fox and Nuttall2007; Quincey and others, Reference Quincey, Glasser, Cook and Luckman2015).
5. DISCUSSION
Raymond (Reference Raymond1987) indicated that the seasonal timing of initiation and termination phases of glacier surges can provide important clues about the involved mechanisms, which are also affected by long-term climate trends, annual weather variations and hydrology (Harrison and Post, Reference Harrison and Post2003). We have identified the initiation and termination of surge phases of the Karayaylak Glacier from the velocity values derived from Landsat 8 OLI images. Due to limitations of the temporal resolution of Landsat 8 OLI, Gaofen-1 and ZY-1-02C images, the velocity values were recorded quasi-continuously before, during and after the active phase (Kamb and others, Reference Kamb1985). Moreover, the accuracy of identification of the active phase depends on the acquired image time series. Although we lacked observations in-situ on how the surge developed, we nonetheless clearly discerned the active phase (stages 1 and 2) through several velocity profiles from October 2014 to July 2015, which lasted ~2 months. It is, however, noteworthy that we did not observe any advance of the glacier terminus (stage 3), but some level of advance of the west branch into the east branch (surge tongue) was observed (Figs 2, 3). Hence, the initiation phase of the surge occurred on ~13 April 2015 and the termination phase occurred on ~16 June 2015.
Triggering mechanisms for the glacier surge remain inconclusive. Nevertheless, the thermal structure and subglacial hydraulic conditions are key factors leading to glacier surges (Robin, Reference Robin1969; Clarke and others, Reference Clarke, Collins and Thompson1984). A positive mass balance from 1999 to 2013/14 can be inferred from increasing precipitation (Kapnick and others, Reference Kapnick, Delworth, Ashfaq, Malyshev and Milly2014; Zhang and others, Reference Zhang2016a), leading to an upward shift in thermal condition (Quincey and others, Reference Quincey2011). Although this surge event occurred during the spring, it is also the peak of the winter mass balance, when meltwater from the glacier is scarce. The discharge from glacier melt before June 2015 had significantly reduced and the discharge in April and May 2015 also decreased, as reported by Gez hydrological station, compared with the same period in previous years. Muddy water flowing from the glacier terminus was observed between 19 and 22 May. After the termination phase on ~16 June (during the summer), an abundance of surface meltwater was available to re-establish efficient channelized flow (Fowler and others, Reference Fowler, Murray and Ng2001; Harrison and Post, Reference Harrison and Post2003; Murray and others, Reference Murray, Strozzi, Luckman, Jiskoot and Christakos2003; Quincey and others, Reference Quincey2011). Taking this into account, the surge was more likely to be controlled thermally, rather than hydrologically.
Active phases of several glaciers on the Pamir Plateau lasted from several months up to 10 a, and included several transitions, from restoration stages to intense surges (Kotlyakov and others, Reference Kotlyakov, Osipova and Tsvetkov2008). Moreover, more than 50% of the surge duration lasted for ~2 a (Dowdeswell and Hamilton, Reference Dowdeswell and Hamilton1991). In the Karakoram Mountains, active phases were short-lived, ranging from a few months to several decades (Hewitt, Reference Hewitt1998, Reference Hewitt2007; Copland and others, Reference Copland2011; Paul, Reference Paul2015). Albeit, glaciers at higher latitudes, for example, Svalbard and Greenland, experience relatively long active phases (from 5 to 10 a) (Dowdeswell and Hamilton, Reference Dowdeswell and Hamilton1991) or even decade-long active phases (Copland and others, Reference Copland, Sharp and Dowdeswell2003; Jiskoot and Juhlin, Reference Jiskoot and Juhlin2009).
Internal surge glaciers have commonly been found in the Pamir of Tajikistan and Karakoram. Bivachny Glacier and Medvezhiy Glacier in the Pamir have been observed three times, to internally surge with a periodicity of 10–20 a (Osipova and Tsvetkov, Reference Osipova and Tsvetkov1991; Kotlyakov and others, Reference Kotlyakov, Osipova and Tsvetkov2008). Two surge events, in 1979 and in the late 1990s, have been observed for Khurdopin Glacier in the Karakorams. Neither of these caused glacier advance (Quincey and Luckman, Reference Quincey and Luckman2014). Several glacier surges have also been reported in western China, for example, Yulinchuan Glacier in the northern Tibetan Plateau (Guo and others, Reference Guo, Liu, Wei and Bao2013) and the Shaksgam River Valley Glacier in the Karakorams (Shangguan and others, Reference Shangguan2005). In the present study, an internal glacier surge was found in the Pamirs of China. The Karayaylak Glacier's surge appears to resemble that of the Bivachny Glacier. Surge termination in the Bivachny Glacier experienced subsequent activity for a period of 4 a, and exhibited several transitions from a restoration stage to a period of intense activity in the trunk. Partial surge or internal type surge glaciers can develop into typical surge glaciers. For instance, for the Okttabr'sky Glacier in the Pamir, Tajikistan, a micro-surge (or the first stage of a surge) was reported in 1973–79. But after 1985, the second stage of a surge started and the glacier terminus shifted forward 2 km (the third stage) in August 1990 (Kotlyakov and others, Reference Kotlyakov, Osipova and Tsvetkov2008). For the Karayaylak Glacier, we have only been able to collect surge data for a period of <2 months. We do not know when the period of surge activity of the Kalayaylak Glacier will terminate or how far the surge frontier will reach. More research is required to monitor its activity until we can clearly determine that it has entered another quiescent phase.
6. CONCLUSIONS
In this study, we quantified the spatial and temporal variability in the velocity of the Karayaylak Glacier, in the Pamir Plateau, during a glacier surge. We analyzed surface crevasse development and changes in glacier area. Satellite-based remote sensing allowed us to identify this internal surge despite the remoteness of the study region. We found that the surge in the west branch of the Karayaylak Glacier occurred during an active phase from ~13 April to ~16 June 2015. This event buried grassland in the northwest lateral moraine; sheepfolds and shelters were destroyed and other infrastructure is still threatened by surge-transported ice and debris. In addition, parts of the east branch of the glacier are being compressed by ice movement from the west branch. The section of glacier in the surge zone is heavily broken, with many crevasses. Measured surface velocities during the active phase were between one and two orders of magnitude greater than those during the quiescent phase. The maximum surface motion reached (20.2 ± 0.9) m d−1. Monitoring of glacier surges by means of satellite remote sensing cannot completely resolve issues related to the mechanisms responsible for the surge (Kotlyakov and others, Reference Kotlyakov, Osipova and Tsvetkov2008). To understand these mechanisms, further research is required, such as more detailed observations of parameters including the evolution of surface elevation and internal and external mass exchanges, as well as hydrological, climatic, till and bedrock characteristics.
ACKNOWLEDGEMENTS
We thank Geoff Hart and Jo Jacka for reviewing the English in an early version of this manuscript. This study was funded by the Ministry of Science and Technology of the People's Republic of China (Grantno. 2013FY111400) and by the National Natural Science Foundation of China (Grants no. 41271082 and 41421061). It was partially funded by grants 2013BAC10B01 and 2013CBA01808 from the Ministry of Science and Technology and by the Key Research Program of the Chinese Academy of Sciences (KZZD-EW-12-1). Landsat OLI images were obtained from the US Geological Survey. Gaofen-1 images were obtained from the Gansu Gaofen satellite center. ZY1-02C images were obtained from China Centre for Resources Satellite Data and Application (http://www.cresda.com).


 Open access