


1. Introduction
Wind-blown mineral aerosol dust derived from the crustal surface is an important atmospheric component (Reference Osada, Iida, Kido, Matsunaga and IwasakaOsada and others, 2004) affecting the Earth’s radiation budget (Reference Nakajima, Tanaka, Yamano, Shiobara, Arao and NakanishiNakajima and others, 1989; Reference Andreae, Landsberg and Henderson-SellersAndreae, 1995; Reference Tegen and LacisTegen and Lacis, 1996). Mineral aerosol dust is an important indicator of changes in the atmosphere associated with changes in temperature, precipitation and atmospheric circulation. Ice-core records show that high dust concentration corresponds to cold and dry climate conditions, while low dust concentration corresponds to warm and wet conditions (Reference Liu, Yao, Thompson and DavisLiu and others, 1999). Aerosol dust information can be recorded and stored in the snow and ice of high mountains and of the polar regions. Much research has been carried out concerning dust records in ice cores, to understand climate change in ancient times (Reference Thompson and Mosley-ThompsonThompson and others, 1981a, Reference Thompson, Mosley-Thompson and Petitb, Reference Thompson1989, Reference Thompson1998). Other research has measured dust deposition in recent snow to understand recent climate and environment conditions (Reference Wake, Mayewski, Li, Han and QinWake and others, 1994; Reference Osada, Iida, Kido, Matsunaga and IwasakaOsada and others, 2004). Atmospheric transport processes (Reference Merrill, Uematsu and BleckMerrill and others, 1989; Reference Uno, Amano, Emori, Kinoshita, Matsui and SugimotoUno and others, 2001) and transformation processes of the dust particles have also been studied to characterize the geochemical role of aeolian dust events in the Asian region. These dust events have been observed frequently in spring over the Asia-Pacific region (Reference KoizumiKoizumi, 1932; Reference Arao, Itou and KojaArao and others, 2003) because of the strengthened wind speed in springtime.
The eastern Tien Shan, western China, are located in an arid and semi-arid region of central Asia, the source region of Asian dust (Fig. 1). Dust storms are an important phenomenon in this region. Aerosol dust particles deposited in the snow of high mountain glaciers contain information on the atmospheric environment at high elevation, and may be an important indicator of global climate change. It is thus important to research the characteristics of dust deposition in the eastern Tien Shan (Reference Wake, Mayewski, Li, Han and QinWake and others, 1994). Chemical analyses and meteorological correlation suggest that the dusty layers found in the snow cover of the eastern Tien Shan form by deposition of dust-storm particles. However, the processes of formation of the dust layers and characteristics of the dust particles in the snow cover of this region remain unclear. Furthermore, the amount of dust particles deposited close to the snow-forming cloud altitude may provide a useful insight into the free-tropospheric fraction of dust deposition over the central Asian region. We analyze the concentration, flux, size distribution and ionic constituents of aerosol dust in the snowpacks on the glaciers of the eastern Tien Shan. In addition, we discuss the year-to-year variability of dust deposition and its relationship with climate change.
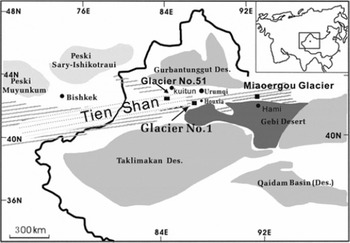
Fig. 1. Location map of three research sites in the eastern Tien Shan, central Asia: from west to east, glacier No. 51 in the Kuitun area, glacier No. 1 at the headwaters of the Ürümqi river, and Miaoergou glacier in the Hami area.
2. Snow Sampling, Laboratory Analysis and Dust Measurements
Figure 1 shows a location map of the eastern Tien Shan and the three sampling sites: glacier No. 51 (3900 m a.s.l.) in Kuitun Haxilegen (abbreviated to glacier No. 51 hereafter); glacier No. 1 (4130 m a.s.l.) at the headwaters of the Ürümqi river (abbreviated to glacier No. 1); and Miaoergou glacier (4510 m a.s.l.) in Hami. The main study site is glacier No. 1. The sampling sites at glacier No. 51 and Miaoergou glacier are used to show regional continuity of the dust layers in the snow cover. The shaded areas in Figure 1 represent the Gobi desert and other deserts in central Asia. In July–September 2004 and 2005, a total of eight snow pits (depths 0.53–2.76 m) were excavated, of which four were on glacier No. 1, two on glacier No. 51 and two on Miaoergou glacier. The snow deposition environment around the sampling site of the accumulation zone on glacier No. 1 is suitable for continuous snow accumulation because there is a nearly flat area of about 100 × 100 m2 (Reference Hou, Qin, Ren and ShengHou and others, 1999). Similarly, the topography in the region of the glacier No. 51 and Miaoergou glacier sites is nearly flat, leading to uniform snow deposition.
We worked on the snow pits after recording snow stratigraphy, and clean, fresh vertical sections were exposed for dust and chemical snow sampling. We collected snow samples, typically 100 g, in 10 cm increments using a pre-cleaned stainless-steel shovel and polyethylene gloves. The sampling instruments were cleaned between intervals. Samples were stored in Whirl-Pak® bags and kept frozen until further analysis. Snow density, snow temperature and snow grain size were measured in the same horizontal layers. All surface snow samples were shipped frozen from the sampling sites and stored at −18°C. They were then melted and aliquots were collected for micro-particle and chemical analysis.
Micro-particle concentrations and size distributions were measured on an Accusizer 780A counter, which uses the single-particle optical sensing (SPOS) method, equipped with a 120 orifice (Reference Zhu, Li and YouZhu and others, 2006). Measurements were performed under class 100 conditions on sample aliquots diluted with a pre-filtered NaCl solution to give a 2% vol. electrolyte concentration. The data were acquired for a size range of 0.57–400 μm equivalent spherical diameter, d. Routine analysis of filtered deionized water blanks showed background counts to be on average ten times lower than in samples. Background counts were subtracted from the sample data. All samples were analyzed in random order and in triplicate. Results were then averaged for individual samples, yielding an estimated error of 10% or less on particle concentrations.
The mass and volume size distributions of micro-particles were calculated from the raw count data by assuming spherical particles of uniform density ρ = 2.6 g cm−3, which is close to that of average crustal material. Mass was derived by integrating the mass size distribution over the measured diameter range and normalizing the result to the sample volume. We also computed the slope, β, of the log-linear Junge distribution,

fitted to particles with d less than 25 μm (Reference JungeJunge, 1963; Reference Wake, Mayewski, Li, Han and QinWake and others, 1994; Reference SteffensenSteffensen, 1997). The number of particles larger than 26 μm is very low, and many of the snow samples contain only a few such particles. Calculation of their contribution shows that as there are so few large particles compared to the fine particles, they make a negligibly small contribution to the total mass deposition.
In addition to micro-particles, the concentrations of major ions (Ca2+, Cl−, Mg2+ and Na+) were measured at trace levels on a Dionex-600 ion chromatograph using the procedure described by Reference Buck, Mayewski, Spencer, Whitlow, Twickler and BarrettBuck and others (1992). The mean blank value for the Whirl-Pak® bags for dust particle number is 444 mL−1 in this work, and the blank values for major ions are shown in Table 1. These blank values were subtracted from the sample data.
Table 1. The blank value (μg kg−1) for major ions of the Whirl-Pak® bags in the laboratory analysis. SD is standard deviation
3. Results and Discussion
3.1. Horizontal distribution of snow height, dust concentration and flux
Previous research shows that if the deposition of snowfall is continuously ideal, i.e. without redistribution of snow, atmospheric signals such as mineral dust deposition should be preserved in sequence in the snow layers (Reference Osada, Iida, Kido, Matsunaga and IwasakaOsada and others, 2004). In this study, the environment is suitable for snow deposition, as the terrain is flat at all three sampling sites and annual wind speed around the sampling sites is small. Observation shows that from west to east, the snow depth of the accumulation zone at the three sampling sites is respectively about 2500, 2000 and 1000 mm (Reference LiLi and others, 2006b). The physical reference level for measuring the accumulation is the ice layer below the snowpack. The Tien Shan region is mainly affected by westerly winds in spring and summer, bringing plentiful precipitation from the ocean to the west and also moisture from lakes in central Asia, to the west of our research sites. Precipitation gradually decreases from the Kuitun region to the Ürümqi river source and the eastern Hami glaciers.
Figure 2 shows three vertical profiles of dust concentration and the depth–age relationship of the snow pits in summer 2005 in the eastern Tien Shan. Most water-insoluble dust profiles resemble each other at the sampling sites, as indicated by the dotted lines representing significant dust peaks. Figure 3 shows the dust profiles of four snow pits at glacier No. 1. Dust peaks linked by the stippled lines show the dusty layers observed in the snow profiles. Previous research at glacier No. 1 has indicated that one dust layer formed in the snow pit each year at this site (Reference LiLi and others, 2006b). In addition, we find four dust layers in the snow pits at these sampling points, indicating that the snow pits represent snow deposition over the past 4 years. We observed the snow accumulation each year by employing snow layer-tracing methods during 2002–05 at the three research sites (Reference Li, Wang and ZhuLi and others, 2006a,Reference Lib), and obtained average mean snow accumulation rates of 600, 500 and 250 mm w.e. respectively (from west to east). Thus, we obtained the depth–age relationship of the snow pits at the three sites (Fig. 2). Strong lateral correlation of the dust peaks suggests regional uniformity of dust deposition events and the suitability of snow analysis in the eastern Tien Shan as an archive of the atmospheric environment.
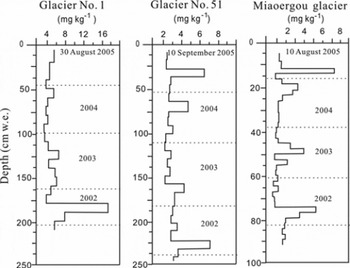
Fig. 2. Three representative vertical profiles of dust concentration in summer 2005 at three sites of the eastern Tien Shan, and the depth–age relationship of the snow pits. Precise dates are sampling dates; other dates indicate the snow age.
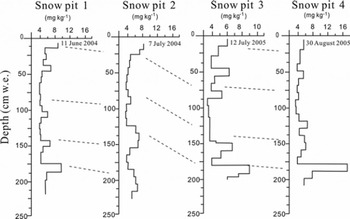
Fig. 3. Profiles of snow pits on glacier No. 1 during 2004 and 2005. Dates are sampling dates.
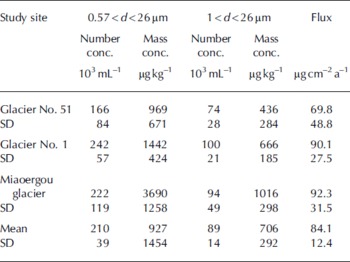
Table 2 shows a comparison of dust concentration and calculated flux for the eastern Tien Shan research sites. The mean concentration of micro-particles with 0.57 < d<26 μm in the snowpack of the three sites is respectively 166 × 103, 242 × 103 and 222 × 103 mL−1, with mass concentrations of 969, 1442 and 3690 μg kg−1 respectively. These are all high values, with an increasing trend from west to east. Particles of 0.57–1.0 mm diameter are most abundant and we pay them particular attention. For particles with d >1.0 μm, the mean concentration across the three sites indicates the same increasing trend from west to east, which may reflect the lateral distribution of dust deposition in this region. However, the number concentration and mass concentration trends across the three sites are different (Table 2). This region is the source region for Asia dust-storm activity; the coarse dust particles significantly influence the mass concentration of dust particles in the snow of high mountain glaciers. Possibly, the larger the mass concentration, the stronger the influence of dust storms on the snow dust particle deposition in the eastern Tien Shan. We have also calculated the dust deposition flux in the snow. Dust flux calculations can reflect the total amount of modern eolian dust deposition to the sites. Based on the net annual accumulation rate of 600, 500 and 250 mm w.e. respectively from west to east, we derived an average value for the modern eolian dust flux to the three sites of 69.8, 90.1 and 92.3 μg cm−2 a−1 for particles with 0.57 < d<26 μm. Despite their similarity, these values show an increasing trend from west to east. However, we should note some uncertainties in the deposition flux estimates. Firstly, the deposition estimates of dust flux are based on estimates of net accumulation rates and estimates of the integrated particle mass. Secondly, in the laboratory the volume estimates were made with an optical particle sizer whose data are not given directly as volumes but as equivalent spherical diameters. As many of the particles are not spherical, there may be significant uncertainties in the particle volumes, and these uncertainties will vary as a function of particle shape and size. Moreover, we assume that all particles extracted from the snow are mineral dust particles, but it is possible that small quantities of other types of particles (e.g. fly ash and other anthropogenic materials, fragments of biological materials, cosmic particles and black carbon) may also have been incorporated in the snow. Lastly, the different mass concentration of dust particles in different snow pits can lead to uncertainties in the flux calculations. In Figure 3, taking as an example the large peak just above 200 cm in the dust profiles of glacier No. 1, the largest difference in mass concentrations appears to be approximately three-fold, reflecting the uncertainties in the flux calculations. For all of these reasons, there are likely to be uncertainties in the deposition estimates. However, we think the overall conclusions of the study are credible, because the dust particles dominate other types of particles in the snow pits. Similar methods for estimating particle mass and flux were used at the three sites of this work and in other research.
Table 2. Comparison of dust concentration and flux at research sites. SD is standard deviation
The lateral variation of dust concentration and flux in the eastern Tien Shan can be attributed to three causes:
-
1. The influence of the dust source area may vary between the research sites. Miaoergou glacier, which has the highest mass concentrations, is nearest to the Gobi desert, and is thus likely more strongly affected by local/ regional dust storms. Glacier No. 1 and glacier No. 51 are located more centrally within the mountains, where the influence of dust storms may be weaker.
-
2. The influence of precipitation differs between the three sites. Because of the different precipitation amounts at each site, rain and snow washes the insoluble atmospheric particles to different degrees. Thus dust concentration is lowest in the west (glacier No. 51) and highest in the east (Miaoergou glacier) where the precipitation reduces. However, as the processes of dust-particle deposition in the snow cover of this region remain unclear, further research is needed.
-
3. The mountain environment around the glaciers (e.g. wind, topography) is important and may affect the concentration of dust deposition to the snow on the glaciers.
To determine how representative the dust deposition on the eastern Tien Shan is of regional to hemispheric atmospheric fallout, we compared the mean dust concentration and flux with similar measurements from remote polar and non-polar sites (Table 3). The mean concentration of micro-particles with 0.57 < d<26 μm in eastern Tien Shan snow cover is 210 × 103 mL−1 with an average mass concentration of 1837 μg kg−1. For particles with d > 1 μm, the mean concentration is 93 × 103 mL−1, which is comparable to that measured on Mustagh Ata and Chongce ice caps, China (Table 3). Research on Mustagh Ata and Chongce ice caps shows greater numbers and mass concentrations than at our sites. They are located near the Taklimakan desert of central Asia and have dust deposition rates in excess of 200 μg cm−2 (Reference Wake, Mayewski, Li, Han and QinWake and others, 1994), which accounts for the coarser mode of dust measured in snow at these sites. However, Table 3 shows that the depositional flux of dust differs from that observed at various remote sites throughout the Northern Hemisphere. Because of long-range transport, the atmospheric particle deposition is very small at some remote sites (e.g. the Canadian Arctic, where dust concentration in snow is about 135–243 μg kg−1 and the flux is about 4.2–4.8 μg cm−2 a−1 (Reference Fisher, Koerner and MahaneyFisher and others, 1981; Reference Zdanowicz, Zielinski and WakeZdanowicz and others, 1998)). The Tien Shan sites in our study are close to the dust sources in central Asia, so the concentration and flux of atmospheric dust deposition are high. This suggests that the dust deposition on the snowpack in the eastern Tien Shan is representative of the background crustal aerosol close to a source region.
Table 3. Atmospheric dust concentration and flux in snow and ice at various Northern Hemisphere sites

3.3. Characteristics of dust in snow: ionic constituents and size distribution
Figure 4 shows the relationship between ionic concentrations, electrical conductivity and dust concentration obtained in summer 2005 at the snow pit on glacier No. 1. The dusty layers correspond very well to concentrations of Ca2+, Cl−, Mg2+ and Na+ and conductivity in the profiles. There are good correlations between ions and dust in the snow cover of the eastern Tien Shan, and research at Miaoergou glacier and glacier No. 51 yielded similar results (Table 4). In Table 4, dust is mainly represented by the mass concentration of dust micro-particles. Moreover, we have found that generally the mean diameter of particles can represent the dust mass concentration, as they are identical in profile: the larger the mean diameter, the larger the dust mass concentration. Only the correlation coefficient of ions and dust mass concentration are shown in Table 4. Previous research at glacier No. 1 has shown that dust peak concentration corresponds very well to peak concentrations of Cl−, Mg2+, Ca2+ and Na+ during the sample period (Reference LiLi and others, 2006b), indicating that these ions may have the same source as the dust particles. Vertical profiles of dust concentration are similar to variations in Ca2+ concentration. Dust peaks found in snow of the eastern Tien Shan are inferred to have originated mainly in arid regions of central Asia because high-alkaline Ca2+ is a tracer of mineral dusts from desert and loess areas in the Asian continent (Reference IchikuniIchikuni, 1978; Reference Suzuki and TsunogaiSuzuki and Tsunogai, 1988). Most Na+ in the snow originates from a source of salt-rich minerals, most likely the salt lakes in central Asia (Xinjiang), based on significant correlation with Cl− and Mg2+ concentrations (Reference LiLi and others, 2006b). The Cl−/Na+ ratios in the snow samples of our research sites range from 0.32 to 4.09, with a mean value of 2.05, much larger than the mean value of 1.165 for sea salt. This increase may be caused by the rich-salt minerals of Asian dust and salt lakes, because there are many such salt sources in Xinjiang region. Research on Tateyama mountain, central Japan, indicated that Na+ concentrations in the snow did not correlate well with dust, because the Na+ originates from the Japan Sea (Reference Osada, Iida, Kido, Matsunaga and IwasakaOsada and others, 2004). Our results, taken together with measurements of ion deposition in the snow of the eastern Tien Shan, suggest that the dust particles are from the central Asian dust sources around this region (e.g. the Taklimakan and Gobi deserts).
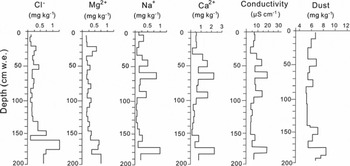
Fig. 4. Vertical profiles of major ionic concentrations, conductivity and dust concentration in snow pit No.1 on glacier No.1 in summer 2005.
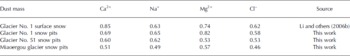
Table 4. Correlation coefficient of ions and dust in the snow of the eastern Tien Shan
Figures 5 and 6 show the size distributions of dust particles in the snowpack. Figure 5 is the number size distribution for the three research stations in the eastern Tien Shan. Finer micro-particles were found in glacier No. 1. Figure 6 is a typical example of the volume size distribution in the snow of glacier No. 1, in which the peak value of the curve is the modal size (μm) of the dust particles. Figure 7 is a comparison of size distribution at the three sites. The volume median diameters of the dust particles in the eastern Tien Shan range from 3 to 22 μm. Moreover, the distribution of volume size is a single mode. The modal size of the volume size distribution at Miaoergou glacier is 13 μm, that at glacier No. 1 is 11.5 μm and that at glacier No. 51 is 11.0 μm. The atmospheric environment around the three sites shows regional differences because of the long distance between them (e.g. Miaoergou in Hami is located in a more arid region than the other two sites). Thus the dust sources of central Asia (e.g. the Taklimakan and Gobi deserts) have different influences on the three sampling sites. We infer that Miaoergou glacier is influenced more significantly by dust transport than glacier No. 1 and glacier No. 51.
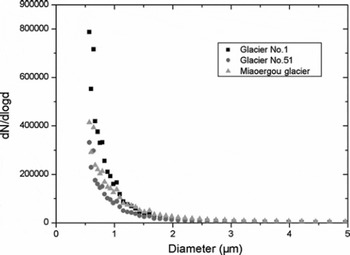
Fig. 5. A comparison of number size distribution at the three research sites.
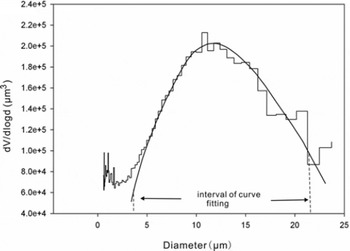
Fig. 6. A typical example of the volume size distribution in the snow of glacier No. 1. The fold curve indicates the volume size distribution. The histogram shows the normal distribution, which is a stacked average of 21 snow-pit samples. The size interval 3–22 μm over which curve fitting was applied is indicated.
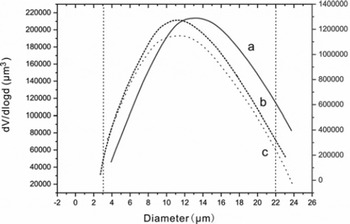
Fig. 7. Characteristics of volume size distribution at the three research sites: Miaoergou glacier (curve a), glacier No. 1 (curve b) and glacier No. 51 (curve c).
Much research concerning dust size distribution has been done at different locations around the world (Reference Osada, Iida, Kido, Matsunaga and IwasakaOsada and others, 2004). On Tateyama mountain, the volume median diameters of the dust particles are 6–21 μm. In the Spanish Mediterranean area, the mean size fraction of dust particles in ‘red dust rain’ is 4–30 μm, with a bimodal structure of about 4–7 and 18–22 μm. Mean dust diameters of 4–16 μm have been reported for Crete. Reference Osada, Iida, Kido, Matsunaga and IwasakaOsada and others (2004) also report variations in mean volume diameter of 2.5–10 μm for visible Saharan dust layers. The volume size distribution of dust in glaciers in central Asia exhibits similar size ranges (Reference Wake, Mayewski, Li, Han and QinWake and others, 1994). Median diameters of dust in snow and ice cores from Greenland, the Canadian Arctic (Penny Ice Cap) and Antarctica are about 1–2 μm (Reference SteffensenSteffensen, 1997; Reference Zdanowicz, Zielinski and WakeZdanowicz and others, 1998; Reference Delmonte, Petit and MaggiDelmonte and others, 2002; Reference Ruth, Wagenbach, Steffensen and BiglerRuth and others, 2003).
Our results show median diameters that are much larger than those in polar snows, but similar to those in visible dust layers in the snow at Tateyama and at Monte Rosa, European Alps, and the ‘red dust rain’ of the Spanish Mediterranean. The larger volume median diameter appears at sites closest to source regions. According to data derived from backward air trajectories from the Tien Shan, the typical transit time from possible major source regions (Gobi desert in Mongolia and Badain Jaran desert in northern China; Reference Sun, Zhang and LiuSun and others, 2001) to the eastern Tien Shan (about 1000 km distant) is 0.5–1 day in spring and summer. A recent study (Reference Maring, Savoie, Izaguirre, Custals and ReidMaring and others, 2003) of the change in size distribution during transatlantic dust transport suggested that a major shift of size distribution may occur within 1–2 days of transport. The volume median diameter is larger than that found in polar areas and is highly variable, probably because there is little change during initial transport since the Tien Shan are located near the source region of Asian dust. Furthermore, observed single-modal distributions imply dust particles from identical source locations or wind conditions. Although our preliminary analysis of backward air trajectories showed no conclusive differences for source regions between mono- and bimodal dust events, further systematic representative measurements of very large aerosols and modeling studies may provide insight into variations in size distribution.
3.4. Year-to-year change of amount of dust deposition
Figure 2 shows profiles of dust concentration at the study sites. We find there is a large year-to-year variability (Figs 2 and 3). For example, there is a large difference in dust concentration and flux between 2004 and 2005 at glacier No. 1: dust concentration in 2005 (2439–2658 μg kg−1) is much larger than in 2004 (551–915 μg kg−1). This result is repeated at glacier No. 51. The difference may be caused by atmospheric environment change during the past few years. In the area of the Ürümqi river source, the observed mean air temperature in 2004 was −5.7°C, with an annual precipitation of 357 mm; in 2005 the mean annual temperature was −6.4°C, with an annual precipitation of 451 mm. The temperature decreased and precipitation increased. Previous research has shown that climate change in the Ürümqi region can reflect climate change over a larger region in central Asia (Reference Wei, Gao and ShiWei and others, 2004). The temperature and precipitation of western China shows the same change trend as the Ürümqi region during recent years. Thus the year-to-year variability of dust deposited in the snow can reflect larger-scale environmental changes. Because of the temperature decrease, dust-storm incidences may become stronger (Reference Liu, Yao, Thompson and DavisLiu and others, 1999), and the precipitation increase may cause more wash-out of insoluble micro-particles of atmospheric aerosol into snow deposited on the glaciers. Thus dust profiles within the snow cover over the past 4 years reveal frequent, sporadic high dust concentrations and large year-to-year variability in the amount deposited, implying that dust deposition in the eastern Tien Shan is sensitive to atmospheric environment change. However, the process of aerosol dust deposition is still not clear and further research is needed.
4. Conclusions
Wind-blown mineral dust derived from the crustal surface is an important atmospheric component affecting the Earth’s radiation budget. Dust storms are an important phenomenon in arid and semi-arid regions of central Asia. Deposition of water-insoluble dust was measured in snow deposited on Ürümqi glacier No. 1, Haxilegen glacier No. 51 and Hami Miaoergou glacier, in the eastern Tien Shan. Analysis of the horizontal distribution of dust layers, snow height and dust concentration in the snow cover suggests that dust deposition in the eastern Tien Shan varies across the three research sites, as the atmospheric environment changes from west to east. Both dust concentration and volume size distribution exhibit an increasing trend from west to east. Mean concentration of micro-particles with 0.57 < d<26 μm in the snowpack is 220 × 103 mL−1, with a mass concentration of 1837 μg kg−1. Dust flux to the eastern Tien Shan has a range of 69.8–92.3 μg cm−2 a−1 for micro-particles with 0.57 < d<26 μm. The concentration and flux of dust particles in this work is very high compared to data from remote sites such as Penny Ice Cap, while it is comparable to the results of other sites such as Mustagh Ata and Chongce in the central Asian region, and Tateyama in Japan. Dust layers in the snow cover contain Ca- and Na-rich materials typically found in Asian mineral dust particles. Volume size distributions of dust particles in the snow showed single-modal structures having volume median diameters of 3–22 μm. Dust profiles in snow cover over the past 4 years reveal frequent, sporadic high dust concentrations and large year-to-year variability in the amount deposited, implying that dust deposition in the eastern Tien Shan is sensitive to atmospheric environmental change. However, the process of aerosol dust deposition in the snow of the eastern Tien Shan is still unclear and further research is needed to understand the process of dust deposition.
Acknowledgements
We thank two anonymous reviewers, the scientific editor D. Peel and chief editor T.H. Jacka for helpful comments, suggestions and language editing that greatly improved the manuscript. This work was jointly supported by National Key Project for Basic Research of China (2007CB411501), the Knowledge Innovation Project of the Chinese Academy of Science (KZCXZ-YW-127), National Natural Science Foundation of China (40631001, 40571033, 40701034, 40371028, J0630966, 40701035) and The Project for Outstanding Young Scientists of National Natural Science Foundation of China (40121101).


