


Introduction
The subglacial, geothermally sustained, Grímsvötn lake in Vatnajökull, Iceland (Fig. 1), is a well-known source of jökulhlaups (Reference ThorarinssonThorarinsson, 1953, Reference Thorarinsson1965, Reference Thorarinsson1974; Reference RistRist, 1955; Reference BjörnssonBjörnsson, 1974, Reference Björnsson1988, Reference Björnsson1992) and various data from this type locality have played an important role in studies of the triggering mechanism and drainage of jökuhlaups (Reference ThorarinssonThorarinsson, 1953; Reference GlenGlen, 1954; Reference BjörnssonBjörnsson, 1974, Reference Björnsson1988, Reference Björnsson1992; Reference NyeNye, 1976; Reference Spring and HutterSpring and Hutter, 1981; Reference ClarkeClarke, 1982). This paper presents revised data on the volumes of jökulhlaups from lake Grímsvötn for the last 60 years and describes how the volumes were derived. The data have already been used in recent studies of the simulation of the jökulhlaups (Reference BjörnssonBjörnsson, 1992), for the estimate of the volatile release rates from Grímsvötn (Agústsdóttir and others, 1992) and for re-evaluation of the geothermal power in the Grímsvötn caldera (Reference Björnsson and GudmundssonBjörnsson and Gud-mundsson, 1993)


Fig. 2. The Grímsvötn area as mapped with precision barometry in June 1987 (contour interval 25 m). The margins of the 160 k m2 ice-drainage basin are shown. The flat area at 1400 m elevation is an ice shelf covering the subglacial lake (of 10 km2). The thick dashed and dotted lines mark the subglacial paths of jökulhlaups. The thick dashed line is considered to be the path of most jökulhlaups (Reference BjörnssonBjörnsson, 1988). The lake level at the time of the survey was 137 4 m a.s.l. The measurements of ice-shelf thickness shown in Figure 6 were made along the profile A-B. Rocks are exposed in the caldera walls that border the lake toward the south, the steep northern slopes of the ridge Grímssfjall.

Fig. 3. A bedrock mop of the Grímsvötn area (contour interval 50 m) as mapped by radio-echo sounding and seismic reflection in 1987 (Reference BjörnssonBjörnsson, 1988; Reference GudmundssonGudmundsson, 1989). The area covered by the subglacial lake in 1987 is shaded. The rock fare exposed on the southeastern margin of the caldera is roughly defined by the 1600 m contour on the ridge Grímsfjall. The inferred pathways of jökulhlaups are shown in Figure 2.

Fig. 8. Map of the ice surface in Grímsvötn in 1946 (contour interval 25 m). The map is mode from air photographs using benchmarks of known height on the southern and western slopes for elevation reference. The accuracy of spatial coordinates is 100 m but 5 m in absolute heights. The relative accuracy of heights is of the order of 1 m. The lake level was 1376 m a.s.l. Comparison with a map drawn by the U.S. Army Map Service (sheet 5920II, 1: 50,000, Series C762), using the same set of air photographs without ground-elevation control, shows that the elevations on the AMS map are in error by as much as 50 m.

Fig. 9. Changes in ice-surfare elevation in Grímsvötn between 1946 and 1987 (in metres). The map is obtained by subtracting the surface elevation in 1946 from that in 1987. The largest increases in ice thickness have occurred to the northeast, northwest and southwest of the lake.
The first crude estimate of the volume of a Grímsvötn jökulhlaup (10 km3) was made by Reference NielsenNielsen (1937) after the 1934 event. With time, progressively better data have been collected and increasingly more sophisticated methods have been applied. The approaches used may be listed as follows:
-
1. Prior to 1954, the discharge of jökulhlaups was estimated from eyewitness accounts together with rough mass-balance estimates for the Grímsvötn drainage basin, assuming steady-state conditions. From these data, hydrographs were drawn for some the jökulhlaups (Reference ThorarinssonThorarinsson, 1953, Reference Thorarinsson1974) The volume drained in the largest jökulhlaups (in 1934 and 1938) was estimated to have been about 7 km3 (Reference ThorarinssonThorarinsson, 1974).
-
2. In the period 1954-72, the Manning equation was used to estimate discharge of jökulhlaups and their hydrographs. (The Manning equation (e.g. Reference ChowChow. 1964) relates the velocity of water flow in an open channel to the depth of the channel, the gradient along the direction of flow and the roughness of the channel.) These estimates yielded a total volume in the range 2.8-3.5 km3 for the four jökulhlaups that occurred during this period (Reference RistRist, 1955, Reference Rist1973, Reference Rist1990).
-
3. After construction of bridges across the rivers on the Skeidarðrsándur outwash plain in 1974, direct measurements of water depth and velocity in the flood channel could be made. The volume drained in the five jökulhlaups since 1976 has varied from 0.55 km3 to 1.9 km3 (Reference RistRist, 1984; Reference Kristinsson, Zóphóníasson, Pálsson and KrislmannsdóttirKristinsson and others, 1986; Reference Pálsson, Zóphóníasson, Sigurdsson, Krislmannsdóuir and AdalsteinssonPálsson and others, 1992; personal communication from S. Zóphóníasson, 1993).
-
4. For the jökulhlaup of 1986, Reference BjörnssonBjörnsson (1988) evaluated the volume of water drained out of Grímsvötn from the changes in lake geometry during the jökulhlaup. This approach was made possible through the availability of data on bedrock topography acquired by radio-echo soundings and seismic reflection in 1987 (Reference BjörnssonBjörnsson, 1988; Reference GudmundssonGudmundsson, 1989).
Here, we present a record of lake drainage, extending hack to 1934, using the approach of Reference BjörnssonBjörnsson (1988). Furthermore, we compare the volumes drained in jökulhlaups with data on mass balance for the Grímsvötn ice-drainage basin.
The Grímsvötn Area
Extensive studies of the geometry of the Grímsvötn area (Figs 2 and 3) have been described in recent years (Reference BjörnssonBjörnsson, 1974, Reference Björnsson1988; Reference GudmundssonGudmundsson, 1989; Reference Björnsson, Pálsson and GudmundssonBjörnsson and others, 1992). The lake is located within the caldera complex of the Grímsvötn volcano in the western part of the Vatnajökull ice cap (Figs 1 and 2). Three caldera structures have been identified (Fig. 3), ranging in area from 11 to 20 km2 (Reference Gudmundsson and BjörnssonGudmundsson, 1992). The total heat released from the volcano in the period 1922-91 was 8.1 × 10l8J (see Reference Björnsson and GudmundssonBjörnsson and Gudmundsson, 1993), yielding an average heat output of 3720 MW. However, this average value is misleading, as the power has varied by an order of magnitude over this period, with a high of 11 600 MW in 1934-38 and a low of 1600 MW in 1976-82. These changes in thermal output are attributed to variations in volcanic activity (Reference Björnsson and GudmundssonBjörnsson and Gudmundsson, 1993).
The Grímsvötn geothermal area has created a in the ice surface over the caldera region. This depression has a diameter of 10 km and a depth of about 300 m (Fig. 2). The ice thickness in the area is, on average, 300-500 m and in recent years the floating ice cover of the lake has been 230-260 m thick (Reference BjörnssonBjörnsson, 1988). The floating-ice cover has the characteristics of an ice shelf; its interior parts are flat, floating in hydrostatic equilibrium, and the margins are marked by an abrupt change in surface slope. To the south and west, the lake is bordered by the caldera walls. As the lake level rises during the intervals between jökulhlaups, the lake expands towards the north and northeast.
The mechanism of Grímsvötn jökulhlaups and their general characteristics have been described by Reference BjörnssonBjörnsson (1974, Reference Björnsson1988, Reference Björnsson, Pálsson and Gudmundsson1992) and only a brief summary is given here. The lake is contained by a potential pressure barrier of the ice surrounding the depression and the lowest in the ice surface occurs to the east of the lake (Fig. 2). This low in the barrier is termed the ice dam. The triggering mechanism of Grímsvötn jökulhlaups has not been fully explained. Jökulhlaups occur at a lake level considerably lower than required to float the ice dam. At the start of most jökulhlaups the ice-overhurden pressure at the ice dam exceeds the subglacial water pressure maintained hy the lake by 5-7 bar. Reference BjörnssonBjörnsson (1988) suggested this might be due to weaknesses in the dam caused by basal ice movement. The jökulhlaups do not drain the lake completely as they usually terminate abruptly when the lake level has fallen by about 100 m.
Changes in Lake Volume and Estimates of the Volume of JÖkulhlaups
Lake geometry
The volume of water that is drained from the subglacial lake can be estimated from changes in lake level during jökulhlaups and the thickness and areal extent of the floating ice shelf.
The extent of the subglacial lake may be determined from that of the flat ice shelf floating on the lake. Moreover, crevasses formed at the margins of the ice shelf during jökulhlaups demarcate the margins of the lake prior to the event. This was confirmed by field studies during the jökulhlaup of 1991 and by comparing air photographs with maps made after the jökulhlaups in 1945, 1960 and 1986. Hence, vertical air photographs, taken shortly after the termination of jökulhlaups in 1945, 1954, 1960, 1972, 1983 and 1986 were used to determine the extent of the lake (Fig. 4).

Fig. 4. Margins of the subglacial lake at the start of the jökulhlaups in 1945, 1954, 19 m, 1972, 1986 and 1991. The margins were located on vertical air photographs showing the large crevasses which formed above the grounding line during the jökulhlaups. A denotes the lake area andzw the lake level.
The lake level has been measured annually since 1955 by the Iceland Glaciological Society. In most years, it could be measured directly in patches of open water along the western or southern hillslopes. The measurements have been done by optical or barometric levelling using benchmarks of known height on the hillslopes at the margins of the main caldera. In addition, intermittent measurements of the ice-shelf elevation and lake level were made in the period 1935-53 (Reference ÁskelssonÁskelsson, 1936; Reference ThorarinssonThorarinsson, 1953; personal communication from S. Sigurdsson, 1946) and photogrammetry was used to determine the lake level in 1945, 1946 and 1954. Gaps remaining in the record of lake level in the period 1934— 55 were filled with estimates based on photographs taken by expeditions that inspected the area, either on Foot or from the air. These photographs show either the rock face at the southeastern margin of the caldera or the slopes at its western margin (Figs 2 and 3). Open water was observed along these slopes and its level could be estimated by referenre to landscape features of known height. In these various ways, we have extended the lake-level record back to 1934 (Fig. 5).

Fig. 5. The lake level in Grímsvötn over the period 1934-93. The largest drop in lake level occurred in 1934,150-160 m. No lake-level measurements exist between 1938 and 1942. However, the occurrence of the jökulhlaups in 1939 and 1941 is well documented (Reference ThorarinssonThorarinsson, 1974). The dotted curve shown in 1938-42 and the minimum in 1948 are estimated from the rise of the lake level in 1934-38 and 1945-48.
Thickness of the ice shelf
The thickness of the ice shelf has been measured several times since 1976 by using radio-echo soundings (Reference Ferrari, Miller and OwenFerrari and others 1976; Reference BjörnssonBjörnsson, 1988, unpublished data). In most years between 1958 and 1975, concurrent with the lake-level measurements, profiles (A-B; see Fig. 2) were optically or barometrically levelled across the floating ice shelf (Reference ThorarinssonThorarinsson, 1965; Reference BjörnssonBjörnsson, 1988). These surface profiles may he used to calculate the thickness of the ice shelf provided a reliable estimate of the bulk density of the floating ice can be made. Reference BjörnssonBjörnsson (1988) used the surface profiles to calculate ice thickness using a constant density value of 900 kg m−3 for all the profiles. The calculations showed a gradual increase in thickness between 1960 and 1980. A more detailed study of this change in thickness is now possible as better data have been gathered on the bulk density of the ice shelf and the density stratification of its uppermost 30 m.
The bulk density, ρb, of the ice shelf may be calculated using p b = (1 − Δz/z t,)ρ w where Δz is the difference in elevation between the ice-shelf surface and the lake level, z t is the total thickness of the ice shelf and ρw = 1000 kg m−3 is the density of water. In the period 1983—91, when Δz was 27.5-28 m, radio-echo soundings showed the thickness of the ice shelf in the central area to he about 250 m, giving a mean bulk density of 889 ± 4 kg m−3. An independent measurement was obtained by drilling in 1991, which gave z t = 252 ± 2 m and Δz = 28.2 ± 0.2 m, yielding a bulk density of 888 ± 1 kg m−3. An ice core from the upper most 25 m of the ice shelf; extracted in June 1993, showed a roughly linear increase in density with depth, and extrapolation suggests that the ice has acquired a density of about 900-910 kg m−3 at 30 m. These data indicate that the ice shelf may be divided into two layers, a 30 m surface layer with a mean density ρ 1 = 710 kg m−3 and an ice layer below 30 m depth with a constant density, ρ 2. Since the thickness and bulk density of the ice shelf in recent years is known, ρ 2 can be found from ρ b = (z 1 ρ 1 + z 2 ρ 2)/z t where z 1 = 30 m and z 2 = z t − z 1. Using ρ b = 888 kg m−3 and z t = 250 m, one obtains ρ 2 = 912 kg m−3. At times of known lake level, this density model may be used to convert data on surface elevation into thickness values provided the thickness and density of the surface layer has not changed with time. Indeed, seismic experiments on the ice shelf carried out in 1951 and 1987 (Reference Joset and HoltzschererJoset and Holtzscherer, 1954; Reference GudmundssonGudmundsson, 1989) indicate a similar structure of the surface layer, suggesting that application of the density model to the ice shelf in the period under consideration is justified.
The results suggest that the bulk density of the ice shelf has increased from 875-880 kg m−3 prior to 1960 to about 890 kg m−3 in the 1980s. This increase was caused by a general increase in the thickness of the ice shelf. Along the surface profile surveyed (A-B in Fig. 2) the mean thickness changed from about 150 m in 1960 to 220-230 ni in 1980 (Fig. 6). However, the central part of the ice shelf was thicker, 170-190 m prior to 1960, rising to 250-260 m in the 1980s.

Fig. 6. Mean ice-shelf thickness, 1946-91, along profile A-B (see Figure 2 for location).
Volume of jökulhlaups
The data on bedrock topography, lake size, lake level and the thickness of the ice shelf make it possible to estimate the volume of the lake at any given time (Fig. 7). The volumes drained during jökulhlaups in the period 1934-91 (Table 1) are obtained by subtracting the lake volume at the end of a jökulhlaup from the volume at its start. Measurements in á have shown that the temperature of the lake water is close to zero (for example, 0.05-0.2°C in 1991). Therefore, water produced by melting in the jökulhlaup tunnel due to advected heat is negligible compared to the total volume drained. However, the temperature of jökulhlaup water at the outlet has consistently been shown to be at 0.0°C (Reference BjörnssonBjörnsson, 1992) and it can therefore be assumed that all potential energy is converted to heat and dissipated by friction in the jökulhlaup tunnel during the transport from 1400 m elevation at Grímsvötn to 100 m at Skeiðarársadur. It can therefore be calculated that of the tunnel walls will increase the volume of the water discharged by 4%. This effect has been accounted for in the final value of the volume of the jökulhlaups in Table 1.

Fig. 7. Volume of the Grímsvötn lake 1934-93.
Table 1. Characteristics of jökulhlaups from Grímsvötn in 1934-91

The peak discharge of some of the jökulhlaups is estimated in the final column in Table 1. For some of the jökulhlaups before 1976, hydrographs had been drawn by Reference ThorarinssonThorarinaon (1974) and Reference Rist(Rist 1955, Reference Rist1990), assuming higher total volumes discharged than obtained here. The peak-discharge values in Table 1 are found by linearly scaling down these earlier estimates. For jökulhlaups after 1976, the values are those given by Reference RistRist (1984), Reference Kristinsson, Zóphóníasson, Pálsson and KrislmannsdóttirKristinsson and others (1986), Reference Pálsson, Zóphóníasson, Sigurdsson, Krislmannsdóuir and AdalsteinssonPálsson and others (1992) and Zóphóníasson (personal communication, 1993). Reference BjörnssonBjörnsson (1992) used these data to derive an empirical relation between peak discharge and total volume for Grímsvötn jökulhlaups.
For the period after 1945, the errors in lake size and in the drop in lake level are considered to be 3-4% but that in ice-shelf thickness is 8-10%. The resulting maximum error in volume stored ra the lake is 15-17%. The error in volume drained in the jökulhlaups is less sensitive to error in ice-shelf thickness, hence, the maximum error in volume drained is only 10-12%. The uncertainties prior to 1945 are 20% in lake volume and 15% in jökulhlaup volume. The internal consistency of the record is considerably better as the largest source of error, a systematic error in ice thickness, would shift all volume values either up or down.
Long-Term Mass Balance
In previous studies of the Grímsvötn basin, the mass of ice melted in Grímsvötn been assumed to be in long-term balance with the input of mass to the ice-drainage basin (Reference ThorarinssonThorarinsson, 1953, Reference Thorarinsson1974; Reference BjörnssonBjörnsson, 1974, Reference Björnsson1988). This assumption was justified by the long-term existence of the Grímsvötn depression. Available data on the mass balance, although indeed scarce, did not disprove the assumption as a valid first approximation. Over the last two or three decades, however, a positive mass balance of the surrounding glacier has been suspected due to the cooling of the geothermal system, as expressed by the shrinkage of the lake area and thickening of the ice shelf (Reference BjörnssonBjörnsson, 1988; Reference Björnsson and GudmundssonBjörnsson and Gudmundsson, 1993). Here, we present data on the long-term mass balance of the ice-drainage basin that are more detailed than published previously.
Mass balance of the ice-drainage basin
The average annual precipitation in the Grímsvötn area for the period 1950-85 was 3.0 ± 0.3 m a−1 (Reference BjörnssonBjörnsson, 1985, Reference Björnsson1988). This precipitation falls almost entirely as snow, so the total accumulation rate within the ice-drainage basin (averaging 170 km2 in the period 1945-65, declining to an average of 160 km2 in 1965-85) was 0.48-0.50 m3a−1. The average rate of melting by meteorol-ogical processes over the last several years was estimated to be 0.08 km3 a−1 (Reference BjörnssonBjörnsson, 1988) but from 1935 to 1960 it was 0.11 km3 a−13a−1, or 0.75 m a−1 averaged over the basin (25% of total accumulation). Figure 9 shows the difference in surface elevation between the two maps of the Grímsvötn basin, of 1946 (Fig. 8) and 1987 (Fig. 2), at about the same lake level, 1376 and 1374 m a.s.l., respectively. The ice thickness in the surroundings of the lake increased by 50-100 m as the area of the ice shelf (at this lake level) decreased from 23 to 10 km2. The increase in the ice volume due to this change in ice-surface elevation was 3.7 ± 0.7 km3. In addition, a volume of 1.5 ±0.3 km3, occupied by water in 1946, had been replaced by ice in 1987 (assuming a bulk density of the ice shelf of 880 kg m−3 in 1946). Hence, the total increase in ice volume was 5.8 ±0.8 km3 (equivalent to 4.8 ± 0.7 km3 of water), yielding a mean positive mass-balance rate of 0.12 ± 0.02 km3 a−1. Therefore, the mean rate of melting at the base of the glacier has been approximately 0.3 km3 a−1.
Water balance of the lake
These mass-balance calculations predict that the average rate of water accumulation in the Grímsvötn lake has been 0.08-0.ll km3a−1 from surface melt and about 0.28 km3a−1 from the basal melt, or a total of 0.36-0.38 km3 a−1. From the data in Table 1, the total volume of meltwater accumulauon in the Grímsvötn lake for the period 1945-86 is 15.2 ± 0.9 km3. This equals a mean rate of accumulation of 0.37 ± 0.02 km3a−1, in good agreement with that expected from the mass balance of the ice-drainage basin. This is an important result, since it shows that our record of drainage from Grímsvötn is accurate. Moreover, this supports the assumption that no net loss of ground water occurs from the Grímsvötn basin (Reference SigvaldasonSigvaldason, 1965; Reference BjörnssonBjörnsson, 1988).
If the mass balance had been in a steady state, melt-water would have accumulated in the lake at the rate of 0.50 km3 a−1 (requiring a basal melting rate of about 0.40 km3 a−1. Assuming such steady state, the water volume drained by the nine jökulhlaups during this period of 41 years, would have had to have been 4 km3 (25%) larger than estimated from the drainage record in Table 1. Instead, this volume was stored as ice in the ice-drainage basin.
In Table 2, the period 1945-86 has been divided into four 9-11 year long intervals and the mass balance of the ice-drainage basin has been estimated from the total precipitation and the water accumulation as given by the record in Table 1. Apparently, the basin was close to steady state in 1945-54 but positive mass balance has prevailed since 1954. Moreover, the mass-balance rate was positive by 0.23 km3 a−1 in 1976–86, or by 1.4 m a−1 averaged over the basin. These results agree with observations that indicated rapid thickening of the ice cover together with shrinkage of the lake after 1976 (Reference BjörnssonBjörnsson, 1988).
Table 2. Mass balance of ice-drainage basin and the Grímsvötn lake, 1945-86

Comparison with Discharge Measurements
Our record of jökulhlaup volumes may he compared to that obtained from discharge measurements in the rivers on Skeiðarársandur during jökulhlaups. The use of the Manning equation by Reference Rist(Rist 1955, Reference Rist1973, Reference Rist1990) in 1954–72 by measuring the cross-sectional area of the river channels after the event, complemented by coarse measurements of surface velocity, seems to have yielded results that are, on average, 25% too high. The combined volume of the four jökulhlaups that occurred in this penod is, according to our record, 9.9 ± 0.8 km3, whereas Reference Rist(Rist 1955, Reference Rist1973, Reference Rist1990) obtained 12.5 km3 from his application of the Manning equation. This supports Reference TomassonTómasson (1974), who suggested that the discharge measurements during the jökulhlaup of 1972 yielded too high a value. Tómasson attributed the error to the fact that the channel geometry varied during the jökulhlaup in an irregular manner.
More accurate discharge measurements have been made since 1976 (Reference RistRist, 1984; Reference Kristinsson, Zóphóníasson, Pálsson and KrislmannsdóttirKristinsson and others, 1986; Reference Pálsson, Zóphóníasson, Sigurdsson, Krislmannsdóuir and AdalsteinssonPálsson and others, 1992; personal communicanon 1993) and the volumes obtained for the jökulhlaups in 1976, 1982, 1983, 1986 and 1991 are compared in Table 3. The agreement between the two methods is quite good and well within the margin of error for all the jökulhlaups. However, our results give, on average, about a 5% smaller volume than do the discharge measurements. A systematic difference of this magnitude is not surprising considering the uncertainties of both methods. This 5% difference may be regarded as an indication of the absolute accuracy of our record, at least for the jökulhlaups after 1945.
Table 3. Comparison of jökulhlaup volumes measured in rivers on Skeiöarársandur and water volumes drained from Grímsvötn lake

Declining Volume Of Jökulhlaups
In general, we have determined the volume of water in jökulhlaups from the area of the lake, the thickness of its ice cover and the water levels of the lake at the onset and the termination of bursts. For the penod 1938–91, the results show a gradual decline in the volume of the jökulhlaups from Grímsvötn (Table 1). This decline results from a decreasing lake area and thickening of the ice shelf which, combined, reflect the decreasing geothermal power.
Gradually increasing triggering levels of jökulhlaups since 1945 (Fig. 5) are consistent with a gradual thickening of the ice dam (Fig. 10a). Exceptions do occur in jökulhlaups when warm water is involved, such as those of 1938, 1939, 1941, 1983 and possibly also 1945, 1948 and 1986 (see Reference BjörnssonBjörnsson, 1988, Reference Björnsson1992; Reference GudmundssonGudmundsson and Björnsson, 1991).
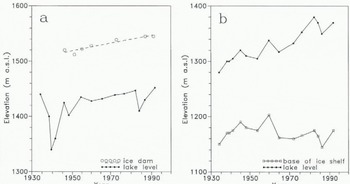
Fig. 10. (a) Elevation of the ice dam during the period 1945-91 (data for 1946-73 from levelling work by Sigurdsson (1946); Reference ThorarinssonThorarinsson (1965); Reference RistRist (1990); P. Búason (personal communication, 1993)), and the lake level at the start of jökulhlaups. The low level at the start of the jökulhlaups of 1938-48 was caused by the effects of the large eruption in 1938, while the eruption of 1983 affected the jökulhlaups in 1983 and 1986. (b) The lake level and the eleuation of the base of the ice shelf at the termination of jökulhlaups. The final lake level has been rising roughly in line with increasing thickness of the ice shelf, while no such trend occurs in the elevation of die base of the ice shelf.
The lake level at the termination of the jökulhlaups is, on the other hand, determined by the process which closes off the water conduits. Reference BjörnssonBjörnsson (1974, p. 21; Reference Björnsson1988, p. 83) suggested that the termination of the jökulhlaups may he explained by rapid deformation of arched subglacial tunnels as the vaulted smooth roof of the ice cover of Grímsvötn falls down on the relatively flat west-facing side of the subglacial ridge bordering the lake towards the east. Our data support this, as they show that the outbursts are terminated when the bottom of the ice shelf has subsided to about 1160 m a.s.l. (Fig. 10b). However, since the ice shelf has thickened hy about 70 m (Fig. 6), the lake level at the termination of jökulhlaups has risen from approximately 1300 to 1370 ma.s.l. (Fig. 10b).
Discussion
We have refined and extended the record of jökulhlaup volumes for Grimsvotn since 1934, a period when large changes in geometry of the Grímsvötn ice-drainage basin occurred, together with reduction in the size of the jökulhlaups. These changes are related to the declining heat flux of the Grímsvötn volcano; climate has only played a minor role (Bjömsson and Gudmundsson, 1993). It is, however, worth considering factors other than variations in volcanic activity and geothermal power which might, in the future, change the volume and frequency of jökulhlaups.
First, migration of geothermal activity towards the ice dam could lower the dam, reducing the lake level required to start jökulhlaups. Indeed, localized melting due to geothermal heat along the northeastern slopes of Grímsfjall (the dotted line in Figures 2 and 3) may open water courses which drain the lake at lower levels than usual, and this may have occurred in the small jökulhlaup of 1983 (Reference BjörnssonBjörnsson, 1988).
Secondly, changes in the surface elevation of the ice-drainage basin of Skeiðarárjökull in the vicinity of the ice dam may affect the height of the dam. The retreat of the margin of Skeiöarárjökull in response to a warmer climate was about 1-2 km in the period 1932-60 (Reference EythorssonEythórsson, 1963). The profile of a perfectly plastic ice cap with a basal shear stress (yield stress) of 1 bar (Reference PatersonPaterson, 1981, p. 154) suggests that a retreat of this magnitude could lead to a 10-20 m thinning at the centre of an ice cap such as Vatnajökull which has a half-width of 50 km. Such a lowering of the ice surface at the southern side of the ice dam would displace the centre of the dam towards the Grímsvötn lake as well as lower the dam. A lowering of the dam by about 10 m between 1934 and 1945 would explain the difference in the lake level at the onset of the jökulhlaups in 1934 and 1945 (1440 and 1425 m a.s.l., respectively). Data gathered by expeditions in 1919 (Reference WadellWadell, 1920) and 1935 (Reference ÁskelssonÁskelsson, 1936) suggest that the ice dam was higher at the time of these expeditions than between 1945 and 1960 (Fig. 10a). However, these data (map sketches based on sparse barometric data in 1919 and sparse trigonometric-survey data in 1935) are not sufficiendy detailed to yield definite height values for the ice dam.
Thirdly, Skeiðarárjökull has surged at least twice during this century, in 1929 (personal communication from O. Sigurdsson, 1993) and in 1991. Assuming the typical behaviour of a surging glacier, it is to be expected that the surges cause a lowering of the surface of the Skeiðarárjökull basin, followed by a gradual elevation increase during the pertod of quiescence. It is not known how large an area was affected by the 1929 surge. Hence, whether it affected the height of the Grímsvötn ice dam is unknown. The effects of the surge of 1991 on the dam is a subject of ongoing research.
If the current period of low volcanic and geothermal activity continues, positive mass balance of the ice-drainage basin in excess of 1 m a−1 will ensure continued thickening of the ice shelf and the surrounding area. This should lead to a smaller lake, both in area and in volume, since, for any given lake level, a gradually larger part of the volume beneath that level would be taken up by ice. The trend of increasing elevation of the ice dam should also continue, coupled with a slight migration of the ddm towards the lake. However, provided the geothermal power does not decrease below 1600-2300 MW observed since 1976 (Reference Björnsson and GudmundssonBjörnsson and Gudmundsson, 1993), the rate of melting due to geothermal heat will remain close to 0.2 km3 a−1. Since surface melt is about 0.08 km3 a−1, the rate of water accumulation (and the volume drained in jökulhlaups) would remain at about 0.3 km3 a−1. This suggests that the jökulhlaups should become smaller and more frequent. If the geothermal power declines further, the jökulhlaups will become even smaller. On the other hand, were the volcanic activity to increase in the future, the enhanced melting could lead to a thinner ice shelf, thus increasing the area of the subglacial lake and, hence, its storage capacity. Conditions might again become similar to those observed earlier this century.
Acknowledgements
S. Zóphóníasson, hydrologist at the National Energy Authority, gave us access to his unpublished results on re-evaluation of the discharge measurements from the jökulhlaup of 1976. Grants from the Research Fund of the University, of Iceland and the Iceland Road Authority made study possible. The Iceland Glaciological Society and the National Power Company provided assistance and support for field work. Constructive reviews by C. Benson, R. LeB. Hooke and J. Walder improved the quality of the paper.


