


1. Introduction
The manner in which sediment is transferred through glaciers is important because it links glacial processes to the landscape record. Research is increasingly revealing that the pathways taken by this sediment are more complex than originally considered. For example, research at polythermal valley glaciers over the past ∼10 years has shown that the pathways followed by englacial debris appear to be closely associated with the complex internal structure of those glaciers (Reference Hambrey, Dowdeswell, Murray and PorterHambrey and others, 1996, Reference Hambrey, Bennett, Dowdeswell, Glasser and Huddart1999). Consequently, investigations of englacial debris transport pathways have been closely allied to parallel investigations of structural glaciology. A great deal of this research effort has been directed towards explaining the origin of supraglacial longitudinal and transverse debris-rich ridges exposed near the frontal margins of numerous polythermal valley glaciers (Reference Glasser and HambreyGlasser and Hambrey, 2001). These supraglacial ridges are typically tens to hundreds of metres long, some decimetres high and up to a few metres wide, and have been associated with proglacial and relict moraine-mound landform assemblages (Reference HambreyHambrey and others, 2005). Longitudinal debris ridges form parallel to longitudinal foliation, which has an axial-planar relationship with large-scale lateral folding of stratification. Large-scale folding of stratification occurs under a laterally compressive stress regime as ice from multiple flow units converges into a narrow ice tongue (Reference Hambrey and GlasserHambrey and Glasser, 2003). On the basis of these structural relationships, it was advanced that folding elevates englacial and subglacial debris incorporated within stratifications into flow-parallel fold axes that plunge gently up-glacier. The debris then melts out to form longitudinal debris ridges. Later, Reference Hubbard, Glasser, Hambrey and EtienneHubbard and others (2004) analysed the sedimentology and isotopic chemistry of the debris-bearing ice forming the core of these ridges (in this case located on midre Lovénbreen and austre Brøggerbreen, Kongsfjorden, Svalbard). The ice in these ridges was interpreted as basal ice, elevated intact from the glacier bed, the character of which was compatible with entrainment of debris at the bed. However, Reference Woodward, Murray and McCaigWoodward and others (2002) challenged the role of large-scale lateral folding and foliation development in longitudinal debris-ridge formation on the basis of the geometric relationship between these structures and the ice surface. These authors further suggested that longitudinal debris ridges may form by the meltout of basal crevasse-fill sediments that have become oriented parallel to ice flow under high cumulative strain.
Reference Hambrey, Bennett, Dowdeswell, Glasser and HuddartHambrey and others (1999) and Reference Hambrey and GlasserHambrey and Glasser (2003) incorporated their model of large-scale lateral folding for longitudinal supraglacial debris-ridge formation into a broader model describing the associations between polythermal valley glacier structure and englacial debris transfer. This framework, based largely on surface structural mapping, additionally explained certain transverse supraglacial ridges located on the tongues of these Svalbard glaciers as the products of advection of basal debris along arcuate shear planes or thrusts. These authors reported that the transverse debris ridges associated with thrusts emerge at the glacier surface near its terminus as linear ridges of sediment-rich ice capped with a layer of melted-out debris. However, this model is by no means universally accepted and a widely held alternative hypothesis for the formation of supraglacial transverse debris ridges invokes the squeezing of till or the injection of turbid meltwater into basal crevasses. The formation of basal crevasses is commonly associated with tidewater glaciers (Reference Mickelson and BerksonMickelson and Berkson, 1974) but may also occur in valley glaciers where high basal water pressures are present (Reference Van der VeenVan der Veen, 1998), for example within an overdeepening (Reference Ensminger, Alley, Evenson, Lawson and LarsonEnsminger and others, 2001), during a jökulhlaup (Reference Kozarski and SzupryczynskiKozarski and Szupryczynski, 1973) or during an active surge phase (Reference KambKamb and others, 1985; Reference LawsonLawson, 1996). The advection of basal sediments by squeezing into basal crevasses and incorporation into thrusts is considered to produce transverse debris ridges of very similar morphological and sedimentological composition. However, Reference Hubbard, Glasser, Hambrey and EtienneHubbard and others (2004) reasoned that the two processes possibly could be distinguished on the basis of: (1) oxygen isotope ratios; (2) sediment macrofabric; and (3) particle sorting. While these criteria have the potential to make the interpretation of contemporary supraglacial transverse debris ridges less ambiguous, application of a polythermal landsystems model (Reference Glasser, Hambrey and EvansGlasser and Hambrey, 2003) to the Quaternary sediment record, notably to moraine-mound complexes (Reference Bennett and BoultonBennett and Boulton, 1993; Reference GrahamGraham, 2002), remains problematic (Reference LukasLukas, 2005, Reference Lukas2007; Reference Graham, Bennett, Glasser, Hambrey, Huddart and MidgleyGraham and others, 2007).
Studies combining surface and ice-marginal mapping with sedimentological investigations commonly extrapolate surface structures into their englacial positions to recreate the three-dimensional (3-D) structure of the features and glaciers concerned. Recently, a new technology, digital optical televiewing (OPTV), has been applied to ice bore-holes which has the capability to image the internal structure of ice masses directly and more accurately than can surface observations (which are often carried out on ice that is, or has been, degraded by surface melting and/or meltwater). OPTV provides a continuous oriented 360° true-colour optical image of borehole walls. This is achieved by recording continuously an annular image of the borehole wall at a maximum vertical resolution of 1 mm and a maximum horizontal resolution of 720 pixels per row (yielding a horizontal resolution of ∼0.8 mm in a borehole of diameter 180 mm) (Reference Hubbard, Roberson, Samyn and Merton-LynHubbard and others, 2008), providing the capacity to yield valuable information relating to the detailed content and structure of glaciers.
The dual aims of this paper are: (1) to evaluate the potential of borehole OPTV to contribute to our understanding of the 3-D structure of ice masses; and (2) to combine OPTV logs from multiple boreholes with surface mapping to characterize the principal ice structures present in the terminus region of a single polythermal valley glacier, paying particular attention to the debate surrounding the elevation of basal debris into an englacial position. To these ends we apply OPTV to six boreholes drilled by hot water in two locations in the frontal zone of midre Lovénbreen. The resulting OPTV logs are analysed for their structural and physical characteristics. This information is combined with surface mapping to allow those structures to be interpolated into 3-D space and intercompared.
2. Field Site
Fieldwork was conducted at midre Lovénbreen, a ∼4 km2 polythermal valley glacier located in northwest Spitsbergen (Fig. 1). The glacier is composed of four accumulation basins feeding into a narrow tongue, with an equilibrium-line altitude (ELA) at ∼400 m a.s.l. In addition to the structural sedimentological research carried out at the glacier (outlined above), previous research has also focused on mass balance (Reference Rees and ArnoldRees and Arnold, 2007), ice surface roughness (Reference Arnold, Rees, Hodson and KohlerArnold and others, 2006), hydrology (Reference Irvine-FynnIrvine-Fynn and others, 2005) and ice radar-based investigations of the glacier’s basal conditions and thermal regime (Reference King, Smith, Murray and StuartKing and others, 2008).
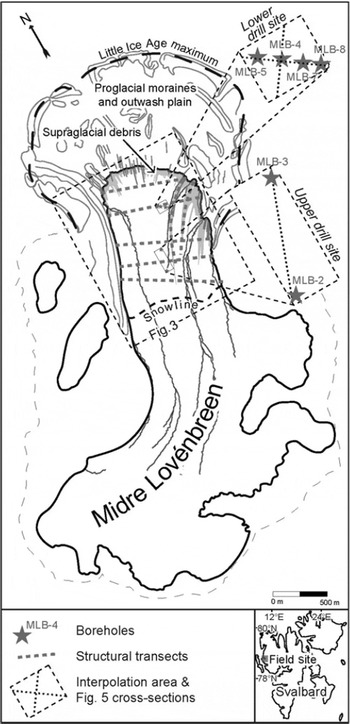
Fig. 1. Map of midre Lovénbreen with position of boreholes, upper and lower drill sites, surface mapping transects, orientation of Figure 3 and orientation of flow-parallel and flow-normal cross-sections in Figure 5. Flow-unit boundary and supraglacial debris ridge referred to in sections 4 and 5 are ∼20 m east of the lower drill site. Inset shows location map of midre Lovénbreen in Svalbard.
3. Data Acquisition and Analysis
Six boreholes, drilled to the glacier bed at depths of 40–105 m using a Kärcher pressure washer hot-water drill (following methods detailed by Reference Hubbard and GlasserHubbard and Glasser, 2005), were logged successfully with an OPTV system (Reference Hubbard, Roberson, Samyn and Merton-LynHubbard and others, 2008; Fig. 2). To avoid small-scale bends in the borehole, past which the 2050 × 51 mm OPTV sonde cannot pass, a particularly long (∼3 m) drill stem was used. While this had the desired effect of smoothing out small-scale bends in the boreholes, it did result in holes that dipped at increasingly shallow angles (<45°) with depth at a uniform azimuth. Borehole spacing was 180 m at the upper drill site (two boreholes) and 20–30 m at the lower drill site (four boreholes; Fig. 1). Repeat OPTV logging recorded a total of ten borehole logs from the six boreholes drilled (four logs were carried out in both the down and up directions, revealing no notable difference), with a cumulative length of 690 m.
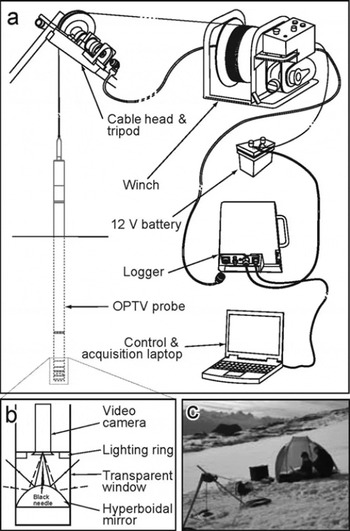
Fig. 2. OPTV system set-up presenting the main system components. (a) The system illustrated as a line drawing. (b) Detailed drawing of the OPTV probe head, illustrating the principles of image acquisition. (c) Photograph of the system operating at the glacier surface.
Surface structures were mapped from 2005 aerial photography and supplemented by field measurements (dip, strike, orientation, length, width, crystal size and cross-cutting relationships) along seven transects (Fig. 1). Structural elements are classified and coded according to standard convention, with stratification being labelled from S0 upwards and folds being labelled from F1 upwards (Reference Hambrey, Lawson, Maltman, Hubbard and HambreyHambrey and Lawson, 2000; Fig. 3).
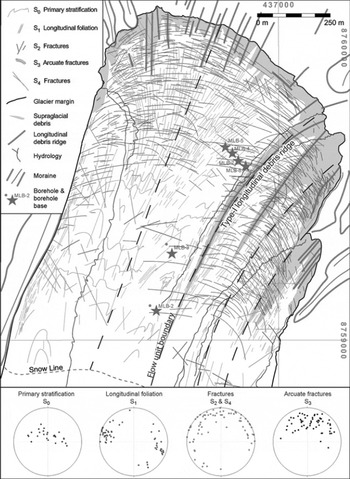
Fig. 3. Map of structures and sediment identified at the glacier surface from fieldwork and aerial photographs, with poles-to-planes Schmidt equal-area lower-hemisphere stereoplots showing orientation and dip direction of structures measured below the snowline: Positions of boreholes, flow-unit boundaries and supraglacial debris ridges are also shown.
Raw borehole logs were analysed using proprietary software (Rgldip), in the form of unrolled images oriented north–east–south–west–north (Fig. 4). Planar structures intersected by the borehole are translated by cylindrical projection into a sinusoid in the unrolled image. Structural data from each borehole log were converted into a Universal Transverse Mercator (UTM) Cartesian coordinate system (x, y, z) using differential GPS coordinates of the borehole top and deviation logs. Dip and azimuth data were then converted into Lagrangian vectors (u, v, w) and exported to Voxler, a 3-D data visualization package. The 3-D structure of the glacier was reconstructed by interpolating dip and direction-of-dip data between boreholes for each structural unit identified using a north–south-oriented lattice of grid nodes. Structural data were processed in two spatial subsets: between boreholes MLB-1 and MLB-2 (labelled upper drill site; Fig. 1) and between boreholes MLB-3, MLB-4, MLB-5 and MLB-6 (labelled lower drill site; Fig. 1). The horizontal extent of both interpolation areas is provided in Figure 1. Interpolation used a simple inverse power law function, in which planar data were treated as Lagrangian vectors. Following Reference DavisDavis (1986) the interpolated node ![]() is defined as
is defined as

where Ci are neighbouring points, β is the power-weighting parameter, hij is
d ij is the distance between grid node j and neighbouring point i, and δ is the smoothing parameter. Interpolation was executed at a horizontal resolution of 10 m and a vertical resolution of 0.5 m at the upper drill site, and at a horizontal resolution of 1.5 m and a vertical resolution of 0.5 m at the lower drill site. The power-weighting parameter β was equal to 2 and smoothing was turned off (δ = 0). This created a lattice in which nodes that coincide with empirical data were equal to the empirical data, and in which the influence of empirical data on each lattice node decreased with distance. These parameters were optimized following manual iteration to create the best approximation whilst minimizing artefact propagation.
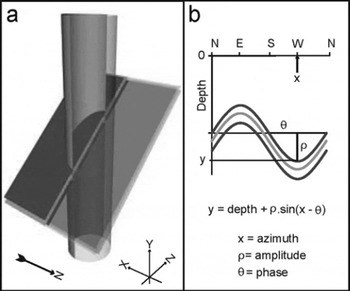
Fig. 4. Illustration of the relationship between (a) steeply dipping planes intersected by a borehole and (b) the representation of the planes as sinusoids on a raw (unrolled) OPTV image. Note that boreholes dip increasingly towards 45° in an easterly orientation with depth.
Planar structures were generated as a series of directional elements, or streamlines, located within a vector lattice, and visualized as nodes in a virtual 3-D space (a so-called scene graph). Certain vertically dipping structures were identified only at the ice surface and not in the OPTV logs and were consequently of unknown vertical extent. To allow these features to be visualized in the scene graphs and structural diagrams (e.g. Fig. 5), they were assumed to have a uniform depth of 25 m.
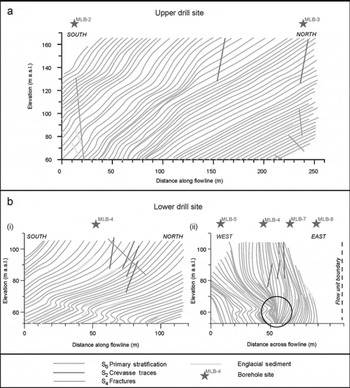
Fig. 5. Cross-sections through interpolated 3-D scene graphs of glacier structure at (a) the upper drill site and (b) the lower drill site, (i) parallel to the flow and (ii) orthogonal to the flow looking down-glacier. Hinge of large-scale lateral fold (F1) is highlighted by circle. For orientation of cross-sections see Figure 1. Note that the depths of S1 and S2 structures are unknown and have been assigned as 25 m only to make them visually apparent.
4. Results
Several structural elements are identified on the basis of the OPTV logs and surface observations. These are illustrated and characterized below.
4.1. Continuous layering (S0)
At the glacier surface, laterally continuous broadly arcuate planar structures are apparent below the snowline, dipping up-glacier between 2° and 40° (Fig. 3). S0 is composed of regularly alternating layers of coarse bubble-rich ice, coarse bubble-poor ice and fine bubble-rich ice.
OPTV borehole logs are characterized by continuous alternating sub-parallel layers of bubble-rich ice and bubble-poor ice, 0.01–0.1 m and 0.001–0.01 m thick, respectively (Fig. 6a). Bubble-rich ice can be divided into two subfacies: coarse-grained bubble-rich ice and fine-grained bubble-rich ice, with the ice crystals being ∼35–100 mm and ∼0.5– 3.0 mm in diameter, respectively. Bubble-poor ice occurs only as coarse crystals ∼35–100 mm in diameter. Borehole OPTV log analyses identify 1358 stratification layers with highly variable dips, ranging from near-horizontal to 71° (Fig. 7). Contacts between layers are predominantly gradational between coarse bubble-poor ice and coarse bubble-rich ice facies. Upper boundary contacts between fine bubble-rich ice and coarse ice are noticeably sharper. Paraconformities in continuous layering occur at 15 locations within borehole OPTV logs, characterized by an irregular sharp contact between a fine bubble-rich lower plane and a bubble-poor upper plane (Fig. 6a).
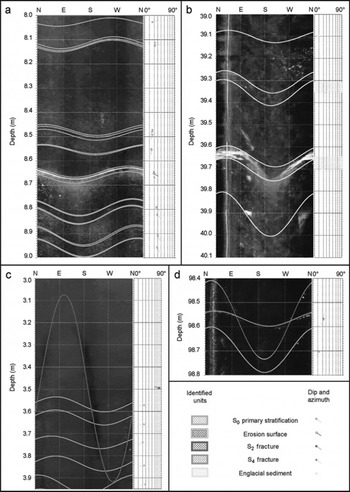
Fig. 6. Unrolled borehole logs illustrating contrasting ice types: (a) S0 primary stratification displaying paraconformity (8.65 m) interpreted as a summer erosion surface from MLB-7; (b) primary stratification intercalated with laminated and sheared basal ice (at 39.65 m) and sand- to cobble-sized clasts from MLB-4; (c) S0 primary stratification cross-cut by S2 transverse fractures from MLB-8; and (d) primary stratification cross-cut by S4 oblique fracture from MLB-3.
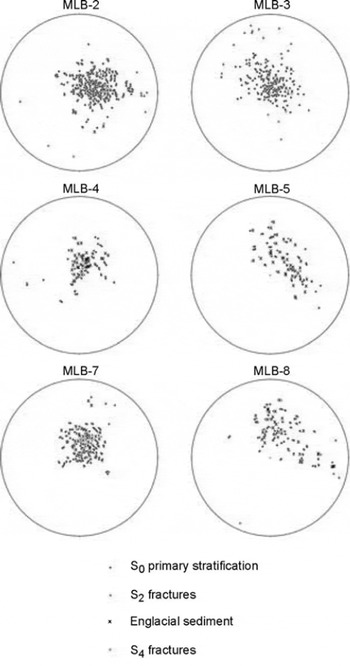
Fig. 7. Poles-to-planes Schmidt equal-area lower-hemisphere stereoplots for boreholes MLB-2, MLB-3, MLB-4, MLB-5, MLB-7 and MLB-8 showing dip and azimuth of structures identified and englacial sediment layers.
3-D reconstructions of internal glacier structure (Fig. 5) reveal that the dip of S0 continuous layering is highly variable, plunging up-glacier at angles from 10° to 40° and dipping across-glacier at angles of 10° to near-vertical. Reconstructions of S0 continuous layering at the upper drill site are consistent with surface observation in the vicinity of each borehole (Fig. 3). However, borehole spacing here is 180 m, so reconstructions between the boreholes are oversimplified and should be treated with caution. Notably, F1 large-scale lateral folding of S0 primary stratification, halfway between MLB-2 and MLB-3 (Fig. 3), is not included in the reconstruction as it was not sampled by any borehole observations. Borehole spacing at the lower drill site resulted in reconstructions of S0 continuous layering that were consistent with surface observations. This consistency suggests that a borehole spacing of 20–30 m is sufficient to produce reliable reconstructions of the 3-D distribution of S0 in this area. Interpretation of S0 continuous layering (section 5.1) therefore concentrates on the 3-D reconstruction at the lower drill site. The dip of S0 continuous layering is described in greater detail in the context of fold structures (section 4.2).
4.2. Fold structures (F1, F2, F3)
Large-scale (10–50 m) lateral folding (F1) of S0 continuous layering into similar or chevron-type folds is visible from aerial photographs. Fold axes are oriented parallel to flow-unit boundaries (Fig. 3) and surface flow vectors (Reference Rees and ArnoldRees and Arnold, 2007). At the glacier surface, below the snowline, small-scale (1–10 m) parasitic folds are ubiquitous on the large-scale lateral folds, being more easily identifiable at the ice surface than large-scale folds. These are also lateral similar folds, with flow-parallel fold axes that consistently dip gently up-glacier.
The orientation of S0 stratification as revealed by 3-D interpolation (Fig. 5b(ii)) within the flow-normal borehole array at the lower drill site (Fig. 1) is consistent with large-scale lateral folding. Here the dip of S0 continuous layering increases from east to west transverse to ice flow, from ∼35° at MLB-5 to near-vertical at MLB-4. At MLB-7 the dip of S0 continuous layering decreases to ∼70°. At depth within the ice mass (at ∼60 m a.s.l.), S0 stratification also forms a large-scale lateral fold hinge (highlighted in Fig. 5b(ii)), characterized by near-vertical dips at the fold axis and planes dipping less steeply away from the central fold hinge, trending up-glacier at angles of 10–40°.
The configuration of the F1 fold hinge (highlighted in Fig. 5b(ii)) is complicated by further medium-scale horizontal (F2) folding. This decimetre-scale horizontally oriented similar fold (F2) occurs in S0 continuous layering at 40–50 m depth within MLB-4 (Fig. 5b) ∼10 m above the bed (according to the subglacial topography digital elevation model from Reference RippinRippin and others (2003); see fig. 5 in that paper). F2 fold axes are sub-parallel and dip down-glacier at 30°, with azimuth parallel to the flow direction.
S0 continuous layering is further overwritten by small-scale (0.1–1.0 m) horizontal folding (F3) in association with S3 arcuate fractures (Fig. 8b). The axes of F3 folds are oriented parallel to the dissecting S3 arcuate fracture and dip steeply up-glacier at angles of 35–70°. Vertical displacement (a few centimetres to several decimetres) across the fracture is evidenced at a number of locations by the offset of S0 continuous layering across the S3 fracture.
4.3. Longitudinal planes (S1)
Longitudinally oriented layers of intercalated coarse bubble-rich and coarse bubble-poor ice 3–100 mm thick occur at the glacier surface below the snowline (Fig. 8c). Layering is most pronounced at the glacier margins and flow-unit boundaries, but is pervasive across the entire glacier (Fig. 3), becoming obscured close to the terminus due to the development of S3 planes and an increase in supraglacial debris cover. Longitudinal planes have an axial-planar relationship with S0 continuous layering, being consistently oriented parallel to F1 fold hinges and surface flow vectors (Reference Rees and ArnoldRees and Arnold, 2007). Longitudinal planes dip consistently between 80° and 90°, with strike oriented parallel to surface flow vectors. No longitudinal planes were observed in any of the OPTV borehole logs – unsurprisingly, given the parallel orientations of the planes and the boreholes.
4.4. Transverse fractures (S2)
S2 transverse fractures occur as both open fractures and fracture traces oriented transverse to modelled ice-flow vectors (Reference HambreyHambrey and others, 2005). Open transverse fractures were observed from aerial photography in the accumulation area, but are absent below the snowline and within borehole logs. Transverse fracture traces occur infrequently at the glacier surface below the snowline (Fig. 3). Fracture traces are assumed to be: (1) open crevasses that have since closed with transport down-glacier from the accumulation area; (2) fractures that have formed at subcritical tensional stresses (Reference SchulsonSchulson, 2001); or (3) fracture traces that were continuous with open crevasses that were formed at the ice surface but have since ablated. Fracture traces are observed within OPTV logs at depths of <30 m at both the upper drill site and the lower drill site, being more common at the upper site than the lower. Fracture traces are composed of fine bubble-rich crystals (1–3 mm in diameter) oriented normal to the fracture orientation, dissected by a central fissure. S2 fracture traces observed in OPTV logs dip between near-vertical and 60° in an up-glacier direction.
4.5. Arcuate fractures (S3)
A dense series of up-glacier-dipping S3 arcuate fractures, cross-cutting S0 continuous layering, S1 longitudinal planes and S2 transverse fractures, develops ∼1 km up-glacier of the terminus and increases in spatial frequency towards the terminus (Fig. 3). The fractures are 50–300 m long, comprised of planes of fine bubble-rich ice crystals (1–3 mm in diameter) up to 35 mm wide, interposing coarse bubble-rich ice, as evidenced by surface observations (Fig. 8a). S3 fractures dip at angles of 30–80°, becoming shallower towards the terminus. Arcuate fractures are not consistently oriented at any one point of the glacier surface, but frequently intersect at low angles (Fig. 3). S3 fractures were observed in vertical section in meltwater channels cutting across S0 continuous layering (Fig. 8a). This occasionally coincides with the folding of S0 continuous layering into hook-shaped asymmetric folds (Fig. 8b), indicating displacement along the S3 fracture plane (Reference HudlestonHudleston, 1989).
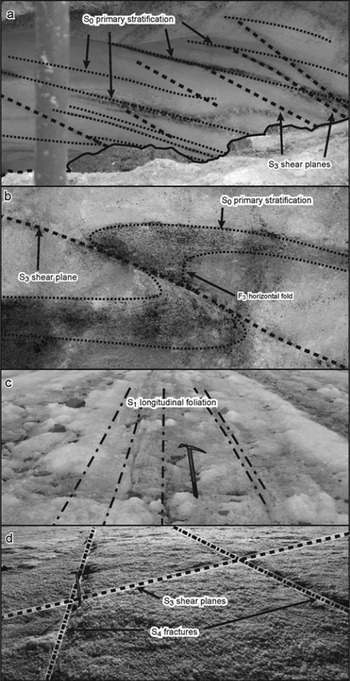
Fig. 8. Photographs taken at the glacier surface illustrating: (a) the relationship between S0 primary stratification and S3 shear planes seen in section in a meltwater channel; (b) the displacement of S0 primary stratification by a shear plane (S3) forming a small-scale (F3) horizontal fold seen in section in a meltwater channel; (c) the nature of S1 longitudinal stratification and the gradual exposure of a type-I debris ridge; and (d) the cross-cutting relationship between S3 arcuate shear planes and S4 oblique fractures.
S3 arcuate fractures were not identified within any of the borehole OPTV logs. The reason for this is unclear, although it may be because ice crystals that have undergone dynamic recrystallization in fracture planes are frequently <1 mm in diameter (Reference SchulsonSchulson, 2001). This could render them indiscernible either because they are too thin, or because the ice cannot be discriminated visually, or for both reasons.
Surface excavations along S3 fracture planes down through the ice mass with an ice axe reveal thin films of muddy debris (<1 mm thick) occurring in high concentrations along the fracture planes.
4.6. Oblique fractures (S4)
At the glacier surface, S4 closed fractures oriented obliquely to the ice margin occur ≤1 km up-glacier from the terminus (Figs 3 and 8d). The dip of these fractures, measured at the glacier surface, ranges from near vertical to 50°, with 70% of the features dipping up-glacier and ∼30% dipping down-glacier. The fractures are crystallographical ly similar to S2 transverse fractures (section 4.4). Oblique fractures are also observed at seven locations in OPTV logs (Figs 5 and 6c), in all cases dipping down-glacier at angles between 80° and 23°.
4.7. Englacial sediment layers
Intercalation of S0 continuous layering with layers of sediment-rich ice occurs in one or more instances in all six borehole OPTV logs (Fig. 6b). Englacial sediment layers dip from 9° to 71° up-glacier sub-parallel to adjacent S0 primary stratification and are observed in borehole logs from depths of 20–100 m (Fig. 6b). At the lower drill site, sediment layers are associated with the lateral folding (F1) of S0 layering into steep fold limbs, elevating englacial sediment layers into flow-parallel near-vertical planes on both sides of the fold hinge (Fig. 5b(ii)).
Sediment-rich englacial layers are composed of two distinct facies types. First, 0.001–0.1 m thick planar layers are composed of high concentrations of debris that is dominated by fines, but which also contains numerous coarser clasts (Fig. 6b). Individual debris-bearing layers are laterally continuous but either repeat or bifurcate and merge in vertical section. These grain-size characteristics, along with the facies dimensions and stratigraphy, correspond closely to laminated or stratified basal ice facies (e.g. Reference KnightKnight, 1988; Reference Hubbard and SharpHubbard and Sharp, 1995; Reference KnightKnight, 1997; Reference Waller, Hart and KnightWaller and others, 2000) as summarized by Reference Hubbard, Cook and CoulsonHubbard and others (2009). Second, layers of bubble-rich ice contain individual clasts or particle inclusions up to 700 mm in diameter, where particle long axes appear to be oriented parallel to the dip of the adjacent S0 primary stratification (Fig. 6b). Included clasts show no bedding relationships and are very angular to subrounded, occurring in isolation, or in association with sheared englacial sediment facies.
4.8. Supraglacial debris ridges
Longitudinal debris ridges composed of very angular to subangular sandy gravel occur up to 1 km up-glacier of the terminus (Fig. 3). These are ice-cored, up to 1 m high and 10 m wide, widen down-glacier and coalesce to form a near-continuous cover of supraglacial debris at the terminus. Longitudinal debris ridges are oriented parallel to ice flow and S1 longitudinal planes and have an axial-planar relationship with (F1) large-scale lateral folds. Longitudinal debris ridges can be divided into two morphological types: type-I ridges appear gradually as isolated clasts, widening down-glacier until they form a continuous cover of debris; type-II ridges originate abruptly in association with S3 arcuate fracture planes from which point they propagate down-glacier. At one location, type-II ridges are laterally continuous, forming a transverse debris stripe 50 m wide and ∼0.5 m high.
5. Interpretation
Each of the structures described above can be interpreted individually and in relation to each other within the framework of the glacier’s overall structural evolution, englacial and supraglacial sediment transport and thermal setting. However, these interpretations need to be mindful of several limitations that arise from the interpolation of two-dimensional OPTV and surface data into three dimensions. These limitations may be classified into three categories following Reference ThomasThomas (1991): (1) missing vertical structures; (2) misinterpretation of folded structures; and (3) misjudging lithological characteristics.
While supplementing surface mapping with borehole OPTV analysis undoubtedly increases the power of structural investigations, interpolation and geometrical limitations cannot be eliminated completely; each of these limitations is considered in the interpretations presented below.
5.1. Continuous layering (S0)
The composition of continuous layering (S0) is consistent with descriptions of initial snowpack formation at midre Lovénbreen (Reference Wadham and NuttallWadham and Nuttall, 2002), i.e. regularly alternating layers of low-density wet snow ice, high-density superimposed ice and discoloured fine-grained summer ice. The metamorphosis of seasonal snow layers to glacier ice forms corresponding regularly alternating seasonal glacier ice facies: (1) coarse bubble-rich crystals represent winter accumulation layers that have undergone partial melt and refreezing; (2) coarse bubble-poor crystals are a product of snowmelt refreezing at the base of the snowpack; and (3) fine bubble-rich crystals are the product of snow accumulation during the ablation season, characterized by thin strata (<100 mm) and small crystal diameter (<5 mm). The occurrence of paraconformities is consistent with the ablation of summer ice surfaces overlain by winter accumulation layers, i.e. they are erosion surfaces.
5.2. Fold structures (F1, F2, F3)
5.2.1. Large-scale lateral folds (F1)
Large-scale lateral folds (F1), observed at the glacier surface from aerial photographs and within 3-D structural visualizations of OPTV logs, are interpreted to be formed by the folding of S0 primary stratification under convergent ice flow, as ice from the glacier’s constituent cirque basins combines to form a narrow ice tongue. Reference Hambrey and GlasserHambrey and Glasser (2003) reasoned that this convergent flow is associated with high laterally compressive stresses, deforming S0 stratification into fold limbs and flow-parallel fold hinges. These authors further argued that lateral folds are most intense at flow-unit boundaries, forming isoclinal folds with near-vertical fold limbs, whereas towards the centre of flow units folding is more gentle and the dip of fold limbs is correspondingly less steep. The F1 fold revealed in cross-section by 3-D visualization of borehole data from the lower drill site (Fig. 5b(ii)) is structurally consistent with the concepts advanced by Reference Hambrey and GlasserHambrey and Glasser (2003), although in our case the fold represents the lower hinge of an isoclinal fold rather than the surface exposure of its upper hinge. Further support for this concept may be taken from the position of the flow-unit boundary ∼10 m to the west of MLB-8, where the dip of S0 stratification remains near-vertical. In contrast, the dip of S0 stratification decreases away from the flow-unit boundary towards MLB-4 and MLB-5.
5.2.2. Medium-scale horizontal folds (F2)
Horizontal folds (F2) similar to those reported herein have been observed in section at a number of glaciers, commonly associated with basal ice facies (Reference KnightKnight, 1988; Reference Sharp, Jouzel, Hubbard and LawsonSharp and others, 1994; Reference Hambrey, Lawson, Maltman, Hubbard and HambreyHambrey and Lawson, 2000). Indeed the presence of sediment-rich basal ice facies in the upper and lower limbs of F2 folds in the present study strengthens this association further. Here the orientation of the fold hinge indicates that ice located within some metres of the glacier base moves faster than that immediately overlying it. The formation of this medium-scale horizontal fold (F2) is therefore interpreted to be the result of the rotation of S0 primary stratification across a narrow zone (-5–10 m) of vertical velocity change established between slower-moving ice overlying faster-moving ice. Zones of slower-moving ice overlying zones of more rapidly moving ice have been identified in a number of borehole studies of ice deformation (e.g. Reference Harper, Humphrey and PfefferHarper and others, 1998; Reference Chandler, Hubbard, Hubbard, Murray and RippinChandler and others, 2008). Enhanced flow of the lower zone may be accounted for by the presence of a local slippery spot, for example caused by a subglacial drainage conduit (Reference Willis, Mair, Hubbard, Nienow, Fischer and HubbardWillis and others, 2003) or by ice flow within a deep bed undulation (Reference GudmundssonGudmundsson, 1997). However, geophysical data collected by Reference King, Smith, Murray and StuartKing and others (2008) identified that ice at the lower drill site is frozen to the bed and that subglacial drainage is either poorly developed or absent from the area, effectively excluding the former mechanism. Reference GudmundssonGudmundsson’s (1997) model of ice flow over a sinusoidal bed predicts accelerated flow over the crest and trough of the sinusoid on the basis of heterogeneous basal shear stress distributions across the asperity. The lateral extent of the fold layer we measured at midre Lovénbreen is unknown; however, the restriction of fold F2 to observations in MLB-4 suggests that it is most likely caused by the presence of a bedrock asperity at the metre to decimetre scale. Alternatively, the fold structure may be a relict, being inherited from a period when the glacier was more extensive and predominantly warm-based, with a well-developed subglacial drainage network (Reference LiestølLiestøl, 1988).
5.2.3. Small-scale horizontal folds (F3)
Small-scale horizontal folds (F3) are interpreted as having formed by vertical displacement of S0 stratification, indicated by the offset of the hook-shaped folds across S3 fractures (Fig. 8b). These structures are indicative of simple shear under compressive stress (Reference HudlestonHudleston, 1989) and are discussed in the context of S3 arcuate fractures (section 5.5).
5.3. Longitudinal planes (S1)
S1 longitudinal planes are interpreted as foliation on the basis of: (1) their orientation parallel to surface ice-flow vectors and F1 fold axes (Reference Rees and ArnoldRees and Arnold, 2007); and (2) the small size of their constituent ice crystals relative to adjacent coarse-grained bubble-rich ice, indicative of dynamic recrystallization under simple shear (C. Wilson and B. Marmo, http://web.earthsci.unimelb.edu.au/wilson/ice1. Two alternative mechanisms have been proposed for the formation of foliation in glacier ice: (1) from the deformation of pre-existing inhomogeneities, i.e. primary stratification or crevasses, under laterally compressive and longitudinally tensile stresses (Reference Hooke and HudlestonHooke and Hudleston, 1978, Reference Hooke and Hudleston1980; Reference Hambrey, Lawson, Maltman, Hubbard and HambreyHambrey and Lawson, 2000); and (2) from the dynamic recrystallization of ice crystals parallel to the maximum strain-rate tensor (C. Wilson and B. Marmo, http://web.earthsci.unimelb.edu.au/wilson/ice1. We consider the latter mechanism to be more important at midre Lovénbreen because S1 planes are observed to cut across S0 primary stratification at the surface and there is no reason to believe that this is not the case at depth. Although S1 foliation was not observed at depth in our OPTV logs, this has little bearing on the existence of S1 at depth because the chance of (subvertical) boreholes intercepting these (subvertical) planes is minor.
5.4. Transverse fractures (S2)
The absence of open fractures below the snowline indicates that strain rates in the main trunk of midre Lovénbreen are well below the critical threshold for active crevasse formation (Reference Weiss and SchulsonWeiss and Schulson, 2000). Fracture traces occurring at, or close to, the surface are therefore inferred to reflect former flow conditions when ice extent and velocities were much greater, probably during the Little Ice Age, a period when some researchers have suggested that the glacier was underlain by more extensive warm-based ice (Reference HambreyHambrey and others, 2005) and may even have undergone episodic surging (Reference LiestølLiestøl, 1988; Reference Hagen, Liestøl, Roland and JørgensenHagen and others, 1993).
5.5. Arcuate fractures (S3)
S3 arcuate fractures are interpreted as shear planes on the basis that: (1) they cut across S0 primary stratification at low angles, resulting in the formation of hook-shaped asymmetric F3 horizontal folds (Fig. 8b) indicative of vertical displacement along the plane (Reference HudlestonHudleston, 1989); (2) they are composed of fine-grained bubble-rich ice, indicative of dynamic recrystallization (C. Wilson and B. Marmo, http://web.earthsci.unimelb.edu.au/wilson/ice1; and (3) the vertical displacement of up-glacier ice units relative to down-glacier ice units indicates that the ice is subject to high compressive stresses parallel to the ice-flow vector (Reference SouchezSouchez, 1967; Reference Rees and ArnoldRees and Arnold, 2007). Structurally, S3 shear planes are similar to arcuate fractures identified in the terminal zone of other valley glaciers (Reference Hambrey, Dowdeswell, Murray and PorterHambrey and others, 1996; Reference Glasser, Hambrey, Crawford, Bennett and HuddartGlasser and others, 1998, Reference Glasser, Hambrey, Etienne, Jansson and Pettersson2003; Reference RobersonRoberson, 2008), where it has frequently been suggested that compressive brittle failure is facilitated by pre-existing structural weaknesses, for example strongly anisotropic crystal fabrics or rotated fractures (Reference NyeNye, 1952; Reference Weiss and SchulsonWeiss and Schulson, 2000).
However, at midre Lovénbreen the low density of S2 open fractures and fracture traces indicates that S3 shear planes form as an entirely new generation of structures. The compressive stresses required to initiate arcuate shear-plane development are probably caused by the transition between warm-based ice in the main trunk of the glacier and cold-based ice at the glacier terminus and margins (Reference RippinRippin and others, 2003; Reference King, Smith, Murray and StuartKing and others, 2008). The reduction in flow velocity between the two basal regimes leads to high longitudinally compressive stresses, forcing ice up-glacier to override obstructing down-glacier ice, resulting in the vertical offset of S0 stratification across the shear plane (Reference SouchezSouchez, 1967).
5.6. Oblique fractures (S4)
S4 oblique fractures are frequently observed near the lateral margins of ice masses, caused by friction-induced stresses at the ice–bed interface (Reference NyeNye, 1952). Surface observations of S4 oblique fractures have only reported up-glacier-dipping fractures. However, down-glacier-dipping S4 oblique fractures observed in OPTV borehole logs have not been reported in the literature, either at the surface or within an ice mass. Reference NyeNye’s (1952) model of fracture formation does predict slip-line fields under extending flow (see fig. 6 in Reference NyeNye, 1952), which form parallel to the maximum strain-rate tensor and dip down-glacier at depth. Until now it has been very difficult to observe these fractures. The geometry of the glacier indicates that such fractures are most likely to form in the accumulation area where ice flows over steep bedrock. Basal strain rates at midre Lovénbreen modelled by Reference HambreyHambrey and others (2005) indicate that englacial or basal fractures will not form under current stress conditions, according to the parameters outlined by Reference Van der VeenVan der Veen (1998). Previous studies have hypothesized that transverse surface crevasses and proglacial landform assemblages are indicative of former wet-based conditions during the Little Ice Age when the flow of the glacier was considerably faster than today. Correspondingly higher strain rates during a more active phase could therefore account for the formation of down-glacier-dipping englacial fractures observed within OPTV logs.
5.7. Englacial sediment layers
The intercalation of sediment layers within S0 primary stratification can be reasonably accounted for by at least two processes: (1) incorporation of rockfall debris synchronously with the accumulation of snow on a glacier surface; and (2) entrainment of debris at the glacier bed (probably via regelation and/or freeze-on), coupled with advection through the ice mass by shearing and folding. The former mechanism is invoked to account for sediment layers observed at 115 m a.s.l. at the upper drill site (Fig. 5a) where very angular to subangular gravel- to cobble-sized particles oriented parallel to the dip of primary stratification are indicative of high-level transport through the ice mass (Reference BoultonBoulton, 1978; Reference Owen, Derbyshire and ScottOwen and others, 2003). In contrast, the similarity in grain-size characteristics, shear-structures and dimensions of sediment-rich englacial layers observed deeper in the OPTV logs at the lower drill site (Fig. 6b) with basal ice facies described by several authors beneath a range of ice masses (Reference KnightKnight, 1988, Reference Knight1997; Reference Hubbard and SharpHubbard and Sharp, 1995; Reference Waller, Hart and KnightWaller and others, 2000) supports the interpretation that these are formed at the bed by regelation and/or the freeze-on of subglacial sediment. This interpretation is supported by the presence of large-scale vertically oriented F1 fold structures close to the bed and up-glacier-dipping arcuate shear planes (S3), which have frequently been invoked to account for the advection of sediment through an ice mass (Reference SouchezSouchez, 1967; Reference HudlestonHudleston, 1977; Reference Hambrey, Lawson, Maltman, Hubbard and HambreyHambrey and Lawson, 2000). The occurrence of isolated pebble- to cobble-sized clasts in association with sheared englacial sediment layers provides evidence that the process of debris incorporation involved may also be responsible for entraining larger particles into the ice mass.
5.8. Supraglacial debris ridges
The sedimentology of type-I longitudinal debris ridges and their geometrical relationship with other units point to an interpretation as englacial sediment layers intercalated within S0 primary stratification that has been elevated into flow-parallel ridges by F1 lateral folding under convergent flow. This interpretation builds on the conceptual model advanced by Reference Hambrey and GlasserHambrey and Glasser (2003) by providing direct evidence of these sediment layers in an englacial position, intermediate between their basal source and the glacier surface where they have been reported as similar to laminated basal ice facies (Reference Hubbard and SharpHubbard and Sharp, 1995; Reference KnightKnight, 1997). 3-D reconstructions of internal glacier structure, based on the interpolation of structural data from multiple OPTV logs, indicate that these basally derived englacial sediment layers are elevated into flow-parallel subvertical planes around a fold axis by large-scale lateral folding (F1) (Fig. 5b(ii)). The proximity of the fold limbs to a flow-unit boundary and a large type-I longitudinal debris ridge strongly suggests that the fold axis is the lower hinge of an isoclinal fold exposed at the ice surface. Contributions to this large (∼1 km long) supraglacial longitudinal debris stripe by rockfall from a headwall spur are clearly also significant; however, OPTV data provide evidence that subglacially derived sediment layers also supply a major proportion of the sediment input. Concurrently, smaller longitudinal debris ridges (50–100 m long) occurring towards the centre of flow units (Fig. 3) are inferred to receive a proportionately higher contribution to their mass from basally derived englacial sediments and a proportionately lower contribution from rockfall -derived sediments.
The formation of type-II longitudinal debris ridges, which appear abruptly at the glacier surface in association with S3 shear planes, is interpreted to be the result of sequential deformation of large-scale F1 flow-parallel fold hinges by small-scale F3 horizontal folds (Fig. 9). We envisage that englacial sediments are folded laterally into large-scale F1 fold hinges under convergent ice flow, similar to the formation of type-I debris ridges, but rather than the fold hinges being gradually exposed (as is the case for type-I ridges), they are cross-cut by S3 shear planes and incorporated into F3 horizontal folds. Vertical displacement across S3 shear planes then concentrates the already folded englacial sediment into a tight horizontal fold, aligned parallel to the dip of the associated S3 shear planes, with which they appear explicitly associated when exposed at the ice surface.
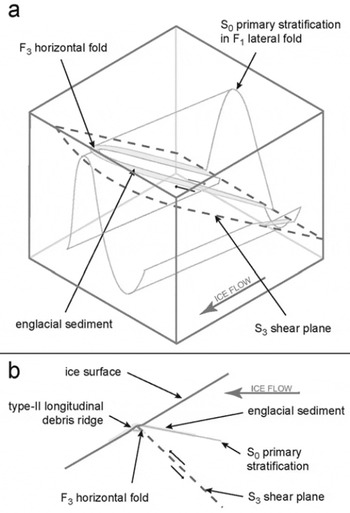
Fig. 9. A schematic illustration of the deformation of an F1 fold hinge by an F3 fold in association with an S3 arcuate shear plane: (a) a 3-D orthographic view within the ice mass and (b) in cross-section outcropping at the glacier surface to form a type-II longitudinal debris ridge.
6. Discussion
The data and interpretations presented above raise several points for further discussion.
6.1. Type-I longitudinal supraglacial debris ridges
A large body of research has provided evidence that longitudinal supraglacial debris ridges, frequently observed at polythermal glaciers and at Svalbard glaciers in particular (Reference Hambrey and GlasserHambrey and Glasser, 2003; Reference Hubbard, Glasser, Hambrey and EtienneHubbard and others, 2004), include a major component of basally derived sediment. Empirical evidence for this includes particle morphology, grain-size distribution, isotopic composition of ice facies and relationships between glacier structure and ice crystallography (Reference Bennett, Huddart, Hambrey and GhienneBennett and others, 1996; Reference Hambrey, Bennett, Dowdeswell, Glasser and HuddartHambrey and others, 1999, Reference Hambrey2005; Reference Hubbard, Glasser, Hambrey and EtienneHubbard and others, 2004).
In this study we identify shear structures in englacial sediment layers intercalated within S0 primary stratification that are physically similar to laminated or solid basal ice facies described by Reference Hubbard and SharpHubbard and Sharp (1995) in the western Alps and by Reference KnightKnight (1997) in Greenland. 3-D visualizations of internal glacier structure, based on data interpolation between borehole arrays (Fig. 5), provide evidence that basally derived englacial sediment layers are incorporated into large-scale lateral folds (F1) and elevated into fold limbs. These fold limbs have a near-vertical dip proximal to flow-unit boundaries and a more gentle dip distal from flow-unit boundaries. Reference Hambrey and GlasserHambrey and Glasser’s (2003) model of longitudinal debris-ridge formation proposes that debris stripes exposed at the surface of flow-unit boundaries are flow-parallel isoclinal fold hinges. In contrast, Reference Woodward, Murray and McCaigWoodward and others (2002) envisaged that supraglacial longitudinal debris ridges might be formed by the reorientation of basal crevasse-fill sediments that have deformed under high cumulative strain following successive surge events. While it has been demonstrated that crevasse fills may become progressively rotated into a flow-parallel orientation under steady-state flow conditions (Reference Hubbard, Hubbard, Maltman, Hubbard and HambreyHubbard and Hubbard, 2000), the low density of surface crevasses at midre Lovénbreen suggests that this process is unlikely to account for the volume of material observed in longitudinal supraglacial debris stripes at the glacier. Furthermore basal crevassing is unlikely to occur at midre Lovénbreen as the physical conditions for deep crevasse formation require high basal water pressures and high strain rates at the bed (Reference Van der VeenVan der Veen, 1998). In contrast to nearby Kongsvegen, which terminates in water and is thought to have undergone episodic surging (Reference Woodward, Murray and McCaigWoodward and others, 2002), these conditions are not met and are unlikely to have been met in the recent past at midre Lovénbreen (Reference HambreyHambrey and others, 2005; Reference Irvine-FynnIrvine-Fynn and others, 2005).
The relationship between large-scale lateral folding, as revealed by 3-D OPTV visualizations (Fig. 5b(ii)), and supraglacial longitudinal debris ridges at the surface of midre Lovénbreen is consistent with the interpretation that the folding is the lower hinge of an isoclinal fold formed by high laterally compressive stresses at the flow-unit boundary under convergent ice flow. OPTV logs also provide evidence that large-scale lateral folding is responsible for the elevation of coarse pebble- to cobble-sized clasts, inferred to be of subglacial origin by their close association with sheared englacial sediment layers.
6.2. Type-II longitudinal supraglacial debris ridges
The association between S3 shear planes and thin (<1 mm) films of muddy debris observed in section (section 4.5) is at odds with the geometric relationship between S3 shear planes and type-II longitudinal debris stripes observed at the ice surface at midre Lovénbreen (section 4.8). The textural composition of type-II longitudinal debris ridges (i.e. sandy gravel) is incompatible with the advection of well-sorted muddy debris along S3 shear planes. Small-scale horizontal folding (F3) in S0 primary stratification, associated with vertical displacements across S3 shear planes, is invoked to account for the surface morphology of type-II longitudinal debris ridges in this study (Fig. 9). It is proposed that englacial sediment layers deformed into flow-parallel fold hinges by large-scale lateral folding (F1) are subsequently intersected by S3 shear planes and folded again into small-scale horizontal folds (F3). This deformation sequence is envisaged to concentrate englacial sediment into a shearplane-parallel fold axis. As the F3 fold hinge outcrops at the ice surface, the englacial sediment appears abruptly in association with the S3 shear plane (Fig. 9b), thus obscuring the relationship that the debris ridge has with large-scale F1 folding and S0 stratification. This mechanism is suggested tentatively, as conclusive empirical evidence of this structural relationship is lacking. The proposed mechanism implies that folding of an existing type-I debris ridge could transpose it into a type-II debris ridge, while, conversely, continued meltout of a type-II debris ridge might lead to its reclassification as a type-I debris ridge. Therefore, this hypothesis could be tested easily by comparisons between time-series aerial photographs or by time-lapse photography of the glacier.
6.3. Geometric relationships between glacier morphology and structural analysis
Surface mapping of glacier structures is heavily influenced by the nature of the ice surface texture and the geometric relationship between the orientation of the ice surface and the structures being mapped. This problem is highlighted by Reference Woodward, Murray and McCaigWoodward and others’ (2002) critique of Reference Glasser, Hambrey, Crawford, Bennett and HuddartGlasser and others’ (1998) proposed mechanism of longitudinal debris-ridge formation by large-scale lateral folding. Reference Woodward, Murray and McCaigWoodward and others (2002) discounted Reference Glasser, Hambrey, Crawford, Bennett and HuddartGlasser and others’ (1998) folding mechanism on the basis of observations of unfolded stratification exposed in the terminal ice-cliff face at nearby (surge-type and tidewater) Kongsvegen. Reference Woodward, Murray and McCaigWoodward and others (2002) expressed considerable uncertainty about the interpretations of Reference Glasser, Hambrey, Crawford, Bennett and HuddartGlasser and others (1998) on the basis of the geometric relationships between the observed ice surface and the structures in question. 3-D reconstructions of internal glacier structure (Fig. 5) reveal that the orientation of S0 primary stratification is highly variable at scales ranging from metres to hundreds of metres. Mapping of these structures on an irregular sloping ice surface or at an ice cliff are likely to result in observational difficulties. This work demonstrates that 3-D structures are easier to conceptualize, and hence interpret, using on-screen 3-D visualization techniques, rather than in 2-D cross-sections. Furthermore, cross-sections taken through our 3-D reconstructions (Fig. 5) are presented both orthogonal and parallel to surface flow vectors (Reference Rees and ArnoldRees and Arnold, 2007) in an attempt to reduce interpretational ambiguity.
6.4. Limitations of OPTV-based structural analyses in ice boreholes
A specific set of problems, some restricted to ice masses and some more widely relevant, are encountered when applying an OPTV system to logging boreholes in a glacier. These are presented and discussed below with reference to the interpretations made above.
Firstly, a general problem encountered is the largely monomineralic composition of ice. It is possible to identify both fractures and foliation from OPTV logs in rock boreholes, primarily because they are commonly characterized by contrasting minerals (Reference Williams and JohnsonWilliams and Johnson, 2004; Reference Spillmann, Maurer, Willenberg, Evans, Heincke and GreenSpillmann and others, 2007). Correlations between strata in solid rock boreholes are also frequently facilitated by being able to trace specific marker horizons. Such marker horizons are largely absent from ice masses, which are best regarded as single sedimentary units undergoing low-grade metamorphism. The lack of distinct boundaries was addressed in this study when interpolating S0 primary stratification between borehole logs, by treating each layer identified as a Lagrangian vector rather than as a lithological unit with specific characteristics.
Secondly, it is in the nature of vertically oriented boreholes to systematically miss vertically oriented structures. This limitation potentially could be addressed by use of an inclined borehole, although this might fail to produce a dramatically higher level of fracture detection. The failure of OPTV logs to detect either S1 foliation, S2 fractures or S3 fractures in ice may be related to the role of differential erosion associated with surface rotting, which does not occur at depth. Alternatively, it may be that ice that has undergone dynamic recrystallization in fracture and foliation planes is undetectable in OPTV logs, because of the 1 mm vertical resolution of the OPTV and the small size of the ice crystals involved (Reference SchulsonSchulson, 2001). Therefore, more sensitive perhaps spectrally based procedures for feature discrimination may need to be developed for OPTV adaptation to ice-based investigations.
Thirdly, the inability to detect fractures in ice boreholes is likely to result in an oversimplified interpolation of strata between boreholes that otherwise may be offset across fractures. It is suggested that S2 fractures at midre Lovénbreen are unlikely to result in marked offset across S0 primary stratification, firstly because they are vertically dipping and form under tensile stress normal to the direction of flow, and secondly because relatively few are identified on the glacier surface. Observations of S0 primary stratification offset across S3 arcuate shear planes demonstrate that S0 interpolation is oversimplified at midre Lovénbreen. Despite these limitations, it is clear from individual OPTV logs (e.g. MLB-4 and MLB-7; Fig. 5b(ii)) that offsets in S0 primary stratification, caused by both F1 large-scale and F2 medium-scale folds, can be detected due to the high vertical resolution of the technique.
7. Conclusions
The use of OPTV in multiple boreholes has been successful in allowing the internal structure of two regions of the frontal zone of midre Lovénbreen to be logged in Cartesian space with geometric accuracy. Interpolation between individual borehole logs has also allowed several distinctive englacial structures to be visualized in three dimensions. Combining measurements from OPTV logs with surface mapping reveals the visual and geometrical characteristics of numerous structural elements. We therefore conclude that (hotwater-drilled) borehole OPTV analysis can yield significant new evidence relating to the 3-D internal structure of glaciers, particularly when combined with surface mapping. Our study at midre Lovénbreen has resulted in several novel findings, including:
The identification of eight structural elements: (1) S0 primary stratification, (2) S1 longitudinal foliation, (3) S2 transverse fracture traces, (4) S3 arcuate shear planes, (5) S4 oblique fractures, (6) F1 large-scale lateral folds, (7) F2 medium-scale horizontal folds and (8) F3 small-scale horizontal folds. S4 oblique fractures, predicted by Reference NyeNye (1952), are identified empirically here for the first time.
The differentiation and hypothesized formation of two texturally similar longitudinal debris-ridge morphologies: type-I ridges appear gradually at the ice surface in association with large-scale lateral folds (F1), while (newly recognized) type-II ridges appear more abruptly in association with S3 arcuate shear planes and small-scale horizontal folds (F3).
The visualization of debris-rich basal ice elevated into an englacial position. The visual characteristics of englacial sediment layers identified within our OPTV logs are consistent with laminated and solid basal ice facies described by Reference Hubbard and SharpHubbard and Sharp (1995). 3-D visualization of internal glacier structure, based on the inter-borehole interpolation of OPTV logs, reveals that these englacial sediment layers are incorporated into large-scale F1 lateral folds and elevated into near-vertical planes in association with lateral compressive stress and type-I longitudinal debris-ridge formation, consistent with the structural model of Reference HambreyHambrey and others (2005).
Despite these successes, the application of borehole OPTV to reconstructing the 3-D structure of ice masses is still limited by: (1) difficulties in intersecting and imaging borehole-parallel structures; (2) the requirement for inter-borehole spatial interpolation; and (3) imaging layers the constituent crystals of which are either difficult to distinguish visually or are too thin to be identified at a resolution of ∼1 mm. All three of these issues represent challenges that require addressing by continuing technique development.
Acknowledgements
We thank B. Valle, N. Cox, J. Kohler and H. Coulson for logistical assistance. The comments of D. Rippin, D. Evans, D. Huddart and an anonymous reviewer have helped greatly in improving the quality of this work. This work was funded by the UK Natural Environment Research Council (grant NER/S/A/2006/14079).


