


Introduction
Ice masses cover about 153 000 km2 of the north-eastern Canadian Arctic. The southernmost occur as small cirque glaciers in the Torngat Mountains (Reference ForbesForbes, 1938) at about lat. 60°N. Baffin Island is moderately glacierized (Fig. 1), as are the islands farther north. Inventories of the ice bodies in north-eastern Arctic Canada were first undertaken by the American Geographical Society (1958) based on the then existing maps and air photographs. A more detailed treatment involving the utilization of historical records, written and photographic, was reported by Reference FalconerFalconer (1962) for northern Baffin Island and this work has since been extended and developed by the Glaciology Subdivision of the Inland Waters Branch. Department of Energy, Mines and Resources, Ottawa (personal communication in 1969 from C. S. L. Cmmaney) as a part of the International Hydrological Decade program to obtain a complete inventory of the world's glaciers.

Fig. 1. Contours of maximum summit elevations and maximum relative relief for the area between Home Bay in the north and Cumberland Penimida in the south. Inset map shows the distribution of ice masses in Baffin Island and location of weather stations 1 Dewar Lakes, 2 Cape Hooper, 3 Broughton Island, 4 Cape Dyer, 5 Frobisher.
It was not until the 1950 expedition of the Arctic Institute of North America to the Barnes Ice Cap (Reference Baird and BairdBaird, 1950) that any of these sub-polar and polar ice masses were examined. The growth of glaciological studies since that date has been slow, largely as a result of the logistical problems involved. Continuing glaciological programs presently operate on Axel Heiberg Island, Ellesmere Island and Devon Island, while on Baffin Island the Barnes Ice Cap and Decade Glacier (Reference SagarSagar, 1966; Reference østrem, Østrem, Bridge and RannieØstrem and others, 1967) are being studied. Thus out of a total glacier population of > 1,000, less than 10 are under systematic observation. Basic questions concerning the representativeness of these ice bodies in terms of classifactory type, topographic milieu and meteorological regime can only be answered in the most general way.
This paper presents an analysis and interpretation of the present and past glacier (sensu lato) distribution in two contrasting sections of the east coast of Baffin Island. The first region. Home Bay (Fig. 1) was selected because of field experience in the area and knowledge of its past history (Reference Andrews, Andrews, Buckley and EnglandAndrews and others, 1970). The area of Okoa Bay (Fig. 1 ) was chosen because of its proximity to Home Bay and in part because a research program of the Institute of Arctic and Alpine Research is being developed there. The names Home Bay and Okoa Bay as used hereafter refer to the areas of the 1: 250 000 Canadian topographic maps (Figs. 2 and 3), not the actual sea areas.
We shall consider first the broad topographic and climatic factors that determine the present glacierization of the two areas. This theme reflects a two-fold interest; the desire to gather information on the controls of present ice distribution, and the application of the results to palaeoclimatic interpretations of evidence of past glaciation.
Topography of Home Bay and Okoa Bay
The areas under study both lie within the fiord and dissected plateau rim of eastern Baffin Island, but they differ considerably in detail (Figs. 2 and 3). Figure 1 shows the generalized form of the summit surface and maximum relative relief over the Cumberland Peninsula. The map was constructed as follows: a grid with sides of 20 km was superimposed on the 1: 250 000 topographic maps (about 200 squares) and the maximum elevation and relative relief were noted in the center of each alternate square. This resulted in two data sets of 100 individuals. The trends shown on Figure 1 were obtained by contouring. This procedure could result in a maximum locational error of up to 14 km between the actual location of a maximum and its plotted position. Figure 1 shows that Home Bay Footnote * lies along a saddle in the eastern mountains. Maximum elevations range from 600 m to 1 000 m within the saddle.

Fig. 2. Distribution of ice masses in Home Bay based on the Canadian National Topographic 1: 250 000 maps. Linear trend surfaces for the Nudlung (lower right) and Ekalugad (top) map areas are shown (see Table V).

Fig. 3. Distribution of ice masses in Okoa Bay based on the Canadian National Topographic 1: 250 000 map. Linear trend surfaces are shown (see Table IV).
In contrast maximum elevations over the Okoa Bay area vary between 800 m and 1 600 m, and reach 2 000 m just north of Cumberland Sound. Elevations of summit surfaces slope off from this high in all directions although the gentlest slope, of about 1: 100, is clearly that down to the south-west from the height of land. In coastal areas the lines of equal relative relief are parallel to the surface elevation contours but inland from the fiord heads they diverge. Maximum relief is only about 300 m over much of the inland plateau.
Figures 2 and 3, showing the distribution of ice masses in the two study areas, have been taken directly from the new 1: 250 000 topographic series. Home Bay is covered by map numbers 27A and 27B and Okoa Bay by 26P (Canadian National Topographic System). It is evident that much of the glacierization of Home Bay is in the form of mountain ice fields, a reflection of the broad massive mountain topography, whereas by far the most predominant glacier form in Okoa Bay is the small cirque glacier, a consequence and cause of the alpine topography. These factors are discussed in more detail below. Figures 4 and 5 illustrate the contrasting character of the two areas and their glacierization.

Fig. 4. Vertical air photograph (A-12012-79, National Air Photo Library, Canada) showing small cirque glaciers lying between Narpaing Fiord and Okoa Bay. The arrow points to a typical example of the extensive cirque moraines formed at as yet unknown date. Maximum elevation on peak with cross is about 1 ooo m a.s.l.
Pleistocene and Recent glacial histories
Knowledge of the Pleistocene and Recent glacial history is necessary to set our study in a time perspective. Adequate factual knowledge is available for the Home Bay area (Reference Andrews, Andrews, Buckley and EnglandAndrews and others, 1970), but little is known about events in Okoa Bay. However, detailed photo-reconnaissance has been carried out and limited surveys have been undertaken by Andrews, and J. H. England and A. H. Kryger (personal communication in 1968).
Home Bay
Hypothetical glacier profiles, based on the assumption that the ice was grounded at the edge of the continental shelf, strongly suggest that the mountains around Nudlung Fiord were not overrun by the fiord glaciers (Mt Viewforth rises to 1 550 m a.s.l.). Farther inland, however, the mountains attain elevations of about 900 m a.s.l. and were overridden at some stage by the Laurentide ice sheet.
The outer coast emerged from the retreating glaciers about 10 000 years ago (Reference Andrews, Andrews, Buckley and EnglandAndrews and Others, 1970; Reference Bryson, Bryson, Wendland, Ives and AndrewsBryson and others, 1969). Retreat thereafter was relatively slow (<27m year-1) and there is good evidence that some glaciers from the inland ice sheet were still in contact with the sea about 4 300 years ago (Reference AndrewsAndrews, 1969). It is concluded from field work in the Home Bay area that the fiord-glacier phase and the present mountain-ice-field phase were chronologically distinct. No evidence has been found to suggest the contemporaneity of the mountain and fiord glaciers. This may have been the general pattern through much of east Baffin Island. On the other hand, Reference KingKing (1969) presents evidence for a local ice center during the maximum of the last glaciation in the high land between Itirbilung and McBeth Fiords immediately to the north. This inter-fiord areas is much higher and is morphologically more alpine than Home Bay (see Figs. 4 and 5).

Fig. 5. Oblique air photograph (T 320L-185, National Air Photo Library, Canada) of mountain-top ice caps al the head of Ekalugad Fiord in inner Home Bay. In the left foreground a glacier from the ice cap cross-cuts the main north lateral moraine of the Ekalugad Phase dated about 8 000 B.P. Immediately to the left again the moraine spanning the fiord il dated at c. 6 100 B.P. Maximum elevation about 1 000 m a.s.l.
Reference Andrews, Andrews, Buckley and EnglandAndrews and others (1970) have suggested that a major geologic/climate boundary for east Baffin Island can be placed in the interval between the final breakup of the Baffin Island ice sheet ( <4 000 B.P.) and the expansion or re-expansion of the mountain ice fields and glaciers. This event is tentatively considered to be correlative with the re-advance of the Barnes Ice Cap about 2 800 years ago (Reference Andrews and WebberAndrews and Webber, 1964). Reference HarrisonHarrison (1964, Reference Harrison1966) presents evidence for correlative responses of mountain glaciers in the eastern mountains. The glaciers and ice fields experienced a period of retreat but then re-advanced to the line of the Recent terminal moraines within the last 400 years. In most cases this re-advance was greater than the sub-Atlantic re-advance. The ice masses and snow-beds that we are discussing are in part due to climatic changes several centuries old. No glaciological investigations have been carried out on any ice body within the Home Bay area. From incidental observations it is thought that the equilibrium line in any year is lower than in the mountains to the north.
Okoa Bay
Investigations of the late- and post-glacial history of the area are just beginning; only one radiocarbon date is available supplemented by a limited lichenometric survey. Air-photography interpretation suggests that during the maximum of the last glaciation, large fiord glaciers flowed toward the continental shelf. In one or two sheltered localities along the outer coast there are high cliffs of inconsolidated materials. These formations may be equivalent to those described by Reference LøkenLøken (1966) farther north and if this is the case they must date from >54000 B.P. The physical appearance of the mountains opposite Broughton Island suggests that they were not covered by actively moving ice at the maximum of the last glaciation. Marine shells from sandy gravel above the Hudson Bay Company store on Broughton Island have been dated at
 . If this date is reliable it provides a maximum age for the last ice advance, although any subsequent contamination would mean that the advance was considerably older than this minimum age. The retreat of the glaciers from the fiord heads was followed at a later, and presently unknown date, by the advance of a large number of cirque glaciers. Whereas the present distribution of cirque glaciers is fairly restricted (see below), this advance involved south-facing cirque glaciers in situations where glacier ice no longer exists. With our present knowledge, the age of these local glacier moraines must be placed at either 8 000 years old (= Cockburn Phase of Reference Falconer, Falconer, Ives, Løken and AndrewsFalconer, and others, 1965), or 6 700 years old (= Isortoq Phase, Reference AndrewsAndrews, 1966), or about 4 700 years old (= Flint Phase, paper by J. T. Andrews in preparation). Measurements by A. Kryger of lichen diameters on the Recent moraines of a small cirque glacier at the head of Quajon, Narpaing Fiords indicate that the outermost moraine may date from about A.D. 1200, whereas the inner moraines appear to have an age of 300 years or less.
No glaciological work has been carried out in the Okoa Bay area, although Reference Ward and BairdWard and Baird (1954) calculated that in 1953 the equilibrium line on the Penny Ice Cap was at 1580 m a.s.l.
Methodology and the Inventory
Various ice and snow masses and cirques were identified from air photographs at a scale of 1: 60 000 and were then located on topographic maps at 1: 125 000 (the “blue line” prints for the 1: 250 000 National Topographic Series). Each feature was given a 6 digit location number based on a 12.5 km x 12.5 km grid system arbitrarily superimposed on the map sheets. Air-photograph quality was mostly excellent.
Tables I and II illustrate the type of information that was abstracted- Areas > 1 km2 were measured by a rolling planimeter and for smaller areas the “square-counting” method was used. Measurement errors are not easy to compute: however, our estimates are: (a) orientations ±5°, (b) lengths, ±50 m, (c) elevations, ±15 m for Home Bay and ±50 m for Okoa Bay, and (d) area, ±5%.
Definitions
An early source of difficulty was the nomenclature to be employed. The following definitions were adopted based on Reference AhlmannAhlmann (1948), the American Geographical Society (1958) and the American Geological Institute (1957). It should be noted that the analysis was carried out mainly during 1966-67, prior to any recommendations being made by the I.H.D. Committee for glacier inventories.
Table I Example of glacial inventory on ice and snow masses

Table II. Example of inventory on cirques

-
1 Snow-patch (synonym = snow-bed): small, permanent area of snow and ice. Often accumulates in the lee of relief irregularities. Generally about 0.1 km2.
-
2 Ice patch: small independent area of ice showing no signs of movement. Located in a variety of positions and generally <2.o km2.
-
3 Glacier: individual tongue or lobe of ice showing movement.
-
4 Ice field: continuous area of ice and snow, of lesser extent and on land of greater relief than an ice cap. Generally <10.0km2. (Ahlmann calls this a highland glacier or transection glacier.)
-
5 Ice cap: ice and snow covering a large section of land of moderate relief. Generally >10.0 km2 and moving out in all directions from the central area (Ahlmann calls this a glacier cap).
General comparison of the glacierization of the two areas
A valid comparison of the extent of glacierization in the two study areas must take into account differences in size of the two areas. Figure 2 includes an area of 13 X 103 km2 of which 63% is land. The Okoa Bay area (Fig. 3) in contrast covers only 4.7 X 10³ km2 of which 71% is land. A fuller set of statistics is given as Table III. The most significant figures are those that express the area of ice as a per cent of the land area and, more particularly, the area of ice as a per cent of the area of land higher than 600 m a.s.l. In the first case the ratio between Home Bay and Okoa Bay is 12: 1, and in the second 4:1. The comparison of ice coverage with respect to high ground most clearly demonstrates the contrast in glacierization of the two areas. This point is discussed further below.
Figure 6 presents frequency histograms of ice types. Ice patches are of approximately equal numbers in both areas although their topographic location is somewhat different. In Home Bay they occur as thin patches on, or on the side of, mountain summits, whereas in Okoa Bay they occur more characteristically in cirques. Individual glaciers originating from cirques are virtually absent froin Home Bay whereas in Okoa Bay they represent the major ice types. In contrast Home Bay has many more ice fields, both in area and number. These are mainly located in the south-east (Nudlung map) area of Figure 2. Both the degree of dissection and the summit elevations decline westward in Home Bay and the large ice masses in the north-west area of Figure 2 are categorized as ice caps, a type that is not found in Okoa Bay.
Table III. Home bay

A commentary on these data is appropriate at this point. Okoa Bay has higher mountains and a greater relative area above 600 m a.s.l. than Home Bay and yet the glacierization of Okoa Bay is mainly confined to cirque glaciers, suggesting the importance of local “snow-fence” effects for collecting snow in topographic hollows. Thus although elevation is important in Home Bay, the topographic effects on snow distribution are much less evident than in Okoa Bay.
Importance of summit elevations and area above 600 m for glacierization
The various association between summit elevation, area of ice, area of land above 600 m, etc. are of interest. Figures 7 and 8 illustrate graphs of these relationships. The rationale for choosing the 600 m level was the realization that the elevation appeared as a critical lower limit to the occurrence of ice caps within Home Bay. Subjective study of the data pointed to the interrelationships of mountain area, elevation, and the presence or absence of ice. Reference ManleyManley (1955) has stressed the critical constraint of the summit area on potential glacier location and most of the methods for determining the “glaciation limit” (Reference øtremØstrem, 1966; Reference WeidickWeidick, 1968) are based on a similar premise, that is, that the area/elevation value for a particular summit (i.e. the shape of the summit) controls glacierization.
We next examine the data so that changes in elevation with distance are excluded; the analysis does not therefore consider climatic or other gradients.
Figures 7(a) and 8(a) show the relationship between the area available for glacierization (x) and the actual area of ice (y). The least-squares equation for Okoa Bay is
and for Home Bay is
where r 2 is the coefficient of determination (the percentage of the total variance accounted for by the regression equation). Intercepts on the two graphs are similar but the area of ice in relation to the area of land over 600 m in Home Bay exceeds that for Okoa Bay by a factor of 2.8.
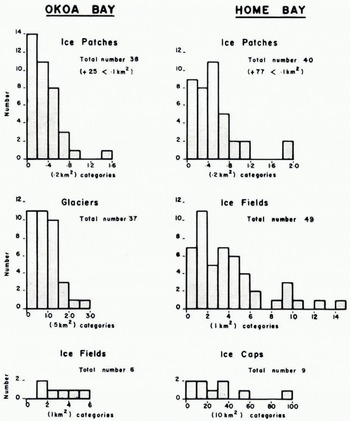
Fig. 6. Histogram of the frequency of occurrence of the different types of ice mass in Home Day and Okoa Bay.
The 'shape' of the mountains can be expressed as a ratio of elevation to area, where the area refers to land above 600 m a.s.l., so that the ratio increases as a mountain becomes more and more peaked. One obvious problem with the use of such a ratio is that it is independent of the absolute values for elevation and area. Figures 7(b) and 8(b) show the relationship between the “Shape” of the mountains and the area of ice. Both graphs show a sharply inflected relationship with the area of ice decreasing rapidly as a function of the “Shape” index for values greater than 100 X 10-6 m-1, (i.e. a summit elevation ≈800 m for an area above 600 m ≈ 8 km2).
The analysis is extended by Figures 7(c) and 8(c). The presence or absence of glacierization on a particular mountain is considered to be a function of area of land above 600 m and the “Shape” ratio. Of particular interest are the combinations of area and shape that impose limits on the presence or absence of glacier ice. Figure 7(c) shows that an elevation/area index of about 365 X 10-6 m-1 and an area of about 2 km2 is the upper limit for glacierization in Home Bay. The limiting elevation, therefore, is 730 m. However, the gradient is very gentle in this sector of the graph. Conversely, topography with an index of less than 30 X 10-6 m-l and an area of greater than 25 km2 (i.e. summit elevation ≈750 m) is always glacierized. Similar, but slightly lower limits occur in Okoa Bay (Fig. 8(c)). Thus, summit elevations on either limit are similar and it is the area of the high ground that appears to be critical.

Fig. 7. Data on glacierization for Home Bay. A: area of glacierization compared with area of land over 600 m a.s.l. B: area of ice and the ratio of elevation (m)|area above 600 m a.s.l. (km2). C: the presence or absence of glacierization in relation to area of land over 600 m a.s.l. and the ratio of elevation (m) | area above 600 m a.s.l. (km2). D: the presence or absence of glacierization in relation to summit elevation and the area of land over 600 m a.s.l.
The last two graphs on Figures 7 and 8 illustrate the relationship between summit elevation, area of land above 600 m a.s.l. and presence or absence of glacier ice. Considerable spread of values occurs and the upper and lower limits of glacierization are not as easily defined as on Figures 7(c) and 8(c). Second-order polynomials are plotted for the with- and without-ice condition. Coefficients of determination are low, 33 and 24% respectively, for Home Bay although less scatter is observed on Figure 8 and the equivalent coefficients have values of 61 and 25%. In both Home and Okoa Bays, summit elevations of 1 000 m a.s.l. are generally glacierized to some extent.
Quantitative information on the effect of area and summit elevation on the extent (area) of ice may be gained by using multiple regression techniques. In the present three-variable situation we can plot the data in the form of trend surfaces. The area of ice in the two areas has been related to combinations of (a) areas of land above 600 m, (b) elevation/area ratio, and (c) summit elevation, but only one combination significantly increased the coefficient of determination over the simple two-dimensional analysis. This result was obtained for Okoa Bay data relating area of ice (Z) to land area over 600 m (X) and summit elevation (γ). A reduction in the total sum of squares of 71.21% was obtained with 10% of this attributable to the addition of the second independent variable. The least-squares equation is:
where Z is in km2, X in km2 and γ is in meters.

Fig. 8. Data on glacierization for Okoa Bay. A: area of glacierization compared with area of land over 600 m a,s.l. B; area of ice and the ratio of elevation (m)|area above 600 m a.s.l, (km2). Ç: the presence or absence of glacierization in relation to area of land over 600 m a.s.l. and the ratio of elevation (m)|area above 600 m a.s.l. (km2). D: the presence or absence of glacierization in relation to summit elevation and the area of land over 600 m a.s.l.
Study of cirque orientations, elevations, and gradients
Despite the absence of knowledge on the controls of present forms there have been various attempts by glaciologists and geomorphologists to interpret glacial features in a geologic/ climatic context. This has happened to a degree with the use of cirque orientations and elevations (reviews of usage are included in Reference CharlesworthCharlesworth (1957) and Reference FlintFlint (1957) )while in some cases present and past distributions have been compared (Reference PorterPorter, 1964, for example).
Recognition of cirques on air photographs is usually easy if they have the mature “armchair” appearance. Identification is less easy if the cirques are immature, degraded or partially drowned. The parameters measured from the air photographs at each site are listed in Table II. There are many specific differences between the cirques in Home Bay and those in Okoa Bay (Figs. 9 and 10). In Home Bay, many cirques are drowned and few, if any, are filled by an individual glacier. In several areas a cirque is now partially hidden under the cover of an ice field. By comparison there are many more cirques in the Okoa Bay area, over half contain glaciers or ice patches, and none appear to be drowned. These differences further emphasize a significant contrast in both past and present glacierization.
Cirques in the Okoa Bay area
Figure 9 shows the orientation and lip elevation of all cirques in the area divided into three categories—containing glaciers, containing ice patches, and empty.
The orientation of the 49 cirques which contain glaciers (Figure 9(a)) is restricted to azimuths between 310° eastward to 145°. The median orientation lies at 15° although the distribution is multimodal with modes at 325°, 30° to 50°, and 135° with slightly over 50% occurring between 360° and 60°. The cirques range in elevation from 460 m to 1 250 m a.s.l. with a median elevation of 800 m a.s.l.

Fig. 9. Cirque data for Okoa Bay: A: orientation and elevation of cirque floors containing glaciers. B: orientation and elevation of cirque floors containing ice patches. C: orientation and elevation of all cirque floors in the Okoa Bay map area (as defined in Figure 3 ).
Cirques with ice patches (Fig. 9(c)) have a more even orientation distribution and occur clockwise from 285° to 100°. The elevation of these 37 cirques is slightly more restricted than those with glaciers. The lowest recorded elevation is 450 m and the highest 1 200 m a.s.l.; about 66% occur between 600 and 900 m a.s.l.
It is surprising in view of the extreme climatic conditions of east Baffin Island that out of a total of 163 cirques, 77 are unoccupied by glaciers or ice patches. The orientation/elevation diagram Figure 9(c) shows that cirques glaciers must have been less restricted at some time in the past. Elevation of these empty cirques ranges from 150 m to 1 050 m a.s.l. and they face in all directions; in fact 39% are oriented toward the south. The predominant direction of orientation is still, however, the north-east quadrant (i.e. from 360° to 090°) with 42% of the observed distribution. The median elevation is about 500 m a.s.l.; it is noticeable that only-cirques facing south-east lie above 900 m a.s.l.
Such diagrams are useful and have been employed by other workers (e.g. Reference SeddonSeddon, 1957; Reference TempleTemple, 1965), but they fail to take into account geographic trends of lip elevation. Such trends were analysed from coastal Labrador (Reference AndrewsAndrews, 1965 [b]) by grouping the cirques into classes on the basis of location. Figure 3 presents a more sophisticated approach, based on trend surface techniques, similar to that used recently for Tasmania by Reference Peterson and RobinsonPeterson and Robinson (1969). Table IV lists pertinent facts from the trend surface computations. It was found that the trend surfaces of cirques with glaciers and with ice patches are nearly identical, reflecting comparable gradients and orientations of the cirque floor “surface”. Both trends are significant in a statistical sense. The linear surfaces strike 120° to 300° and dip 030° at 17 m km-1. The standard error on the surface for cirques with ice patches is ±95 m maximum residual is +240 m; the respective values for cirques with glaciers are ±135 and —320 m. Figure 9 shows that the gradient of empty cirques facing southward is similar to that of occupied cirques but is on the average 200 m lower at any site. The trend is also quite similar (Fig. 3) differing by about 5°. The standard error is ±150 m with a maximum residual of +240 m.

Fig. 10. Cirque data for Home Bay: A: orientation and elevation of all cirque, floors. B: orientation and elevation of cirque floors O and back walls in the auditing map area (Fig. 2, lower right). C: orientation and length of glaciers descending from ice fields or ice caps.
Table IV. Trend surface analysis of okoa bay data

In review, it is apparent that there is a considerable difference in the orientation of cirques presently containing ice masses and those which are empty. The range in elevation of the cirques, as seen on Figure 9, is in part due to an increase in elevation of the cirque floor surface toward a bearing of 210°. This trend is linear. It was found that the fitting of higher-order surfaces to the data resulted in only small increases in the variance accounted for. The trend of the cirque-floor surface is thus nearly parallel to the regional trend of the coast and summit surface (Fig. 1).
Cirques in the Home Bay area
Figure 10 indicates the direction and elevation of all Home Bay cirques. The median azimuth of cirque distribution (Fig. 10(a)) is towards 30° and there is a significant lack of features between 180° and 270°. Cirque floors are markedly lower than in Okoa Bay with a median altitude of 300 m. A large number (22) of cirque floors are at present below sea-level and this fact highlights the problem of the association between cirque glaciation and erosion and the successive glaciations. Unlike their counterparts in Okoa Bay, the Home Bay cirques are either totally devoid of glacier ice or, in the case of the Nudlung area (Fig. 2, lower right), they are filled with glacier ice that originates from the mountain ice fields, so that it is only the form of the ice surface that allows their identification. The absence of individual small cirque glaciers around Home Bay is one of the major differences between the two areas. The reasons for this contrast are not obvious.
The distribution of cirques in the Nudlung area of Home Bay (Fig. 10(b)) is similar to that in the wider area—cirques are lacking in the south-east quadrant and a number are drowned. The development of the features is partly indicated by the heights of their back walls which vary from 100 m to 350 m.
Trend-surface analyses were performed on the above data for the Nudlung map (Fig. 2, lower right) and the Ekalugad map (Fig. 2, top). Table V contains the basic information on the analyses while Figures 2 and 10 show the results graphically. The statistically significant linear trends on the distribution of all cirques and all snow-banks parallel each other over the area of the two map units. In the Nudlung area the surfaces dip 30° at 10.7 m km-1, a lesser gradient than computed for Okoa Bay. The intersection of the cirque and snow-bed surface is not significant in the context of the standard errors. The gradient of the cirque-floor surface along Ekalugad Fiord (Fig. 11, Ekalugad map, Fig. 2) is much smaller (6 m km-1) with the surface dipping toward 105°. Data for the two maps were run separately and it is noticeable that the plotted trends intersect at a sharp angle. Both trends are approximately at right angles to the fiords.
Table V. Trend surface analysis of home bay data

Ice-field glaciers in the Home Bay area
Many of the large ice fields in the Home Bay area have one or more glaciers descending toward sea-level and these relate to a totally different glaciological milieu from that of the individual cirque glaciers. 162 glaciers of this type have been identified in the Home Bay area from air photographs and map interpretations. Various statistics on length, orientation, amount of retreat and elevation of the margins were abstracted. The long axis of the major ice fields is strongly controlled by the orientation of the fiords. In the Nudlung area the ice fields trend north-cast/south-west whereas in the region of Ekalugad Fiord they are oriented east/west (Fig. 2). A simple hypothesis of glacier distribution as related to topography would suggest that in the Nudlung area they should descend toward the north-west or south-cast, whereas in the Ekalugad area they should be directed toward the north or south. Table VI lists the observed distributions, while Figure 10(c) shows the total pattern of glaciers based on their direction and length. Sixty-six glaciers are directed between north-west and north-east compared with 17 between south-east and south-west; there is no simple topographic reason for this anomaly. Glacier lengths, measured from the junction with the main ice field, are less in the south-east and south-west quadrants, although because of the range of values there is no significant difference between the mean lengths over the four main quadrants. The mean glacier length is 2 km, with a maximum of 9.6 km.
Measurable retreat has been recorded on 30 (18.5%) of the glaciers. Surprisingly, little retreat is recorded for glaciers directed between south-east and south-west and testing by χ 2 indicates that the proportion of glaciers that have retreated is not significantly different from the expected numbers in the four main orientation sectors (Table VI). The effect of the broad, massive topography in the Ekalugad region is one possible explanation for the more even direction of the glaciers there compared with the more dissected Nudlung area.
The amount of observable recession from recent terminal moraines (probably 17th to 19th century) varies from nil to a maximum of 1 600 m. Approximately 20% of the glaciers show measurable recession, that is > 100 m. This rather limited evidence for frontal retreat since a maximum within the last 250 years provides a marked contrast with the response of many Norwegian and Alpine glaciers within the same period, but accords with recent findings elsewhere in the eastern Arctic (Reference Hattersley-SmithHattersley-Smith, 1969). The mean measured recession for the 30 glaciers was 405±180 m with an average recession of 816 m for 6 glaciers in the southeast quadrant and 335 m for 12 glaciers in the north-east quadrant.
Table VI. Distribution of glaciers in 45° Segments

Distribution of permanent snow-ranks
Small, permanent snow-banks are present throughout both areas in the lee of topographic-irregularities. Variables measured (Table I) were elevation and orientation. The lowest elevation of extant snow-beds have been used (Reference ManleyManley, 1955, for example) to derive estimates of the regional snow-line. Prominent lichen “trim lines” around many of the permanent snow-beds in our areas provide clear evidence of their recession in the recent past. In both Home and Okoa Bays permanent snow-beds are found down to near sea-level although trend surface analyses (Figs. 2 and 3, and Tables IV and V) indicate that there is an overall increase in elevation parallel to the trend of the cirque-floor surface (see also Figure 11). In inland reaches of Okoa Ray snow-beds occur, on the average, 400 m below cirques containing active glaciers. A study of orientation/elevation diagrams for Home Bay indicates a clear difference between the coastal areas and those inland on the plateau. In the latter area the majority of snow-beds face south-west whereas in the former area they are oriented toward the north-east, as are the Okoa Bay features. These distributions may be the result of well differentiated wind flow patterns. Table VII shows that the most frequent wind direction at Dewar Lakes, on the inland plateau, is easterly, whereas the prevailing direction at coastal stations is west or northwest.
On the whole, the study of snow-bed distribution does not add a great deal to the investigation. largely because these features are more or less ubiquitous given a degree of topographic irregularity.

Fig. 11. Profiles drawn normal to the linear trend surfaces of Figures 2 and 3 showing snow-banks, cirques with glaciers and empty cirques fitting south-east and south-west in Okoa Bay, and snow-banks and cirques with glaciers in Home Bay (Nudlung Fiord, Ekalugad Fiord).
Climatic considerations
Eastern Baffin Island is far from homogeneous climatically, particularly in terms of precipitation. Table VII illustrates the decrease in frequency and amount of snowfall northward of Cape Dyer. The large totals in the Cumberland Peninsula are evidently related primarily to the greater frequency of snowfall rather than to heavier (average) falls.
The distribution of snowfall amounts would lead one to expect the opposite pattern of glacierization in Home Bay and Okoa Bay to that actually observed. Consequently, we must consider the likely ablation in the two areas. Apart from the measurements made in 1953 on the Penny Ice Cap by Reference OrvigOrvig (1954) there is no direct evidence on this question and the upland ice-cap situation is in any case not directly relevant to the problem under consideration here. The number of degree days with a mean daily temperature above 0°C was therefore examined. Table VII gives the average accumulated totals for 1961-65 at Broughton Island and Cape Dyer. The highest and lowest totals during these 5 years are shown in Table VIII. Dewar Lakes is included for comparative purposes. Although there is little difference between the highest totals, the lowest value at Cape Dyer is much above that at the other two stations.
Table VII. Climatic data for Baffin Island

In terms of ablation equivalent only a very crude estimate is possible at present. Reference Pysklywec, Pysklywec, Davar and BrayPysklywec and others (1968) obtained an average daily snow melt of 0.04 inch (water equivalent) per day-degree F above 27.6°F (≈0.18 cm per day-degree C above —2.6°C) in New Brunswick, while the U.S. Army Corps of Engineers (1956) cite values of ≈0.05 inch per day-degree F above 32°F (≈0.23 cm per day-degree C above 0°C) in the Sierra Nevada. At an elevation of 300 m on the Sverdrup Glacier, Devon Island, during 1963, Reference KeelerKeeler (1964) estimated the much higher rate of 0.47 cm (water equivalent) per day-degree C above 0°C. Obviously, the figure will vary from year to year and place to place but, in view of the fact that the only reasonably reliable long-period data in the Arctic are usually temperature records, it seems worthwhile seeking empirical relationships of this type as a first estimate of spatial variations in ablation amounts. Using a figure of 0.2 cm per day-degree C above 0°C, we obtain an ablation equivalent of 62 cm water equivalent at Broughton Island and 78 cm water equivalent at Cape Dyer. Using Keeler's factor, these figures become 146 cm and 181 cm respectively. Both sets of estimates considerably exceed the annual snowfall converted to water equivalent (Table VII). A plot of mean monthly temperature against monthly melting {degree days total) for Cape Dyer and Broughton Island (not shown) indicates a clearly defined curvilinear relationship with negligible scatter over the greater part of the range. Only below 1°C (a monthly melting degree-day total ≈45 deg) does the fit become less satisfactory, with apparently different curves for each station. Using the Broughton Island curve, and assuming a mean lapse rate of 0.8 deg/100 m (based on temperatures recorded at Inugsuin Fiord and a temporary inland station at c. 300 m a.s.l. during June and July 1967 (Reference Barry and FogarasiBarry, 1968)), it is estimated that the mean melting degree-day total at 1 000 m elevation is ≈20 deg, corresponding to only ≈5-10 cm water equivalent. Since this figure would imply a snow line much lower than is observed, it is clear that more specific information is required on temperature conditions in the coastal mountains and on ablation temperature (or preferably ablation-radiation) relationships.
Consequently, there is no clear evidence concerning the relative importance of summer ablation and winter snowfall in maintaining the present pattern on glacierization. All that can be said is that the northward decrease in ablation appears to be proportionately smaller than the decrease in snowfall amount.
It is of course possible that the coastal stations are very unrepresentative of precipitation conditions inland. For example, total precipitation at the head of Ekalugad Fiord between 4 June and 31 August 1967, was 22.2 cm (Reference ChurchChurch, 1968) compared with only 7.7 cm at Cape Hooper. The bulk of this difference occurred during August. For instance, 3.69 cm of rain fell at Ekalugad Fiord on 24-25 August while only 0.23 cm was recorded at Cape Hooper. On a day-to-day basis there is no evidence of similarity of precipitation events between the coastal stations. With reference to days with at least 0.025 cm precipitation in September and October 1961-65, for example, the coefficient of association is only 0.69 between Cape Hooper and Broughton Island and 0.71 between Broughton Island and Cape Dyer. A figure >0.90 is required for some degree of similarity between the stations. The implication is that large-scale, synoptic control of precipitation is possibly less important in this area than might be anticipated. However, it may be that local effects mask the synoptic-scale precipitation systems through the direct or indirect effects of topography and the extent of open water versus sea ice.
Table VIII. Melting degree-days

The synoptic patterns typical of cool summer days were examined using an arbitrary temperature criterion of mean daily temperature <2.5°C at Broughton Island. 20 out of a total of 35 such cases during July 1961-65 were associated with a low center in Davis Strait or Baffin Bay and a further 5 cases with a low over Baffin Island; all patterns give an easterly flow component over the area in question. A further indicator of cool summers is lack of sunshine. Reference SagarSagar (1966) has shown the significance of solar radiation for ablation in Baffin Island. He states that 70% of the melt on the Barnes Ice Cap during 1962 and almost 100% in 1963 was due to absorbed radiative energy. Selection of days with <10% of possible bright sunshine at Frobisher during June and July 1961-65 again show the importance of southeasterly flow with usually a low center over Hudson Strait (figures not included, see Reference Barry and FogarasiBarry and Fogarasi (1968, p. 99-103)).

Fig. 12. Mean sea-level pressure pattern for 13 days with a maximum air temperature > 15°C at Cape Dyer (marked X), 1961-65.
As an indicator of warm summer conditions, all cases with a maximum temperature ≥15°C at Cape Dyer during July and August 1961-65 were used. The mean sea-level pressure pattern for these 13 (non-consecutive) days shows high pressure over the northern Labrador Sea and south-westerly flow at Cape Dyer (Figure 12). In such a situation föhn descent might occur in the vicinity of the station, although no study of this possibility has yet been undertaken.
Turning next to some paleoclimatic considerations, we first note that the geomorphological evidence indicates that mountain glaciers and ice caps developed in the Home Bay area only c. 2 000-4 000 years ago as the main Lauren tide ice shrank and retreated on the western side of the east coast mountains (Reference Andrews, Andrews, Buckley and EnglandAndrews and others, 1970), Figure 13 outlines a model of this development based on the field evidence. This sequence suggests that when the ice-cap dome exceeded the elevation of the mountain summits the mountains were subject to sheltering with respect to moist south-westerly air flows. As the main ice retreated, however, mountain ice caps and glaciers could form. Examination of the occurrence of daily snowfalls of >5 cm at Dewar Lakes in September-October 1961-65 indeed shows a mean low-pressure center in Foxe Basin and south-westerly flow (Fig. 14), so there is some plausibility in this argument. If, however, we attempt to apply this idea to the northern part of the Cumberland Peninsula, and reason that the small extent of ice in the Okoa Bay area at the present day is caused by sheltering effects of the Penny Ice Cap with respect to south-westerly air flow, the case breaks down. Figure 15 shows that heavy snowfalls at Broughton Island (>5 cm/24 h during September-October 1961-65) are associated with a low over the Davis Strait area and easterly flow at the coast. A similar picture is obtained for days with >12.7 cm (5 in) snowfall at Cape Dyer (not shown). The overall relative importance of south-west and south-east sources of accumulation in this and other parts of Baffin Island remains to be determined. This work is in progress at the present time as a continuation of the study referred to earlier by Reference Barry and FogarasiBarry and Fogarasi (1968).

Fig. 13. A model for the development of mountain glaciers and ice caps in the Home Bay area, (Note: the present Barnes ice Cap is situated north of the line of section, approximately lat. 68.7° N.).
With reference to the data on cirque orientation in the two areas it was noted above that there is a general northerly and easterly exposure of cirques occupied by glaciers. This is not obviously related to wind drift since the frequency of south and south-west winds is only 8% at Broughton Island, 13% at Cape Hooper and 18% at Cape Dyer. However, more information on the direction of the dominant winds in winter and particularly on the local wind pattern is required. When we consider the distribution of empty cirques in Okoa Bay (Fig. 9) it is noticeable that they are not only lower, but 39% have a southerly orientation. The 200 m lowering of the trend surface of cirque elevation (Fig. 11) may reflect a summer temperature decrease of 1.0°-1.5°C, or may imply greater summer cloudiness. The former is perhaps more likely since the latter would require greater frequency of disturbances, which at the same time would be accompanied by more frequent warm, moist air masses in the warm sector of the depressions. The effect of isostatic depression has also to be considered in this context and this factor is discussed below.

Fig. 14. Mean sea-level pressure pattern for 13 days with snowfall >2 inch (5 cm) at Dewar Lakes (marked X), September. October 1961-65.

Fig. 15. Mean sea-level pressure pattern for. 37 days with snowfall > 2 inch (5 cm) at Broughton Island {marked X), September-October) 1961-65.
It is significant that there is no association between orientation and glacier retreat in the Home Bay area. The absence of retreat of south-facing glaciers may reflect the influence of drifting and blowing snow with northerly winds, although the latter are not especially frequent —30% from north-west, north and north-east at Broughton Island and 31% at Cape Hooper.
Discussion
The results fail to show any clear and simple relationship between present climate and glacierization in these two areas of Baffin Island. In part this may reflect the use of climatic data from stations that inadequately represent the glacier environments. Another consideration, however, is the lag response of ice bodies to climatic changes (see Reference Bryson, Wendland and Mayer– OakesBryson and Wendland. 1967, fig. 70). This response operates over the various time scales shown in Table IX and it seems possible that some of the contrast between the two areas reflects differential lag effects between the ice fields and ice caps of Home Bay, on the one hand, and the glaciers of Okoa Bay on the other.
Table IX. Relationship of different time scales of climatic change and the response level of glaciers

In the scheme of Table IX it is assumed that topography represents an essentially constant “platform” on which is imposed the regional climate. Nevertheless, in coastal zones which have been subjected to Pleistocene glaciation the present elevation of abandoned cirques and other features has to lake into consideration the isostatic depression of the land surface under the load of the Pleistocene ice sheets. In our area, consideration of theoretical ice-cap profiles and probable isostatic depression indicates that elevations were between 200 and 80 m lower than today, relative to present sea-level. In the Home Bay area, for example, the sea-level in Cockburn time (c. 8 000 B.P.) was probably still 60 m higher than today. The maximum elevation (790 m) of a lateral moraine system in the area can be used to give a lower limit on the equilibrium line of the time. Hence, the snow line inferred from this moraine was at least 790—60 m = 730 m a.s.l. Today's snow line is considered to be around 650 m from field observations and yet there is almost certainly less snow and ice cover at the present time. This différence may represent the effect of a lag in response of the Cockburn ice bodies from a more severe pre-Cockburn climate, but there is at present no means of testing this hypothesis.
This study has undoubtedly raised more questions than it has answered and most of the answers must be sought in the field. A field study of selected cirques in the Okoa Bay region is in fact being undertaken in 1969 and 1970. It is clear that the present-day relationships between the degree of glacierization and the climatic and topographic controls are far from being understood. The many paradoxical relationships that have been found and the rather negative conclusions emphasize the need for caution on the part of those who attempt to interpret past distributions in terms of simple climatic patterns. Many of the interpretations that have been made in the realm of glacier-climate inter-relationships would appear from the present evidence to be insecurely based. However, in spite of the uncertainties in the interpretation of the results, the factual information on the area is considered to provide a valuable basis for future investigations, Λ more extensive application of the techniques used here to other areas of the eastern Canadian Arctic should be very rewarding.
Acknowledgements
The work reported in this paper was initiated by the authors in the former Geographical Branch, Department of Energy, Mines and Resources. It was continued by Andrews and Drapier as members of the Geological Survey of Canada. We would like to acknowledge the research assistance of Miss Sally Wykes during the 1967 summer and to thank Dr J. D. Ives for reading this paper.


