


1. Introduction
Highly agile natural flyers and swimmers can aptly morph their fins and wings during a number of unsteady manoeuvres. Birds and bats morph their wings to change the wing planform in order to control the forces (Johansson, Wolf & Hedenström Reference Johansson, Wolf and Hedenström2010; Taylor et al. Reference Taylor, Carruthers, Hubel and Walker2012; van Oorschot, Mistick & Tobalske Reference van Oorschot, Mistick and Tobalske2016). Marine swimmers use the flexibility of their fins to reach a very high acceleration during an attack or escape manoeuvre (Triantafyllou, Weymouth & Miao Reference Triantafyllou, Weymouth and Miao2016). Some marine animals use large volume-deformation to propel them during start-up. Squid and octopus inflate themselves by filling water in their mantle cavities and then ejecting it quickly through their orifice to gain high one-directional acceleration (Triantafyllou et al. Reference Triantafyllou, Weymouth and Miao2016). In all the above-mentioned examples of manoeuvring, the morphing of wings, fins and body are actively controlled by the animals.
For exercising such active control, the wings or the fins of natural flyers and swimmers have to be flexible. The compliance of the wing is thus a crucial aspect of propulsive performance. By using an insect model, Ramananarivo, Godoy-Diana & Thiria (Reference Ramananarivo, Godoy-Diana and Thiria2011) described the role of wing compliance on the flow field and the unsteady forces. They showed that flapping flyers optimized their performance not by resonance but by tuning the wing shape over time. Daniel & Combes (Reference Daniel and Combes2002) demonstrated that fluid stresses did not control the bending pattern of insect wings, rather it is the elastic property of the wing material that determined the wing shape during flapping. A few researchers investigated the aerodynamic performance of compliant membrane wings of different shapes and reported higher lift slope, and a delayed stall to higher angles of attack (Song et al. Reference Song, Tian, Israeli, Galvao, Bishop, Swartz and Breuer2008; Waldman & Breuer Reference Waldman and Breuer2017; Das, Mathai & Breuer Reference Das, Mathai and Breuer2020)
The effect of passive flexibility on flapping has been investigated by many researchers (Combes & Daniel Reference Combes and Daniel2001; Sane & Dickinson Reference Sane and Dickinson2002; Combes & Daniel Reference Combes and Daniel2003; Lauder et al. Reference Lauder, Madden, Mittal, Dong and Bozkurttas2006; Heathcote, Wang & Gursul Reference Heathcote, Wang and Gursul2008a; Zhao et al. Reference Zhao, Huang, Deng and Sane2010; Wu et al. Reference Wu, Stanford, Sällström, Ukeiley and Ifju2011; Zhao, Deng & Sane Reference Zhao, Deng and Sane2011; Kang & Shyy Reference Kang and Shyy2013; Geng et al. Reference Geng, Xue, Zheng, Liu, Ren and Dong2017). Many have used the pitching, heaving and flapping motion of flexible flat plates to investigate the effect of flexibility on propulsion (Katz & Weihs Reference Katz and Weihs1978; Michelin & Llewellyn Smith Reference Michelin and Llewellyn Smith2009; Miller & Peskin Reference Miller and Peskin2009; Ramananarivo et al. Reference Ramananarivo, Godoy-Diana and Thiria2011; Dai, Luo & Doyle Reference Dai, Luo and Doyle2012; Dewey, Carriou & Smits Reference Dewey, Carriou and Smits2012; Lucas et al. Reference Lucas, Johnson, Beaulieu, Cathcart, Tirrell, Colin, Gemmell, Dabiri and Costello2014). It has been shown that a flexible wing has better lift production and overall performance compared with a rigid wing because of its shape adaptation (Ho et al. Reference Ho, Nassef, Pornsinsirirak, Tai and Ho2003; Lian & Shyy Reference Lian and Shyy2005). For example, the chordwise flexibility helps to effectively change the angle of attack (Kang & Shyy Reference Kang and Shyy2013), average thrust (Marais et al. Reference Marais, Thiria, Wesfreid and Godoy-Diana2012) and increases sectional lift. Heathcote, Martin & Gursul (Reference Heathcote, Martin and Gursul2004) investigated the role of chordwise flexibility and later also of spanwise flexibility (Heathcote & Gursul Reference Heathcote and Gursul2007) on the unsteady forces of a flapping foil. They showed that the phase angle of the pitch-and-heave motion controlled the thrust. Their result indicated that there is an optimum flexibility which maximizes the propulsive efficiency. The effect of spanwise flexibility leads to a higher thrust-to-power ratio (Heathcote, Wang & Gursul Reference Heathcote, Wang and Gursul2008b). It has been shown numerically that due to spanwise flexibility, there is a lag between the wing-tip motion and the root motion, which leads to a higher overall performance (Trizila et al. Reference Trizila, Kang, Aono, Shyy and Visbal2011; Gordnier et al. Reference Gordnier, Chimakurthi, Cesnik and Attar2013). The effect of flexural stiffness of a flexible flap was investigated by David, Govardhan & Arakeri (Reference David, Govardhan and Arakeri2017) who showed that the axial component of the force was influenced by the flexible flap. Kang et al. (Reference Kang, Aono, Cesnik and Shyy2011) showed that wing-tip deflection plays a major role in force generation. They also developed scaling laws connecting the flexibility to the resultant forces on the flapping wings. Such scaling laws have been developed by other researchers as well (Dewey et al. Reference Dewey, Boschitsch, Moored, Stone and Smits2013; Moored & Quinn Reference Moored and Quinn2019).
Numerical simulations using immersed boundary methods have provided key insights on the flow field of manoeuvring wings and fins. Dong et al. (Reference Dong, Bozkurttas, Mittal, Madden and Lauder2010) investigated the flow around the pectoral fin of a bluegill sunfish and showed that the fin produced high propulsive performance with the help of active and passive fin deformation. Li & Dong (Reference Li and Dong2016) used low aspect ratio (AR) plates to study the effect of a pitching–rolling motion on the propulsive performance. They showed that double-loop vortices with alternating signs were produced by the pitching–rolling plate. Dong, Mittal & Najjar (Reference Dong, Mittal and Najjar2006) used thin ellipsoidal flapping foils to analyse the vortex topology and showed that this was dominated by two sets of interconnected vortex loops.
The vorticity distribution of the wake contributes to the circulatory forces on the wing and the fin. This vorticity is mainly generated on the wing or fin surface, hence the structural flexibility also controls the wake dynamics. Zhu, He & Zhang (Reference Zhu, He and Zhang2014) investigated the effect of flexibility on the wake dynamics. They showed that an increase in flexibility can cause a reduction in the vorticity production at the leading edge by reducing the effective angle of attack. The vortices generated by such unsteady periodic motions exert circulatory forces on the wings which affect the locomotion. By actuating a flexible panel in heaving motion, Quinn, Lauder & Smits (Reference Quinn, Lauder and Smits2014) showed that the net thrust increased with the frequency of heaving.
A number of researchers have used simpler motions, such as translation or rotation, to demonstrate key features of unsteady forces and the wake dynamics during a more complicated flapping motion. In the case of translating rigid or flexible plates, the plates started from rest and reached a fixed Reynolds number after travelling a specified number of chord lengths. The study by Dickinson & Gotz (Reference Dickinson and Gotz1993) is one of the first in this category, where they showed that the initial lift generated by a translating flat plate, held at an angle of attack of more than  $13.5^\circ$, was caused solely by a leading-edge vortex. Kim & Gharib (Reference Kim and Gharib2011) compared the drag profile and the vortex formation process of an accelerating flexible plate – held normal to the flow – with that of rigid and semirigid plates with similar kinematics. They showed that the flexible plate delayed the formation of the edge vortices. They also found that after the acceleration phase, the tip of a flexible plate reached maximum forward velocity. Mao et al. (Reference Mao, Jin, Wang and Chamorro2020) performed experiments with an accelerating and decelerating rigid plate in a quiescent water tank. They showed that the pattern of acceleration controlled dynamics of the large-scale coherent motions. Ringuette, Milano & Gharib (Reference Ringuette, Milano and Gharib2007) used digital particle image velocimetry (PIV) in the wake of a flat plate held at $90^\circ$ to the incoming flow. They showed that the tip vortex produced a maximum in the force profile, while suppressing it caused a minimum.
Apart from translating motion, a few researchers have also used rotating wings to approximate flapping motion. DeVoria & Ringuette (Reference DeVoria and Ringuette2012) used a rotating trapezoidal flat-plate fins to approximate a flapping motion and showed that for large rotational amplitudes, the leading edge vortex got saturated and pinched-off earlier. Carr, DeVoria & Ringuette (Reference Carr, DeVoria and Ringuette2015) used a similar rotating wing set-up to study the AR effect on the forces and the flow field. They showed that for lower AR plates, the streamwise contribution to lift forces is larger due to a coherent tip vortex and aft tilted leading-edge vortex.
In spite of the proven benefit of active control of flexibility, experimental work in this area is comparatively rare, whereas the effect of passive flexibility on flapping has been investigated by many researchers as detailed in the previous paragraphs. However, natural flyers and swimmers control such shape deformation actively. This is exactly the motivation of this paper. We want to investigate the effect of controlled shape change of a flat plate on its surrounding flow field and the unsteady forces during an accelerating manoeuvre. Dynamic planform variation has been recently shown to be beneficial in highly unsteady flows (Huera-Huarte & Gharib Reference Huera-Huarte and Gharib2017; Chowdhury & Ringuette Reference Chowdhury and Ringuette2021). In our present work, we actively control the span deformation of an accelerating flat plate held at an angle of attack of  $90^\circ$. We use both experiments and analytical modelling to characterize the unsteady forces during an accelerating start and demonstrate that controlled morphing can effectively alter the unsteady forces.
2. Experimental details
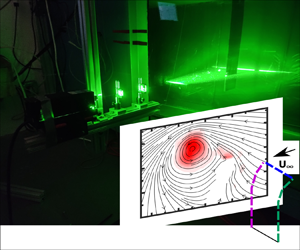
The experiments were conducted in a towing tank with a cross-sectional area of  $1\times 1\ \textrm {m}^2$ and a towing length of 6 m at the University of Central Florida (figure 1a). Two flat plates were 3D printed using a polyjet printing process. They were printed in a Stratasys J-750 machine with black Agilus material (hardness 70 in Shore A scale). One of the plates has a chord ( $c$) of 16 cm and span 48 cm ( $AR = 3$ or AR3) and another has the same chord dimension but a span of 32 cm ( $AR = 2$ or AR2). Both the plates have two internal grooves where prebent steel rods (diameter 3 mm) were inserted. These steel rods were connected to two servo motors (figure 1b), which when rotated bent the span of the plate. The actuation system was designed to result in a flexion ratio of 0.6 and a bending displacement of $0.35c$ of the tip. These are the most common bending parameters found across animal taxa (Lucas et al. Reference Lucas, Johnson, Beaulieu, Cathcart, Tirrell, Colin, Gemmell, Dabiri and Costello2014). The flexion ratio is defined as the ratio of the unbent part of the span to the total span. The flat plates were fitted to a carriage driven by a traverse system (HPLA 180, Parker, USA) (figure 1a). They were accelerated from rest to a velocity ( $U_{\infty }$) of $0.1$ m s $^{-1}$ with three different accelerations ( $A$):
$A$):  $0.036\ \textrm {m s}^{-2}$, 0.1 m s $^{-2}$ and $0.2 \ \textrm {m s}^{-2}$ (figure 1c). This resulted in a fixed terminal Re of 18 000 and three acceleration numbers, namely, $A_c = 0.57$, 1.6 and $3.2$ ( $A_c = A\times c/{U_{\infty }^2}$). In figure 1(c) velocity is non-dimensionalized as $u^* = {U}/{U_\infty }$ and time is non-dimensionalized as $t^* = {t\times U_\infty }/{c}$.

Figure 1. The experimental set-up and the wing kinematics: (a) the towing tank with cameras and laser plane positions for the experiment; (b) front view of the wing showing the morphing wing, force sensors and servos; (c) the kinematics of the experiment for  $A_c = 0.57$, $A_c = 1.6$ and $A_c = 3.2$; (d) a morphed wing and the spanwise PIV planes at 70 % and 90 % along with the tip vortex plane (tip Plane).
For each acceleration number, the plate was bent for three different durations ( $t_b$), 1.2 s, 2.4 s and 3.2 s starting from rest. This resulted in three non-dimensional bending times ( $t^*_b$) of 0.75, 1.5 and 2.25. Here $t^*_b$ is defined as $t^*_b = {t_b \times U_\infty }/{c}$. Two bending directions were tested. In one case the plate was bent towards the incoming flow (denoted as the ‘bend-down’ case), and in another case the plate was bent away from the flow (‘bend-up’). We note that after the completion of the controlled bending, the plate stayed in the bent position during the rest of the travel and did not come back to the straight position. The bending displacement was measured by capturing the movements of dots marked on one of the edges with a high-speed camera. The bending acceleration of the bent part of the plate was measured in a static, no-flow condition (zero carriage velocity) by placing an accelerometer (ICM-20948) at the tip. Instantaneous forces were measured by a 6-dof force sensor (Nano25, ATI, USA) at a sampling frequency of 5000 Hz. Each force data were low-pass filtered with a cutoff frequency of 6 Hz and averaged over 20 runs.
The wake velocity field was measured using planar PIV. The flow field was illuminated across a chordwise plane and a spanwise plane by two perpendicular laser sheets of 2 mm thickness using a 2 W continuous-wave laser (Dragonlaser). To capture the development of the edge vortices, PIV was conducted in a chordwise plane at 70 % span of both the AR2 and AR3 plates. Later this chordwise plane was shifted down to conduct PIV at 90 % span of both the plates (figure 1d). The spanwise laser sheet was created at the midchord location to capture the formation of the tip vortex. Then PCO.edge 5.5 cameras (PCO, USA) with a resolution of  $1920 \times 1080$ pixels were used at a frame rate of 200 Hz. The cameras moved with the traverse. The physical size of the field of view in all cases was $11.33 \times 20.15$ cm. Hollow glass spheres of $100\ \mathrm {\mu }$m diameter were used as seeding particles. The PIV data was processed using PIVLab (Thielicke & Stamhuis Reference Thielicke and Stamhuis2014). A multipass scheme containing a final window size of $32 \times 32$ pixels with a 75 % overlap was selected for final processing. All postprocessing was carried out using MATLAB. Vorticity was computed by phase-averaging five PIV runs in each case. The evolution in the sectional growth rate of the wake vortices was quantified by calculating the non-dimensional circulation, $\varGamma ^*(={\varGamma }/{U_{\infty } c}$), inside the vortex core at different time instants using the $\varGamma _2$ criteria (Graftieaux, Michard & Grosjean Reference Graftieaux, Michard and Grosjean2001).
3. Modelling the unsteady drag
The unsteady drag  $F_D(t)$ on an accelerating flat plate is modelled as (Sarpkaya Reference Sarpkaya2010)
 \begin{equation} F_D (t)= \frac{1}{2}C_{d} \rho A U^2 + (m_p+m_a)\frac{\partial U}{\partial t},\end{equation}
where  $C_d$ is the coefficient of drag ( $C_d = {F_{D\textrm {@} U_\infty }}/{\frac {1}{2}\rho U_\infty ^2}$), $A$ is the area of the plate, $\rho$ is the density of water, $m_p$ is the mass of the plate and $m_a$ is the added mass. The value of $C_D$ is taken as 2.5 for the AR3 plate and 2.21 for the AR2 plate. This value is obtained by towing the flat plate at a constant speed of $U_\infty$ and measuring the normal drag force $F_{D\textrm {@} U_\infty }$. Since only part of the plate bent during the acceleration, we divided the span into multiple segments and modified the acceleration term ( ${\partial U}/{\partial t}$) in (3.1) by adding or subtracting the bending acceleration ( ${\partial U_{b_i}}/{\partial t}$) to denote the bend-down and bend-up cases, respectively. Then, for each segment ( $i$), we write the modified unsteady drag $F_D (t)_i$ as
 \begin{equation} F_D (t)_i=\frac{1}{2}C_d\rho A_{p_i}|U \pm U_{b_i}|(U \pm U_{b_i}) + (m_{p_i}+m_{a_i})\left(\frac{\partial U}{\partial t} \pm \frac{\partial U_{b_i}}{\partial t}\right).\end{equation}
 Finally, the total unsteady drag force,  $F_D(t)$, is expressed as $F_D(t) = \sum {F_{D_i}(t)}$. We note that for the segments of the plate above the flexion point, $U_{b_i} = 0$ and ${\partial U_{b_i}}/{\partial t} = 0$. The added mass ( $m_{a_i}$) of each segment is calculated as $m_{a_i} = \rho V_{i}C_{m_i}$, where $C_{m_i}$ is the added mass coefficient for each segment and $V_{i} = U \pm U_{b_i}$. The difference between the projected area of the bent part of the plate and the straight plate was no more than $2\,\%$. Hence, for the bent segments of the plate, $C_{m_i}$ is kept constant. Following Meyerhoff (Reference Meyerhoff1970), $C_{m_i}$ is taken as 0.824 for the AR3 plate and 0.757 for the AR2 plate.
4. Results and discussion
In this section, we compare and contrast the instantaneous forces and the flow field of the flat plate with aspect ratios 2 and 3 (AR2 and AR3), over a parameter space consisting of three acceleration numbers ( $A_c$), three bending durations ( $t^*_b$) and two bending directions (bend-up and bend-down). The instantaneous drag forces experienced by the two plates (AR2 and AR3) are first compared in §§ 4.1 and 4.2. The results of analytical modelling is discussed in § 4.3 followed by the vorticity field in §§ 4.4 and 4.5. The differences in the vorticity field of the AR2 and AR3 plates are summarized in § 4.6.
4.1. Instantaneous drag forces
The unsteady force experienced by the plate during the start-up acceleration and simultaneous bending is first characterized with the help of the force sensor data. Figures 2–4 show the evolution of the coefficient of drag ( $C_d$) with non-dimensional time ( $t^*$) when the plate was towed with acceleration numbers, $A_c = 0.57$, 1.6 and 3.2, respectively. In each of these figures, the unsteady forces for three bending durations, namely $t^*_b = 2.25$, 1.5 and 0.75 are presented in panels (a–c). The start and the end of the bending are denoted by $t^*_{b1}$ and $t^*_{b2}$, respectively. The inset in each of these panels shows the zoomed-in view of the $C_d$ traces until $t^* = 0.4$. Panel (d) in each of figures 2–4 show the bending acceleration (the purple trace) and the bending velocity (magenta trace) of the tip of the plate when the bending duration ( $t^*_b$) was 0.75. The bending velocity ( $U_b$) of the tip is calculated by integrating the tip acceleration profile measured by the accelerometer.

Figure 2. The evolution of the coefficient of drag  $C_d$ during the $A_c = 0.57$ case: bending duration $(t^*_b) =$ (a) 2.25; (b) 1.5; (c) 0.75. The inset of each figure shows the zoomed-in view of the $C_d$ traces up to $t^* = 0.4$, which were used for impulse calculations. (d) The bending acceleration (the purple trace) and the bending velocity (the magenta trace) as measured at the tip of the plate. Both the bend-down and bend-up cases had similar bending kinematics, which are divided into three parts: $a'{\hbox{--}}b'$ – acceleration; $b'{\hbox{--}}c'$ – constant velocity; and $c'{\hbox{--}}d'$ – deceleration.

Figure 3. The evolution of the coefficient of drag  $C_d$ during the $A_c = 1.6$ case: bending duration $(t^*_b) = (\textit {a})$ 2.25; (b) 1.5; (c) 0.75. (d) The bending acceleration (the purple trace) and the bending velocity (the magenta trace) as measured at the tip of the plate. For details of the insets in (a–c) and (d), please see the caption of figure 2.

Figure 4. The evolution of the coefficient of drag  $C_d$ during the $A_c = 3.2$ case: bending duration $(t^*_b) =$ (a) 2.25; (b) 1.5; (c) 0.75. (d) The bending acceleration (the purple trace) and the bending velocity (the magenta trace) as measured at the tip of the plate. For details of the insets in (a–c) and (d), please see the caption of figure 2.
In figure 2(a–c) the  $C_d$ traces for both the AR2 and AR3 plates display an upward trend until $t^* = 1.8$. This $t^*$ value coincides with the end of the acceleration of the traverse in the $A_c = 0.57$ case. In this $A_c = 0.57$ case, the effect of bending was not significant during the acceleration period except at the very beginning of the motion for all three bending durations. The insets in figure 2(a), figure 2(b) and figure 2(c) show that the lowest bending duration ( $t^*_b = 0.75$) or the highest bending rate had the maximum effect on the unsteady drag. We note that the effect of bending during the initial start-up phase is mainly caused by the bending acceleration. This phenomenon is explained with the help of figure 2(d) which shows the velocity and acceleration (for $t^*_b = 0.75$) of the plate tip measured by an accelerometer. The total acceleration of the flexed part of the plate is a vector addition of the carriage acceleration and the bending acceleration. Figure 2(d) shows that the tip of the plate initially accelerates to reach a steady bending velocity from $t^* = 0.2$ to $t^* = 0.27$ ( $t^*={t U_{\infty }}/{c}$). The $C_d$ peak in figure 2(c) between $0$–
$0$– $a'$ is a step response for the acceleration. Then it continues with a steady velocity from $t^* = 0.27$ to $t^* = 0.82$ (denoted by the region $b'$–
$b'$– $c'$), eventually decelerating to a stop which denotes the end of bending manoeuvre (denoted by $c'$–
$c'$– $d'$) from $t^*=0.82$ to $t^*=0.95$.
The direction and magnitude of the bending acceleration relative to the plate acceleration control the initial level of unsteady forces experienced by the plate. A common feature demarcating the bend-up and bend-down manoeuvre can be observed in figure 2(a–c). During the bend-down manoeuvre (when the plate bends towards the incoming flow), the force values (denoted by the blue trace) are higher than the flat case (denoted by black trace) as well as the bend-up case (when the plate bends away from the incoming flow and denoted by red trace) during period  $a'{\hbox{--}}b'$ (figure 2c). In the bend-down case, the forward acceleration of the plate and the bending acceleration are in the same direction, which makes the relative acceleration of the incoming fluid opposite to the bending acceleration. Hence the overall acceleration is the vector sum of these two accelerations in the unsteady phase. This leads to a higher force response in the bend-down case. In the bend-up case, the bending acceleration and the relative acceleration of the incoming fluid are in the same direction, resulting in a vector subtraction. Hence the force peak during the period $a'{\hbox{--}}b'$ in the bend-up case is lower than the flat case and the bend-down case.
In the case of accelerations with 0.1 m s $^{-2}$ and 0.2 m s $^{-2}$ ( $A_c = 1.6$ and 3.2), the force histories showed similar characteristics, i.e. the bend-up acceleration reduced the initial drag forces, while the bend-down acceleration augmented it. Also, the effect of fastest bending ( $t^*_b = 0.75$) was maximum for these acceleration numbers as well. This effect was later quantified by calculating the impulse generated by the bending plate during the accelerating start. Figures 3(c) and 3(d) show that as soon as the bending acceleration ceases to work and the tip reaches a constant bending velocity, the force values become comparable in the fixed, bend-up and bend-down cases. It is to be noted that the carriage acceleration is still continuing until $t^*=0.675$ in the $A_c = 1.6$ case (figure 3c). During the bending deceleration phase ( $c'$–
$c'$– $d'$) in $A_c = 1.6$ case ( $t^* = 0.82$ to $t^* = 0.95$) in figure 3(c), the force value for the bend-down case shows a sudden drop compared with straight and bend-up case. During this period, the force values show a downward trend as both bending and the carriage acceleration goes to 0. This drop in force values starts at $t^* = 0.625$, which reaches the steady-state value of $C_d = 2.5$.
The AR2 plate exhibited similar characteristics for all the three bending durations. However, the relative magnitudes of the  $C_d$ peaks, during the bending acceleration period, were lower than the AR3 plate, especially in the $A_c = 1.6$ and 3.2 cases. Since the mass of the AR2 plate was lower, the inertial forces due to acceleration are expected to be smaller than the AR3 case. In the $A_c = 0.57$ case, the AR2 plate experienced a ‘negative drag’ force, or thrust during the bend-up manoeuvre with the fastest bending ( $t^*_b = 0.75$, figure 2c). This implies that for the lower accelerations, the drag forces experienced by part of the AR2 plate above the flexion point (the part which is not bending) are lower compared with the thrust produced by the lower end of the plate (below the flexion point) during the bend-up manoeuvre. The effect of bending will be reduced if we increase the acceleration due to the fact that the upper part of the plate is producing higher drag while lower end will not produce thrust more than it can produce in the stand-still condition. The reductions in the $C_d$ values due to the bend-up acceleration were more prominent in the AR2 case compared with the AR3 case. Apart from the initial difference in the height of the peaks, the rest of the force histories leading to the steady-state value of $C_d$ were similar to that of the AR3 plate.
4.2. Impulse calculation
To quantify the effect of bending acceleration on the unsteady forces during the start-up phase, we calculate the impulse generated by the plate for the fastest bending rate ( $t^*_b = 0.75$). The total impulse was calculated by integrating the force data from $t^* = 0$ to $t^* = 0.3$, as the bending acceleration was completed by $t^* =0.3$. Hence we define impulse as
 \begin{equation} I_{bend} = \int_{t^* = 0}^{t^* = 0.3} F_{bend}\, {\rm d} t. \end{equation}
Figure 5 shows the percentage change in impulse, i.e.  $({(I_{bend} - I_{st})}/{I_{st}})\times 100$, where $I_{st}$ is the impulse in the straight or no-bending case. For the lowest acceleration ( $A_c = 0.57$), the bend-down acceleration augmented the drag by approximately 10 % and 15 % in the AR2 and the AR3 cases, respectively. Conversely, a 22 % reduction of drag was recorded due to the bend-up acceleration at the same acceleration number. With increasing $A_c$, the contribution of bending acceleration reduced for both the AR plates.

Figure 5. The percentage change in impulse due to bending for the AR2 and AR3 plates for all acceleration numbers.
4.3. Drag force comparison with analytical model
In this section, the experimental drag force results are compared with the analytical results obtained from (3.2). We have selected  $A_c = 0.57$ and $t^*_b = 0.75$ for this comparison because bending with this bending rate has the highest effect on the lowest acceleration. Figure 6(a) shows the comparison for the AR2 plate. Using $C_{m_i}$ values from Meyerhoff (Reference Meyerhoff1970), the model was able to predict the peak of the force values at the end of the acceleration to a good extent. At the start of the acceleration, due to a step response $C_d$ values are over-predicted by the model. Adding the bending acceleration and velocity along the span below flexion point we were able to capture the trends of the bending. However, it has over- and under-predicted the bending acceleration peaks for the bend-down and the bend-up cases, respectively. Similar observations were made in figure 6(b) which shows the comparison for the AR3 plate. Here also, the model was able to predict the peak of the force of the values accurately until the end of the acceleration; although, at the beginning of the motion, the model again over-predicted the $C_d$ values. A major reason behind the discrepancies between the analytical and experiments results are related to the assumption that the hydrodynamic mass coefficient is a constant during the acceleration period. In addition, we assume the flow to be inviscid. The effect of viscosity is to cause the hydrodynamics mass values to vary during the acceleration period (Grift et al. Reference Grift, Vijayaragavan, Tummers and Westerweel2019). We surmise that incorporating the effect of buoyancy, varying added mass, relative moment-of-inertia (Mathai et al. Reference Mathai, Zhu, Sun and Lohse2017) and the nonlinear drag (Mathai et al. Reference Mathai, Loeffen, Chan and Wildeman2019) will probably result in a better model.

Figure 6. Experimental and analytical force data comparison for  $A_c = 0.57$: (a) comparison of AR2 force data for $A_c = 0.57$ and $t^*_b=0.75$; (b) comparison of AR3 force data for $A_c = 0.57$ and $t^*_b=0.75$.
4.4. Development of vortices over the AR3 plate
In this section, we illustrate the effect of controlled spanwise bending on the vortex formation process during the initial start-up phase. The PIV measurements were made at the 70 % and 90 % span of both the AR3 and AR2 plate to capture the formation of the edge vortices. We note that the effect of bending is more pronounced at the 90 % span compared with the 70 % span. In addition, PIV measurements were also carried out close to the tip region, in an orthogonal plane along the midchord, to capture the formation of the tip vortex for the AR3 and AR2 plates. To manage the parameter space, we restrict our discussion of PIV results to the minimum and maximum acceleration numbers, namely,  $A_c = 0.57$ and $3.2$, and the most effective bending duration, $t^*_b = 0.75$. Due to the symmetry of the plate held at AOA of $90^{\circ }$, we focus on vortex formation from one of the edges of the plate.
Figure 7 shows the contour of the non-dimensional phase-averaged vorticity,  $\omega ^* (\omega ^* ={\omega c}/{U_{\infty }})$ for the AR3 plate at $t^* = 0.625$. The kinematics consists of the lowest acceleration, $A_c = 0.57$, and the highest bending rate, $t^*_b = 0.75$. The phase-averaged streamlines are superposed on the phase-averaged vorticity. Figure 7(a–c) represents the vorticity field obtained at the 70 % span, and figure 7(d–f) represent the vorticity field obtained at the 90 % span, for the straight, bend-up and bend-down cases, respectively. Figure 7(g–i) (figure 7) shows the growth of the tip vortices along the midchord plane. At the 70 % span, the formation of the edge vortex gets delayed during the bend-up manoeuvre (figure 7b) compared with the straight and bend-down manoeuvre (figure 7a,c). The delay in the growth of the edge vortex is more clear closer to the tip at the 90 % span (figure 7e). During the bend-up manoeuvre, the direction of the bending displacement of the plate below the flexion point is away from the incoming flow. This delays the formation of the edge vortex by reducing the velocity of the incoming shear layer that feeds the vortex with vorticity-containing fluid. Kim & Gharib (Reference Kim and Gharib2011) have also shown a similar vortex development for a flexible plate. In their experiment, due to a sudden start, the plate bent passively away from the incoming flow, which led to a delay in the vortex formation in the lower part of the plate. We note that in the present experiment, similar delay in vortex formation on the bottom part of the wing is actively controlled.

Figure 7. Growth of the wake vortices for the straight, bend-up and bend-down cases of AR3 plate at  $t^*=0.625$ and $A_c=0.57$. (a) The straight case with 70 % plane at the top, 90 % plane in the middle and tip vortex plane at the bottom. Same order is maintained for (b) bend-up case and (c) bend-down case. The tentative location of the plate is shown (with coloured dotted lines) only for a visual reference. It is neither drawn to scale, nor located at the exact coordinates.
On the other hand, during the bend-down manoeuvre the initial growth of the edge and the tip vortex is faster compared with the bend-up and straight manoeuvre (figure 7c, f,i). During bend-down, the direction of the bending velocity below the flexion point is towards the flow, which leads to a higher relative velocity on the bottom part of the plate compared with the top of the plate. The higher relative velocity leads to a higher shear layer velocity, which makes the growth of the vortex faster compared with the other two cases. Figure 8 shows the same edge and tip vortices formed over the AR3 plate, but at a later instant of  $t^* = 1.875$ when the acceleration is just completed. At the 70 % span (figure 8a,b,c) the starting edge vortex is still attached to the edge shear layer in all the cases. However, the locations of the edge vortex (denoted by the centre of the closed streamlines) are distinctly different at these two span locations based on the direction of bending. For the straight (figure 8a) and bend-down cases (figure 8c), the vortex centre at the 70 % span is away from the centreline of the wake, compared with the bend-up case (figure 8b). However, at the 90 % span, the centre of the vortex is closer to the centreline in the straight and bend-down case. The formation of the tip vortex also shows differential behaviour. In the bend-up case (figure 8h), the tip vortex is located farther downstream compared with the other two cases.

Figure 8. Growth of the wake vortices for the straight, bend-up and bend-down cases of AR3 plate at  $t^*=1.875$ and $A_c=0.57$. (a) The straight case with 70 % plane at the top, 90 % plane in the middle and tip vortex plane at the bottom. Same order is maintained for (b) bend-up case and (c) bend-down case.
The differences in the growth of the edge and the tip vortices are also evident in figure 9 which shows the non-dimensional circulation growth ( $\varGamma ^*={\varGamma }/{U_{\infty } c}$) for $A_c = 0.57$ for straight, bend-up and bend-down cases with the AR3 plate. In figure 9(a), the circulation at the 70 % span of the AR3 plate starts to grow earlier in the bend-down case. In spite of the late start, circulation of the edge vortex in the bend-up case follows a similar growth profile as the straight and the bend-down cases. However, at the 90 % span, there is significant difference in the vortex growth as shown in figure 9(b). After $t^* = 1.4$, the growth of circulation in the bend-up case is higher compared with the bend-down case. This difference can also be explained using figure 8(d,e, f). There, the edge vortex is still attached and growing for the bend-up case whereas for straight and bend-down cases the vortex structure is irregular and distorted. The reason for such irregular and distorted structure of the vortex for straight and bend-down cases is due to out-of-plane velocity introduced by the tip vortex at the 90 % plane. In these two cases, the tip vortex is closer to the plate surface compared with the bend-up case (figure 8g,h,i). Ringuette et al. (Reference Ringuette, Milano and Gharib2007) made a similar observation and showed that interaction with the tip vortex caused a drop in the circulation of the edge vortex. For the bend-down case, the tip vortex is fully developed and it is closer to the 90 % plane ( $y/c = 0$ is located at approximately 90 % span) (figure 8i). For the bend-up case, the vortex is still in the developing stage (figure 8h) and has not introduced enough out-of-plane velocities to distort the planar structure of the edge vortex at the 90 % plane. The argument that the delay in the tip vortex formation for the bend-up case is making the vortex at the 90 % plane stable enough to grow for a longer time can also be made using figures 9(b) and 9(c). Figures 9(b) and 9(c) show the circulation growth at the 90 % plane and at the midchord plane, close to the tip region, for $A_c = 0.57$. At $t^* = 1.875$ the circulation at the 90 % span is the highest in figure 9(b) for the bend-up case whereas at the tip (figure 9c) it is the lowest.

Figure 9. Wake vortex circulation plot at (a)  $70\,\%$ span, (b) $90\,\%$ span and (c) tip for $A_c = 0.57$ and AR3.
Figure 10 shows the vortex development from the AR3 plate for  $A_c = 3.2$ (maximum acceleration) at an instant, $t^* = 0.625$. Due to the higher acceleration compared with the $A_c = 0.57$ case, the incoming flow velocity is higher leading to a higher shear-layer velocity. Consequently, the strength of the start-up vortex is higher compared with the $A_c = 0.57$ case. At the 70 % span (figure 10a–c) the effect of bending is not distinctly observed as it is seen for $A_c = 0.57$, because the overall velocity of the plate is higher compared with the bending velocity at 70 % span. At the 90 % span, the bending velocity increases and it causes a delay in the vortex formation for the bend-up case and a higher growth of the vortex in the bend-down case. The growth of the tip vortex in the bend-up case is significantly lower in the $A_c = 3.2$ case, when compared with the straight and bend-down case. This difference in the growth of the edge and the tip vortex is all the more visible at a later time instant of $t^* = 1.0$, when the acceleration is completed (figure 11). In all the cases, the edge vortices appear to be detached from the edge shear layers which indicate a pinch-off. However, the locations of the centre of the vortices are different. In the bend-down case, the vortex is farther away from the centreline at the 70 % span, denoting a wider wake (figure 11c). However, at the 90 % span, the centre of the vortex is closer to the centreline (figure 11 f). The centre of the tip vortex in the bend-up case is farther away from the plate compared with the rest.

Figure 10. Growth of the wake vortices for the straight, bend-up and bend-down cases of AR3 plate at  $t^*=0.625$ and $A_c=3.2$. (a) The straight case with 70 % plane at the top, 90 % plane in the middle and tip vortex plane at the bottom. Same order is maintained for (b) bend-up case and (c) bend-down case.

Figure 11. Growth of the wake vortices for the straight, bend-up and bend-down cases of AR3 plate at  $t^*=1.0$ and $A_c=3.2$. (a) The straight case with 70 % plane at the top, 90 % plane in the middle and tip vortex plane at the bottom. Same order is maintained for (b) bend-up case and (c) bend-down case.
Figure 12 shows the growth of circulation in the edge and the tip vortices from the AR3 plate for  $A_c = 3.2$. Here also, the circulation is comparatively delayed in the bend-up case both at the 70 % and the 90 % span (figures 12a and 12b). After $t^* = 0.7$, there is a gradual increase in the circulation for bend-up case which is making the re-circulation region behind the plate grow larger during thelater stage (figure 11e). The effect of the increase in circulation which is making the wake region to grow can be seen in the force plot (figure 4c). From $t^* = 0.6$ to $t^* = 0.1$ we see the rise in force values for the bend-up case compared with straight and bend-down case.

Figure 12. Wake vortex circulation plot at (a)  $70\,\%$ span; (b) $90\,\%$ span; (c) tip for $A_c = 3.2$ and AR3; (d) Shows the $C_d$ values for $A_c = 3.2$ and $t^*_b = 0.75$ for AR3 plate.
4.5. Development of vortices over the AR2 plate
For the AR2 case, the action of bending the plate has a similar effect as seen in the AR3 case. Figure 13 shows the early development of the wake vortex for the AR2 plate at  $A_c = 0.57$ and $t^* = 0.625$. The initial growth of the edge vortex is slower for the bend-up case compared with straight and bend-down cases. For both the 70 % and the 90 % plane, the growth of the edge vortex has not started for the bend-up case, whereas for the straight and bend-down cases the initial growth is present. At $t^* =1.875$, the edge vortex is still connected to the shear layer in all the cases at the 70 % plane (figure 14a–c). The size of the vortex for the bend-up case appears to be larger compared with straight and bend-down cases at the 90 % span location due to the delayed growth of the edge vortex in the early stage and higher growth once the bending is completed. The circulation growth for $A_c = 0.57$, in the AR2 case, also shows the delayed growth of the bend-up case at the 70 % span (figure 15a) which leads to a larger edge vortex at the end of the acceleration. The growth of the edge vortex at the 90 % span (figure 14d–f) has been affected by the tip vortex in the bend-down case. Due to the faster growth of the tip vortex for the bend-down case and, a shorter distance from the tip to the 90 % plane for the AR2 plate, the out-of-plane velocities have a stronger effect on the 90 % plane. The circulation growth at the 90 % plane (figure 15b) also shows that due to high out-of-planes velocities there is no clear growth of in-plane circulation for the bend-down case.

Figure 13. Growth of the wake vortices for the straight, bend-up and bend-down cases of AR2 plate at  $t^*=0.625$ and $A_c=0.57$. (a) The straight case with 70 % plane at the top, 90 % plane in the middle and tip vortex plane at the bottom. Same order is maintained for (b) bend-up case and (c) bend-down case.

Figure 14. Growth of the wake vortices for the straight, bend-up and bend-down cases of AR2 plate at  $t^*=1.875$ and $A_c=0.57$. (a) The straight case with 70 % plane at the top, 90 % plane in the middle and tip vortex plane at the bottom. Same order is maintained for (b) bend-up case and (c) bend-down case.

Figure 15. Wake vortex circulation plot at (a)  $70\,\%$ span, (b) $90\,\%$ span and (c) tip for $A_c = 0.57$ and AR2.
Figure 16 shows the vortex development for  $A_c = 3.2$ at $t^* = 0.625$. Here also, due to the higher acceleration, the growth of the vortex seems higher at the start. At the 70 % plane, the bending has not created much difference in terms of the size and growth of the vortex (figure 16a–c). At the tip, the growth of the tip vortex has been quicker for the bend-down case (figure 16i). The growth of the tip vortex affects the spanwise vortex at the 90 % span location in the bend-down case (figure 16 f) by not letting the in-plane vortex to grow. At $t^* = 1$, the growth of the vortex at the 70 % plane is not affected by the tip vortex (figure 17a–c) but, for the 90 % plane the distortion of the edge vortex is evident for the bend-down case (figure 17 f). Although, the circulation growth results from the 70 % plane (figure 18a) show that for the bend-down case the circulation starts early and it is higher compared with the straight and the bend-up cases, whereas after ${t^* = 1}$, the circulation growth for the bend-up case is higher. The circulation growth at the 90 % plane shows that from the start, the circulation is being affected by the strong tip vortex particularly for the bend-down case (figure 18b,c). In the case of the AR2 plate, the effect of differential development of circulation and vortex size is not very distinct on the force sensor data (figure 18d). We saw a rise and a dip in the force value for the bend-up and bend-down cases, respectively, after $t^* = 0.75$ but, that effect is for small time and is mainly due to deceleration of the bending motion. In AR2, at $A_c = 3.2$, the effect of the tip vortex is strong enough to not let the vortex grow along a certain part of the span (including 90 %) which is not letting any distinct vortex characteristic affect the force values.

Figure 16. Growth of the wake vortices for the straight, bend-up and bend-down cases of AR2 plate at  $t^*=0.625$ and $A_c=3.2$. (a) The straight case with 70 % plane at the top, 90 % plane in the middle and tip vortex plane at the bottom. Same order is maintained for (b) bend-up case and (c) bend-down case.

Figure 17. Growth of the wake vortices for the straight, bend-up and bend-down cases of AR2 plate at  $t^*=1.0$ and $A_c=3.2$. (a) The straight case with 70 % plane at the top, 90 % plane in the middle and tip vortex plane at the bottom. Same order is maintained for (b) bend-up case and (c) bend-down case.

Figure 18. Wake vortex circulation plot at (a)  $70\,\%$ span, (b) $90\,\%$ span, (c) tip for $A_c = 3.2$ and AR2. Panel (d) shows the $C_d$ values for $A_c = 3.2$ and $t^*_b = 0.75$ for the AR2 plate.
4.6. Comparison of the vorticity dynamics between the AR3 and AR2 cases
The effect of AR on the growth of the edge and tip vortices are summarized below.
• For the lowest acceleration ( $A_c = 0.57$), in case of AR3, until $t^* = 2$ there is no considerable difference in the circulation growth at the 70 % span due to bending (figure 9a). The circulation in the bend-down case, however, declined afterwards. At the 90 % span the circulation in the bend-down case is lower than bend-up case after $t*=1.4$ (figure 9b).
• The circulation of the tip vortex showed that in the bend-up case the circulation values are lower for the bend-up case (figure 9c), which is exactly opposite to what is found in the edge vortices at the 90 % span in figure 9(b). This finding clearly suggests an increased interaction of the tip vortex with the edge vortex in case of the bend-up manoeuvre.
• For the lowest acceleration number, the difference in circulation between the bend-up and bend-down case is more prominent in the AR2 case even at 70 % span. (figure 15a). This difference is increased at the 90 % span. This finding suggests an increased interaction of the tip vortex with the edge vortex in the AR2 case.
• In case of the highest acceleration (
$A_c = 3.2$), the edge vortex captured at the 90 % span of the AR3 plate had a distinct upward movement away from the centreline (figure 10c) for which circulation could only be computed until $t^* =1$ in figure 12(b). In the case of the AR2 plate, the edge vortex stayed within the frame even at higher $t^*$ values (figure 16c).• In the case of the highest acceleration (
$A_c = 3.2$), the edge vortices in the case of the AR2 plate got fragmented, for which the overall circulation was reduced at 90 % span (figure 18b).• In the case of the highest acceleration (
$A_c = 3.2$), the growth of circulation in the bend-up case was more delayed at the 90 % span of the AR2 plate (figure 18b) compared with the AR3 plate (figure 12b). The circulation values during the initial part of the travel (until $t^*=1$) were less in the case of the AR2 plate for both the bend-up and bend-down cases compared with the AR3 plate.


5. Conclusion
We investigated the effect of dynamic spanwise bending on the instantaneous forces, and the flow field of an accelerating flat plate of  $AR = 2$ and ${AR} = 3$ held at a $90^\circ$ angle of attack. The bending ratio of the plate was $0.6$. Instantaneous drag forces were measured using a 6-dof force sensor, and the flow field was measured with planar PIV. Two separate manoeuvres were conducted with the accelerating plate. In one case, the plate was dynamically bent away from the flow as it was accelerated from rest – the bend-up case. In the other case, the plate was dynamically bent into the flow during acceleration – the bend-down case. The effect of different bending rates were tested on different accelerations.
The instantaneous force data showed that the direction of bending relative to the acceleration of the plate played an important role in controlling the unsteady forces. During the bend-up manoeuvre, the instantaneous drag peaks were lower compared with the straight case. However, during the bend-down manoeuvre, the initial drag forces were higher than the other two cases. Bending had a higher impact for the highest bending rate. With an increase in acceleration the effect of bending was reduced. For AR2 the bending has more effect on instantaneous force data compared with AR3. An analytical model, which added the bending acceleration to the acceleration of the plate, reproduced similar trends in the force values. The PIV results have shown that for both AR2 and AR3 the bending locally affected the growth of the wake vortices during the start-up phase. For the bend-up manoeuvre, the growth of the vortex was slower compared with the straight and bend-down manoeuvres. For AR2, the tip vortex made the flow highly three-dimensional in the lower section of the plate. In AR2 and AR3 the tip vortex at the bend-down case was closer to the plate compared with the bend-up case. This resulted in increased interaction of the tip vortex with the edge vortex. This interaction was higher in the AR2 case compared with the AR3 case for both lower and higher acceleration.
Acknowledgements
We sincerely thank the anonymous reviewers for their valuable comments, which helped us to improve our manuscript.
Funding
This work was partially supported by Office of Naval Research (ONR) (grant no. N00014-18-P-1018), monitored by Dr W. Nickerson and by National Science Foundation (CAREER award 2045767), monitored by Dr R.D. Joslin.
Declaration of interests
The authors report no conflict of interest.


 Open access