


1. Introduction
Spatial and temporal variation in temperature and composition during multi-component solidification can lead to the occurrence of natural convection. In a bottom-cooled solidification condition, the system is thermally stable in general, and natural convection is driven solely by the compositional gradients. The study of natural convection during binary alloy solidification has seen considerable progress over the past few decades. Many researchers have performed theoretical, numerical modelling and experimental studies on the transport of heat and solute in the mushy zone and the bulk fluid, predominantly in binary mixtures (Copley et al. Reference Copley, Giamei, Johnson and Hornbecker1970; Huppert & Worster Reference Huppert and Worster1985; Kerr et al. Reference Kerr, Woods, Worster and Huppert1989, Reference Kerr, Woods, Worster and Huppert1990a; Worster, Huppert & Sparks Reference Worster, Huppert and Sparks1993; Chen Reference Chen1995; Beckermann, Gu & Boettinger Reference Beckermann, Gu and Boettinger2000; Kumar et al. Reference Kumar, Dutta, Sundarraj and Walker2007; Peppin, Wettlaufer & Worster Reference Peppin, Wettlaufer and Worster2008; Chakraborty & Dutta Reference Chakraborty and Dutta2013). The study of convective flow during the solidification of ternary mixtures is a relatively recent development (Bloomfield & Huppert Reference Bloomfield and Huppert2003; Thompson et al. Reference Thompson, Huppert, Worster and Aitta2003; Kumar, Srivastava & Karagadde Reference Kumar, Srivastava and Karagadde2019). The solidifying region of a ternary mixture is the usual combination of two different porous zones, and these two zones are commonly known as cotectic and primary mush. In the primary mush, the primary component solidifies, whereas in the cotectic mush, the two components solidify simultaneously. Further, the nature of the mushy zone is known to affect convection characteristics. Therefore, understanding the role of ternary microstructures and the resulting transport phenomena during solidification in ternary systems is a definite advance over binary systems.
The existence and evolution of different solid interface morphologies in the mushy zone govern the formation of convective flow patterns and the distribution of composition and temperature. The interfacial growth kinetics influences the growth of solid interfaces, and these interfaces manifest themselves in the form of dendritic, columnar and faceted structures. Several metallic systems such as Al, Cu, In, etc., inorganic salts such as NH4Cl and Na2ClO3, and organic compounds such as succinonitrile and camphor form atomically rough or dendritic interfaces, whereas materials such as silicon, salol, KNO3, Na2SO4, etc., exhibit atomically smooth or faceted interfaces. When the microstructural and density gradients are favourable, channels of liquid having a concentration (or temperature or both) vastly different from the bulk have been observed and are termed ‘plumes’. Copley et al. (Reference Copley, Giamei, Johnson and Hornbecker1970) observed the occurrence of water-rich plumes during dendritic solidification of water–NH4Cl systems. It was suggested that the propensity of plume formation decreased with increasing strength of the applied thermal gradient. The mechanism of plume formation and scale analysis for the same were reported by Worster (Reference Worster1991). Through scale analysis, it was inferred that an increase in Rayleigh number in the mushy zone suppressed the volume flux of individual plumes. In the case of faceted growth, a few studies have reported the existence of vigorous random convective flow during freezing (Kerr et al. Reference Kerr, Woods, Worster and Huppert1990a,Reference Kerr, Woods, Worster and Huppertb,Reference Kerr, Woods, Worster and Huppertc; Guba & Worster Reference Guba and Worster2006; Kumar et al. Reference Kumar, Abhishek, Srivastava and Karagadde2020a).
In the presence of plumes, during bottom-cooled solidification of the water–NH4Cl system, the occurrence of multiple step-like stratified regions, commonly known as double-diffusive layers (DDLs) or as a thermohaline staircase (in the context of DDL formation in oceans), was observed (Radko Reference Radko2005, Reference Radko2013). A DDL typically consists of alternating low-gradient mixing layers, separated by a high-gradient stagnant interface. A DDL emerges due to differences in the thermal and compositional diffusivities of fluids. It is interesting to note that a DDL can lead to the formation of layered rocks (McBirney Reference McBirney1989; Naslund & McBirney Reference Naslund and McBirney1996). DDL formation in a side- or top-cooled configuration is not influenced by the morphology of the growing solid (Chen & Turner Reference Chen and Turner1980; Huppert Reference Huppert1981; Thompson & Szekely Reference Thompson and Szekely1988; Shih & Tu Reference Shih and Tu2009; Shih, Tu & Chiu Reference Shih, Tu and Chiu2013). Hence, the present study is confined to solidification in the bottom-cooled configuration. Magirl & Incropera (Reference Magirl and Incropera1993) observed DDL formation in the water–NH4Cl system using the shadowgraph technique. Dye injection was used to visualize the flow, and plume velocity was estimated to be of the order of millimetres per second. Chen (Reference Chen1997) suggested that the likelihood of the onset of DDL reduced with the decrease in bottom-cooled temperature. It was also suggested that a DDL would not form if the height of the cell was more than 20 cm, as the plume collapsed before reaching the top due to reduction in kinetic energy by frictional resistance of the bulk fluids. Recently, Kumar et al. reported that a minimum threshold composition of 4.1 ± 0.3 wt % NH4Cl is required for the onset of DDLs (Kumar, Srivastava & Karagadde Reference Kumar, Srivastava and Karagadde2018a). Further, visualization of the convective flow field and composition was realized using particle image velocimetry (PIV) and Mach–Zehnder interferometry. However, studies regarding natural convection with microstructural morphology during bottom-cooled solidification are limited.
The mechanisms of freezing and natural convection in ternary systems encompass the aspects of varying and multiple mushy zones, relative densities and regimes of the initial composition. Huppert & Sparks (Reference Huppert and Sparks1984) reported the effect of convection in the formation of mid-ocean-ridge basalts, wherein the system was a ternary alloy of olivine–plagioclase–pyroxene. Convection was observed to initiate when the primary solid phase (olivine) formed. On reaching the cotectic composition (olivine, plagioclase), convection was suppressed. After a gap of nearly two decades, Aitta, Huppert & Worster (Reference Aitta, Huppert and Worster2000, Reference Aitta, Huppert and Worster2001) revisited ternary solidification by using the transparent water–KNO3–NaNO3 mixture to investigate diffusion-controlled growth. A modification to the ice–KNO3 cotectic line was suggested through composition measurements. Anderson (Reference Anderson2003) developed a diffusion-controlled model for one-dimensional solidification of the ternary system to evaluate the thickness of cotectic and primary mush. Bloomfield & Huppert (Reference Bloomfield and Huppert2003) performed side-cooled solidification of water–CuSO4–Na2SO4. A scalloped profile of the solid and several DDLs were observed in the dilute solution. The increase in salt composition led to the formation of rough interfaces due to the opposing effects of thermal and compositional convection.
Thompson et al. (Reference Thompson, Huppert, Worster and Aitta2003) reported two types of heat transfer zones: a rapidly cooled convective zone, and a no-convection zone where KNO3 was the primary solidifying component during the solidification of the water–KNO3–NaNO3 mixture. A gain in temperature in the liquid was observed in the no-convection zone. This unusual behaviour was recently investigated and the occurrence of random convection causing early eutectic formation was proposed as a plausible mechanism (Kumar et al. Reference Kumar, Abhishek, Srivastava and Karagadde2020a). Anderson & Schulze (Reference Anderson and Schulze2005) developed a global conservation model to identify the growth rate of both primary and cotectic mush zones, and solid fraction in the presence and absence of convection. A stability analysis was reported for linear and nonlinear convection in the mushy zone for ternary systems to evaluate the thickness of the mushy zone and permeability (Anderson & Schulze Reference Anderson and Schulze2005). A new permeability-based Rayleigh number was also formulated to identify the strength of convection in the cotectic and primary mush. Guba & Anderson (Reference Guba and Anderson2014, Reference Guba and Anderson2017) modelled diffusive and convective transport of heat and solutes, coupled with an equilibrium thermodynamic constraint of the ternary phase diagram using linear and nonlinear stability analysis. DDL formation during side-cooled solidification of a ternary system has been mentioned by a few researchers (Chen & Turner Reference Chen and Turner1980; Bloomfield & Huppert Reference Bloomfield and Huppert2003). Recently Kumar et al. (Reference Kumar, Srivastava and Karagadde2019) reported a generalized dependence on the alloy composition for the life cycle of DDL in multi-component systems during bottom-cooled conditions.
To the best of the knowledge of the authors, no study has reported an investigation of the role of the combined existence of solidification structures (for example, dendrite + faceted) on compositional convection. This primary gap in the literature motivated us to explore the existence of contrasting flow characteristics, which have implications in several related processes, by performing bottom-cooled solidification of a ternary mixture with components that form distinctively different primary solid structures. The insights can be generic to a large number of applications, including materials processing flows, geophysical flows and flows over textured surfaces. In light of this, experiments were performed with water–NH4Cl–KNO3 mixture in all composition ranges where different modes of heat transfer and convective patterns occur, and water, NH4Cl and KNO3 are the primary solidifying elements. The convective flow was visualized using shadowgraphy (an optical technique used for qualitative flow visualization of liquid) and PIV (an optical technique used for quantifying flow velocity). The velocity, temperature and composition measurements provide quantitative insights into the mechanisms of initiation and stabilization of natural convection patterns such as DDL. A linear stability analysis has also been reported for obtaining the scales of length and velocity associated with convection in the ternary system. The present work reports a new analysis and understanding of natural convection during freezing of multi-component systems.
2. Ternary phase diagram and solidification characteristics
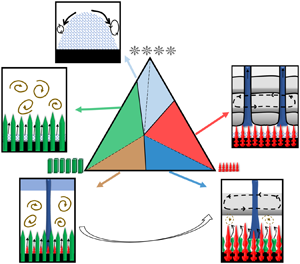
Figure 1 represents the plan view of a simple ternary phase diagram, where C and A are the heaviest and lightest components, respectively, and EAB, EBC, ECA and E are the eutectic points of the corresponding binary phase diagrams of AB, BC and CA, and the ternary phase diagram of ABC, respectively. The joining of binary eutectic to ternary eutectic is termed the ‘cotectic line’ (two components begin to solidify simultaneously). Based on primary solid morphology and the residual liquid density, the ternary phase diagram is divided into six regimes (i.e. Ia, Ib, IIa, IIb, IIIa and IIIb; see figure 1 and table 1) (Aitta et al. Reference Aitta, Huppert and Worster2001; Kumar et al. Reference Kumar, Srivastava and Karagadde2019). The density of the residual liquid (heavy or light) is measured relative to that of the bulk composition.

Figure 1. Plan view of the ternary phase diagram of water–NH4Cl–KNO3 (FactSage; Bale et al. Reference Bale, Chartrand, Degterov, Eriksson, Hack, BenMahfoud, Melançon, Pelton and Petersen2002, Reference Bale2016; Pelton Reference Pelton2018), where  ${\rho _{\textrm{KN}{\textrm{O}_\textrm{3}}}} \gt {\rho _{\textrm{N}{\textrm{H}_\textrm{4}}\textrm{Cl}}} \gt {\rho _{{\textrm{H}_\textrm{2}}\textrm{O}}}$ ( $\rho$ is density). Path O–P–E shows the evolution of rejected solute in the liquid, where O is the initial composition.
Table 1. The regimes based on initial composition values, the corresponding primary and cotectic solidifying morphology, and the residual liquid density during bottom cooling of the water (ice)–NH4Cl (dendrites)–KNO3 (facets) ternary system. Note that the density of the residual liquid (heavy or light) is indicated relative to that of the bulk composition.
The composition of the residual liquid, traced by the tie line ‘A–O–P’, was observed to reach the cotectic line at point ‘P’, starting with the initial composition at ‘O’ (A as primary solid, figure 1). At ‘P’, two solids grow simultaneously, and the liquid is enriched with one component, which follows the path ‘P–E’ (figure 1). Finally, the mixture attains the composition ‘E’ (ternary eutectic composition) and solidifies to form the eutectic solid.
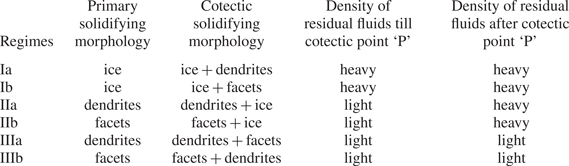
Four separate zones, namely, liquid, primary mush, cotectic mush and solid, are observed during the solidification of the ternary system, as shown in figure 2. The microstructure in these zones depends on the growing solid components. For example, a composition can be chosen in the ternary system (A, B and C), where A is the primary solidifying component. The liquid solidifies as A in the primary mush, and the other two (B + C)-enriched mixture is rejected into the liquid. The interface temperature of the primary mush can be identified as local liquidus (Ti). Below the primary mush, component B solidifies simultaneously with A + B in the intergranular spacing of the primary mush zone, and C is rejected, and this zone is termed ‘cotectic mush’. The interface position of the cotectic mush (hC) corresponds to the cotectic temperature (T C). Below the cotectic mush, all the components solidify in the intergranular region of cotectic mush and become fully solid, advancing as the eutectic front (hE). The interface temperature of the eutectic front is the eutectic temperature (TE).
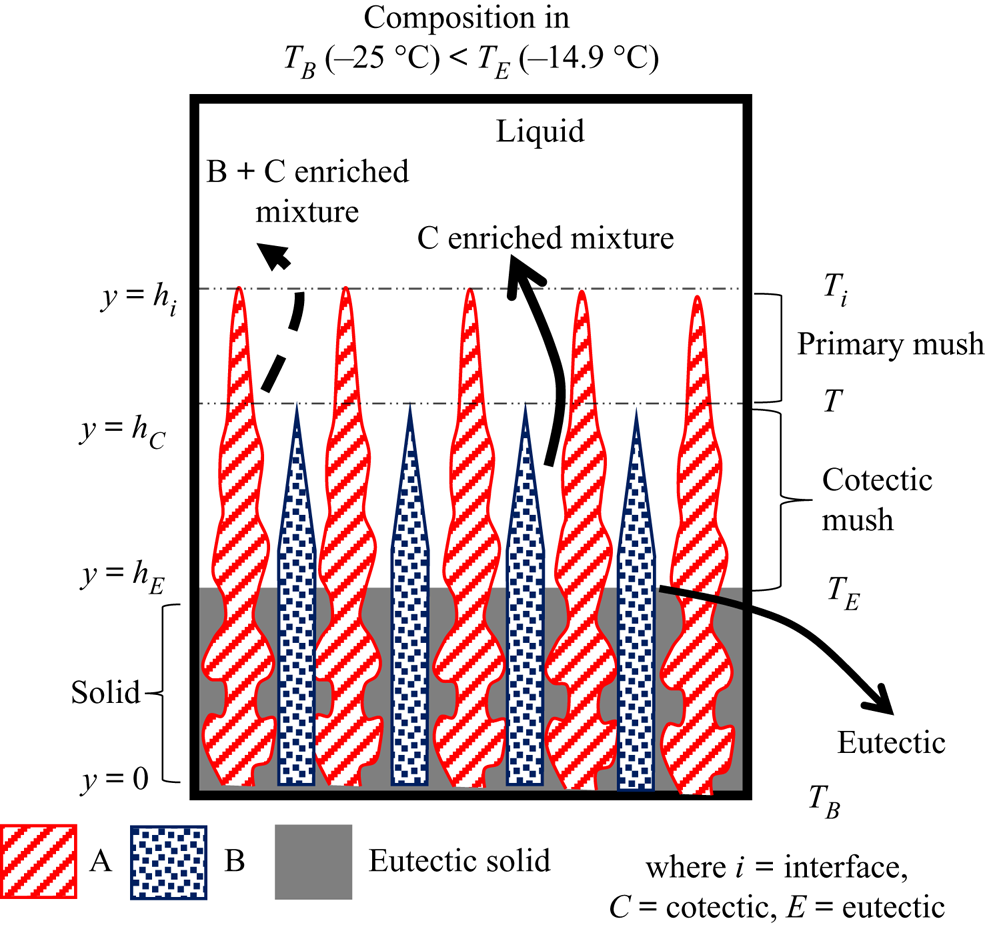
Figure 2. Schematic of phases during bottom-cooled solidification of the ternary mixture.
3. Experimental details
3.1. Material data
For the study of convective flow phenomena during solidification of the ternary mixture, different compositions of the water–NH4Cl–KNO3 system (phase diagram from FactSage®; Bale et al. Reference Bale, Chartrand, Degterov, Eriksson, Hack, BenMahfoud, Melançon, Pelton and Petersen2002, Reference Bale2016; Pelton Reference Pelton2018) were used. The densities of water, NH4Cl and KNO3 are 1, 1.57 and 2.12  $\textrm{g cm}^{-3}$, respectively. The ternary eutectic temperature is −14.9 °C, and the eutectic composition is water–16.4 wt % NH4Cl–20.5 wt % KNO3. In the ternary system, water–19.7 wt % NH4Cl and water–9 wt % KNO3 are the binary eutectic compositions, and −13.9 °C and −2.84 °C are the corresponding eutectic temperatures (Beckermann & Wang Reference Beckermann and Wang1996; Aitta et al. Reference Aitta, Huppert and Worster2000). NH4Cl and KNO3 grow as dendritic and faceted solids, respectively.
3.2. The apparatus
For the study of bottom-cooled solidification of ternary mixtures, a rectangular solidification cell was made of 8 mm thick Perspex. The inner dimension of the solidification cell was 110 mm in height, 70 mm in width and 50 mm in thickness, as shown in figure 3. To eliminate heat losses and condensation problems during bottom-cooled in situ solidification experiments, a similar rectangular cavity (cover cell) was placed over the solidification cell. A copper plate was attached at the bottom of the cell and was maintained at a constant temperature using a Peltier module. The bottom copper plate was maintained at −25 °C (below the ternary eutectic temperature). The Peltier temperature was controlled by a Peltier TEC controller (Electron Dynamics Ltd, TCM Unit), DC power supply (Aplab Ltd, L3205), heat exchanger and circulating bath (Julabo, CORIO CD-300F). The cold side of the Peltier was attached to the copper plate, and the hot side was attached to a heat exchanger. The temperature of the heat exchanger was maintained by a continuous flow of coolant using a circulating bath.
Figure 3. Schematic of the solidification cell.
Shadowgraphy is a density-based optical technique, and this was chosen to observe the density-driven flow in the liquid. In the shadowgraph set-up (figure 4), white light (250 W) was collimated using a plano-convex lens and passed through the solidification cell. The change in density during solidification deviates the collimated beam, and the deviated beam was again focused on a charge-coupled device (CCD) camera using another plano-convex lens. The images captured by the CCD cameras were stored on a computer. Microstructures in the porous zone were captured using a portable Dino-lite microscope.
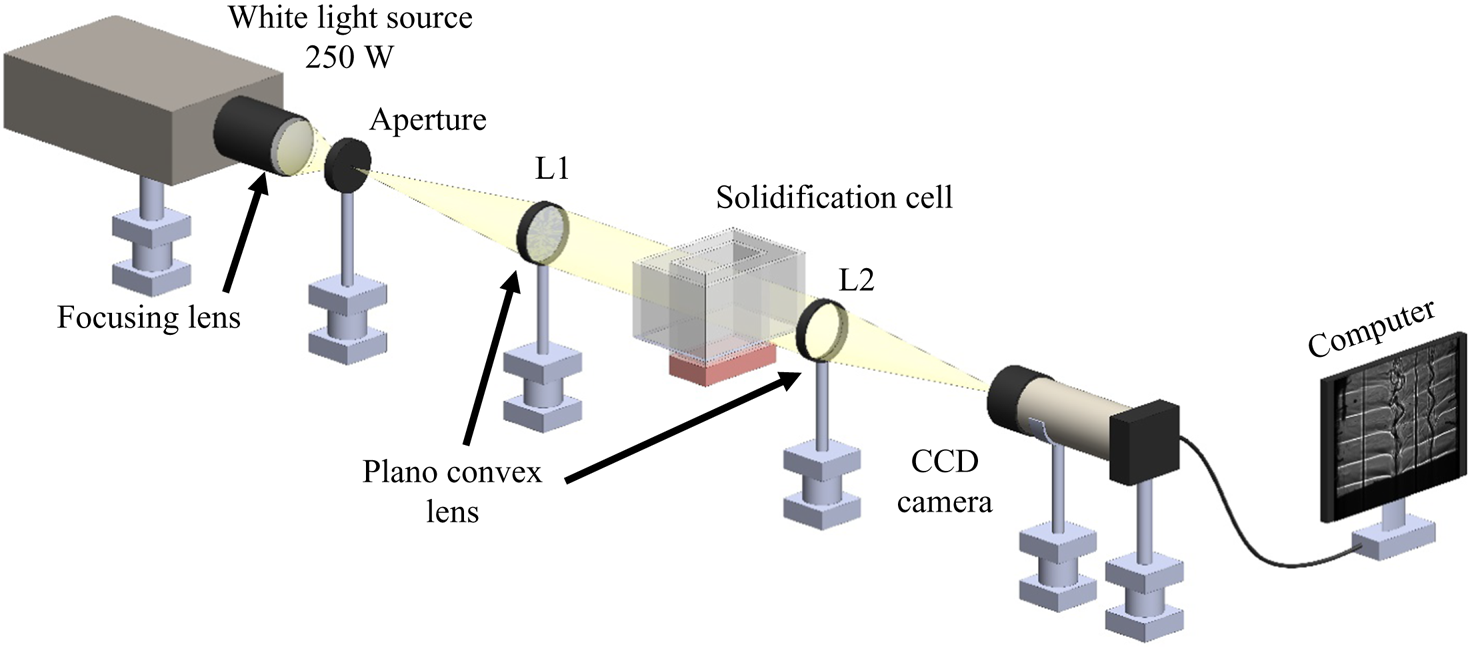
Figure 4. Schematic of shadowgraphy.
For the quantification of flow during the solidification process, a two-dimensional PIV (Microvec Pte) system was used. A diode-pumped solid-state laser (SM-SEMI-10W, λ = 532 nm), synchronizer and CCD camera were the components of the PIV system; and 10 μm hollow glass spheres were used as neutrally buoyant seeding particles. The resolution of the PIV image was 2456 pixel × 2048 pixel. For the velocity measurements, the Microvec software module was employed. For the calculation of the flow field, 64 pixel × 32 pixel were chosen as the interrogation window. In the present study, there were two velocity scales: (a) high velocity (~1 mm s−1) in the plume and (b) low velocity in bulk or convection in DDL (~0.1 mm s−1). For high-velocity cases such as the plume, the pulse width of 10 to 40 ms was used, whereas for DDL or low-velocity cases, it was 250–1000 ms. More details of the employed PIV system can be obtained from references (Kumar, Srivastava & Karagadde Reference Kumar, Srivastava and Karagadde2017, Reference Kumar, Srivastava and Karagadde2018b, Reference Kumar, Srivastava and Karagadde2020b).
3.3. Measurements
K-type thermocouples (accuracy of ±0.15 °C) were used for recording temperatures at nine locations along each vertical sidewall at different heights (figure 3). During experiments, the temperature data were collected in the computer via a datalogger (Pico Tech, TC-08).
For the measurement of salt composition in ternary (water–NH4Cl–KNO3) mixtures, samples were extracted during experiments at different locations, and the composition was measured using inductively coupled plasma–atomic emission spectrometry (ICP-AES). The extracted sample was diluted to a 1 : 5000 ratio, and the compositions of K and Cl were measured. Similarly, diluted samples of known composition were used to establish a calibration curve between readings and compositions of K and Cl using AES. This calibration curve was employed to measure the actual composition of the extracted sample.
In the ternary water–NH4Cl–KNO3 system, the densities of water, NH4Cl and KNO3 are 1, 1.57 and 2.11  $\textrm{g cm}^{-3}$, respectively. The density of the ternary mixture (water–KNO3–NH4Cl) was established using the following relationship with different initial compositions of KNO3 and NH4Cl using a density meter (Anton Paar, DMA 35 Basic):
 \begin{align}\rho & = \textrm{1001}\textrm{.25487} + \textrm{2}\textrm{.690710747}N + \textrm{6}\textrm{.383286864}K + 0.\textrm{000362281}{N^\textrm{2}}\nonumber\\ & \quad + \textrm{0}\textrm{.01662}{K^\textrm{2}} + \textrm{0}\textrm{.023857634}NK\textrm{,}\end{align}
where  $\rho$ is density (kg m−3), N is the composition of NH4Cl (wt %) and K is the composition of KNO3 (wt %). In the mixture, the solutal expansion coefficient of KNO3 (~0.0065 wt %−1) is approximately 2.2 times higher than the NH4Cl solutal expansion coefficient (~0.0029 wt %−1).
4. Results and discussion
The present section has been divided based on regimes in the ternary phase diagram during bottom-cooled solidification. The sections contain detailed information for transport phenomena in different regimes using shadowgraphy, PIV-based velocity data, temperature measurements and microstructure information. The results section also contains the scale analysis for convection using linear stability analysis. The case of solidification without any convection in the ternary mixture, wherein water freezes as the primary solid, and the other heavier components are rejected into the liquid, is reported in the appendix.
4.1. Random convection: presence of facets in the primary mush
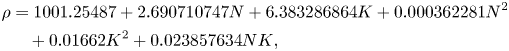
Facets (KNO3) are the primary solidifying structures in the primary mush (figure 5a), and the water–NH4Cl mixture is rejected, which has a lower density compared to the bulk fluid. In cotectic mush, the water–KNO3 mixture solidifies simultaneously, and NH4Cl-enriched mixture is rejected into the bulk fluid (figure 5a). The bulk fluid reaches near-cotectic composition, leading to a diffusion-dominated solidification. For the study of random convection, the water–5 wt % NH4Cl–21 wt % KNO3 case was chosen as the initial composition in regime IIb, and it is marked by a dot on the phase diagram in figure 5(b).
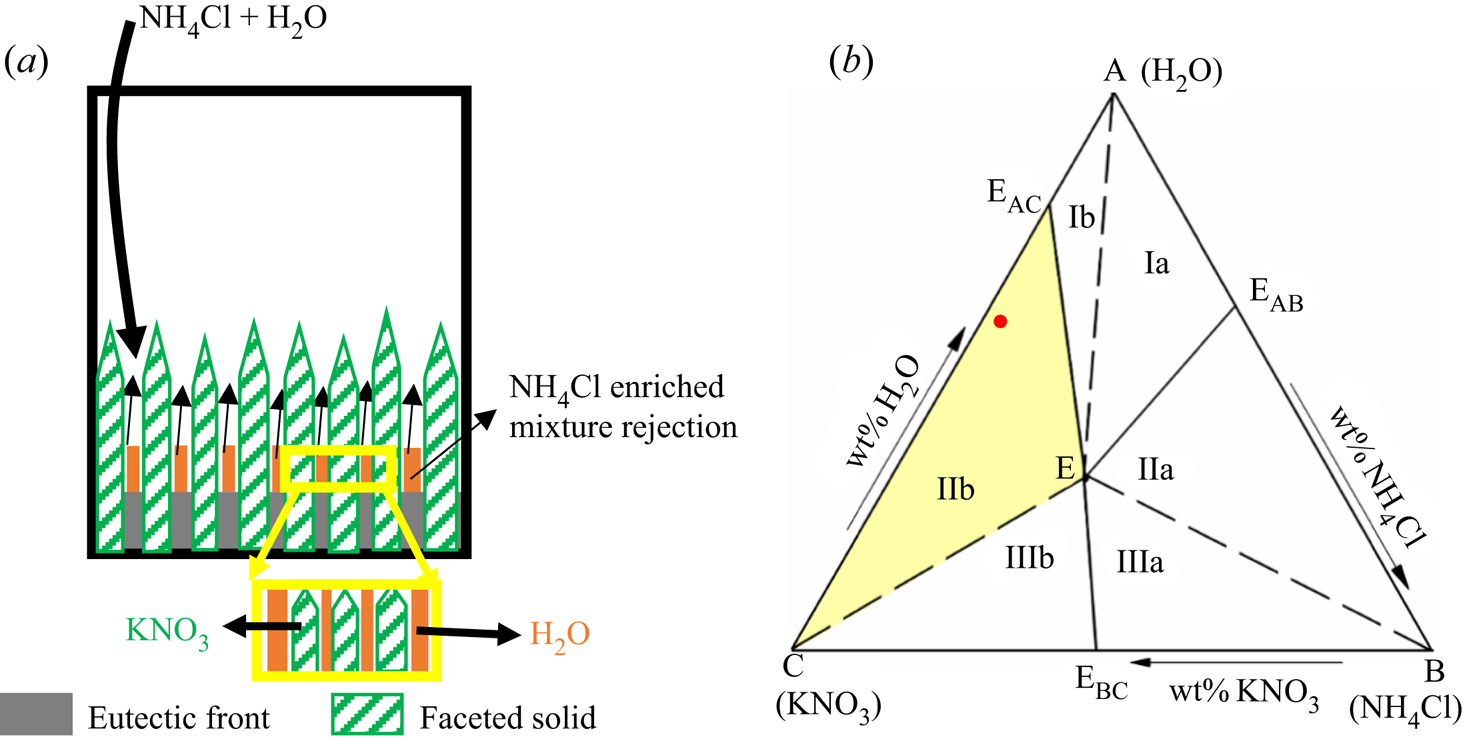
Figure 5. (a) Schematic of growing microstructure in the porous zone, where facets are primary solid and water solidified with facets in the cotectic mush. (b) The ternary phase diagram of water–NH4Cl–KNO3; the red dot marks the initial composition in regime IIb.
Figure 6 shows the evolution of the flow field during the bottom-cooled solidification of water–5 wt % NH4Cl–21 wt % KNO3. The flow of low-density rejected mixture (figure 6a) displayed random convective flow without any well-defined patterns such as plumes. The convective velocity of random convection was more than the plume velocities (Kumar et al. Reference Kumar, Abhishek, Srivastava and Karagadde2020a). Faceted solid was observed in the primary mush, as shown in figure 6(d). The random convective flow essentially homogenized the composition and temperature of the liquid in the cell and reduced the bulk composition to near-cotectic composition within 230 min. This cotectic composition was also near to the eutectic of the ternary mixture. The composition of the bulk fluid was observed to be uniform, and the composition (water–15 wt % NH4Cl–20 wt % KNO3) near the eutectic was observed at 600 min (figure 6c).
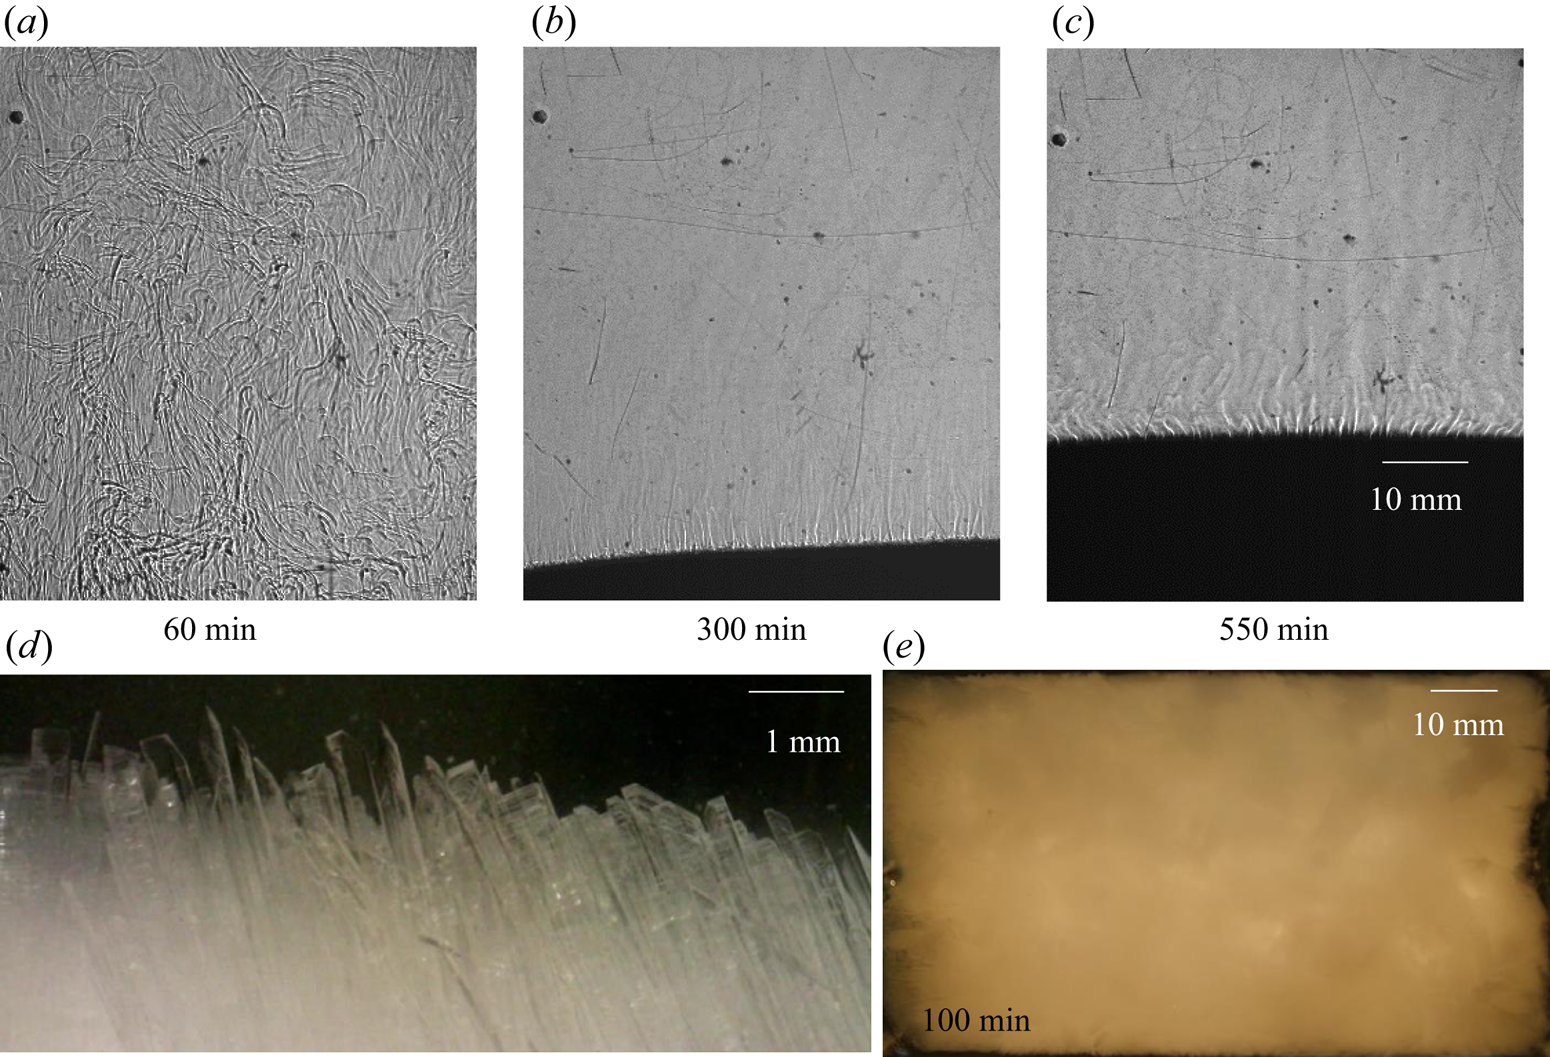
Figure 6. Convective flow observation using shadowgraphy for water–5 wt % NH4Cl–21 wt % KNO3 (regime IIb): (a) random solutal convection at 60 min; (b) suppression of random convection due to the composition reached near cotectic composition, which was near the ternary eutectic at 300 min; (c) eutectic growth at 550 min; (d) faceted microstructure in primary mush; and (e) top view of the solid interface (water–5 wt % NH4Cl–21 wt % KNO3) at 100 min, which shows no plume location in the solid.
4.1.1. Temperature measurements during random convection
The temperature measurements (figure 7) in the liquid can be divided into three zones: convection-dominated, transition and conduction-dominated zones. The high solid fraction (~0.84, calculated from figure 6d) in the primary mush during faceted growth essentially lowers the average permeability (K ~ 10−12, calculated by Carman–Kozeny equation). In the presence of the low permeability (low convective strength or Rayleigh number in the mushy zone) and a reduced length scale of the mushy zone, less dense solute was transported to the bulk fluid without creating a stabilized plume (which also needs a considerable spacing between grains and time scale to stabilize). In the cotectic mush, the presence of water with faceted solid did not provide sufficient permeability for plume formation. Hence, no plume location was observed during the faceted growth (figure 6e), resulting in random convection (rejected solute without any well-defined/structured flow pattern) in the bulk, eventually homogenizing the bulk composition and thermal field, and the temperature reduced drastically (figure 7). This process is thus referred to as ‘convection-dominated zone’.
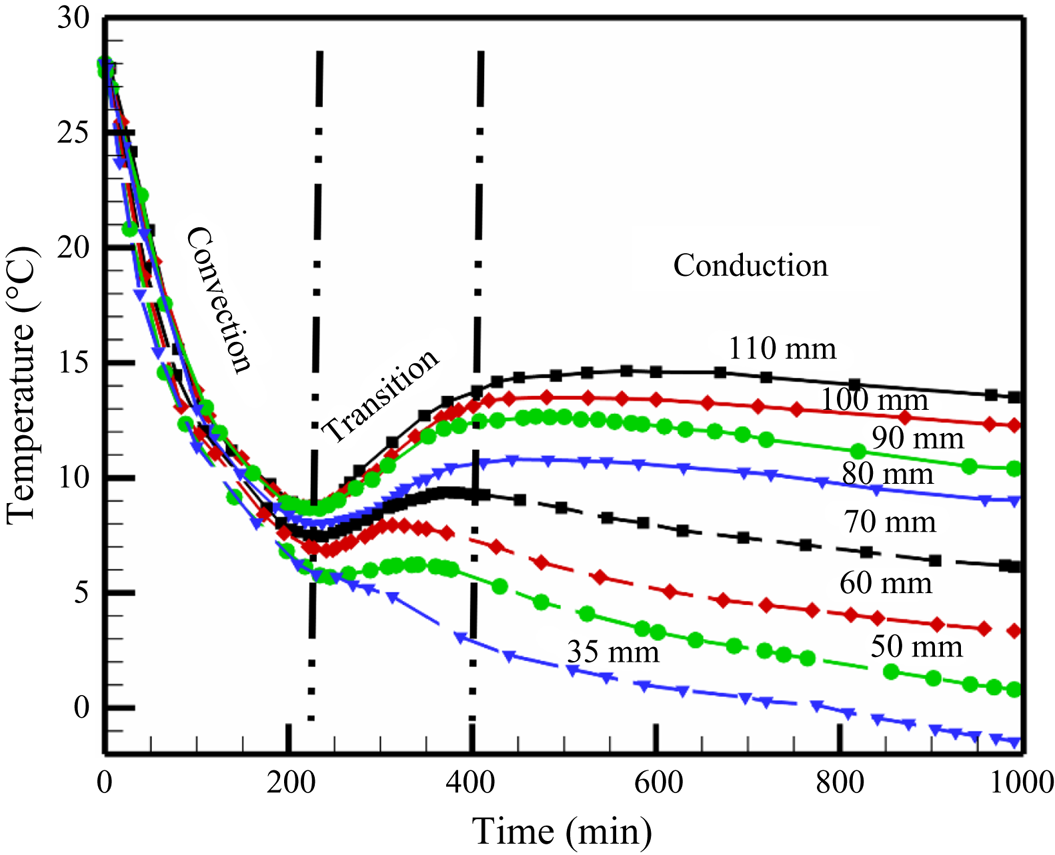
Figure 7. Temperature profile in the liquid during solidification of water–5 wt % NH4Cl–21 wt % KNO3.
Further, due to the high solid fraction of faceted content in the mush, the liquid quickly approaches the cotectic composition, which was also near-eutectic composition at the early stages of the experiment (near 230 min). When the liquid was nearly at eutectic, and the gradients in liquid were negligible (due to random homogenous mixing), compositional convection was reduced. At the same time, a sudden increase in growth rate was observed at the eutectic interface (due to conduction-dominated solid growth). Meanwhile, weaker and localized compositional convection maintains a low thermal gradient near the interface (‘transition zone’ in figure 7). Owing to the almost negligible thermal gradient and composition (near the eutectic) ahead of the interface along with the increased growth rate of eutectic solid, a large amount of latent heat at the solid–liquid interface was created (this is somewhat similar to recalescence). At this point in time, a temperature rise can be observed from the experimental data and is named as the ‘transition zone’. Further, the diffusion was established (conduction-dominated zone), and an increased thermal gradient was set in the bulk liquid (conduction-dominated zone, figure 7). Finally, when the composition reached purely eutectic, and no localized solutal convection exists, the liquid temperature gradually started decreasing (conduction-dominated zone, figure 7). Additionally, with lowering the bottom temperature, more eutectic solid grows after the reduction of convection and caused a larger gain in the bulk liquid temperature. A similar temperature profile was reported by the present authors during the solidification of faceted growth in the binary system of water–KNO3 (Kumar et al. Reference Kumar, Abhishek, Srivastava and Karagadde2020a), where the mechanisms of random flow and gain in temperature after convection are discussed in detail.
4.2. Plume convection: presence of dendrites in the primary mush
4.2.1. Dendrites in the primary mush
NH4Cl is the primary solidifying component (forming dendritic solid structures) in the primary mush (figure 8a), and water solidifies with NH4Cl in cotectic mush (figure 8a). A water–KNO3-enriched mixture, which is lower in density compared to the bulk fluid, is rejected from primary mush, whereas KNO3 is rejected from cotectic mush into the bulk (figure 8a). Eventually, the bulk fluid reaches the near-cotectic composition, leading to a diffusion-dominated solidification. For the study of such phenomena, the water–27 wt % NH4Cl–5 wt % KNO3 case was chosen as the initial composition from regime IIa, and it is marked with a dot on the phase diagram in figure 8(b).

Figure 8. (a) Schematic of evolving microstructure in the porous zone for dendrite as primary solid and water solidified with dendrites in the cotectic mush. (b) The red dot marked in the ternary (water–NH4Cl–KNO3) phase diagram is the initial composition in regime IIa.
4.2.1.1 Qualitative observations of flow behaviour
Figure 9 shows the evolution of convective flow in the presence of dendrites in the primary mush using a shadowgraph. In the presence of dendritic solid (inset of figure 9a), compositional convection takes place in the form of plumes (figure 9a). Since the thermal and compositional diffusivities are considerably different (the ratio between mass and thermal diffusivities is of the order of 10−2), the composition of the plumes was preserved, while the plumes gained heat during upward motion. Non-uniformly distributed plumes and their uneven thermal interaction with the surroundings led to transport in the lateral direction driven by thermal convection (temperature measurement in the left and right sides at different horizontal planes is plotted in figure 10). The existence of the resulting horizontal thermal gradient was observed to be the primary reason behind the formation of DDLs (figure 9b).
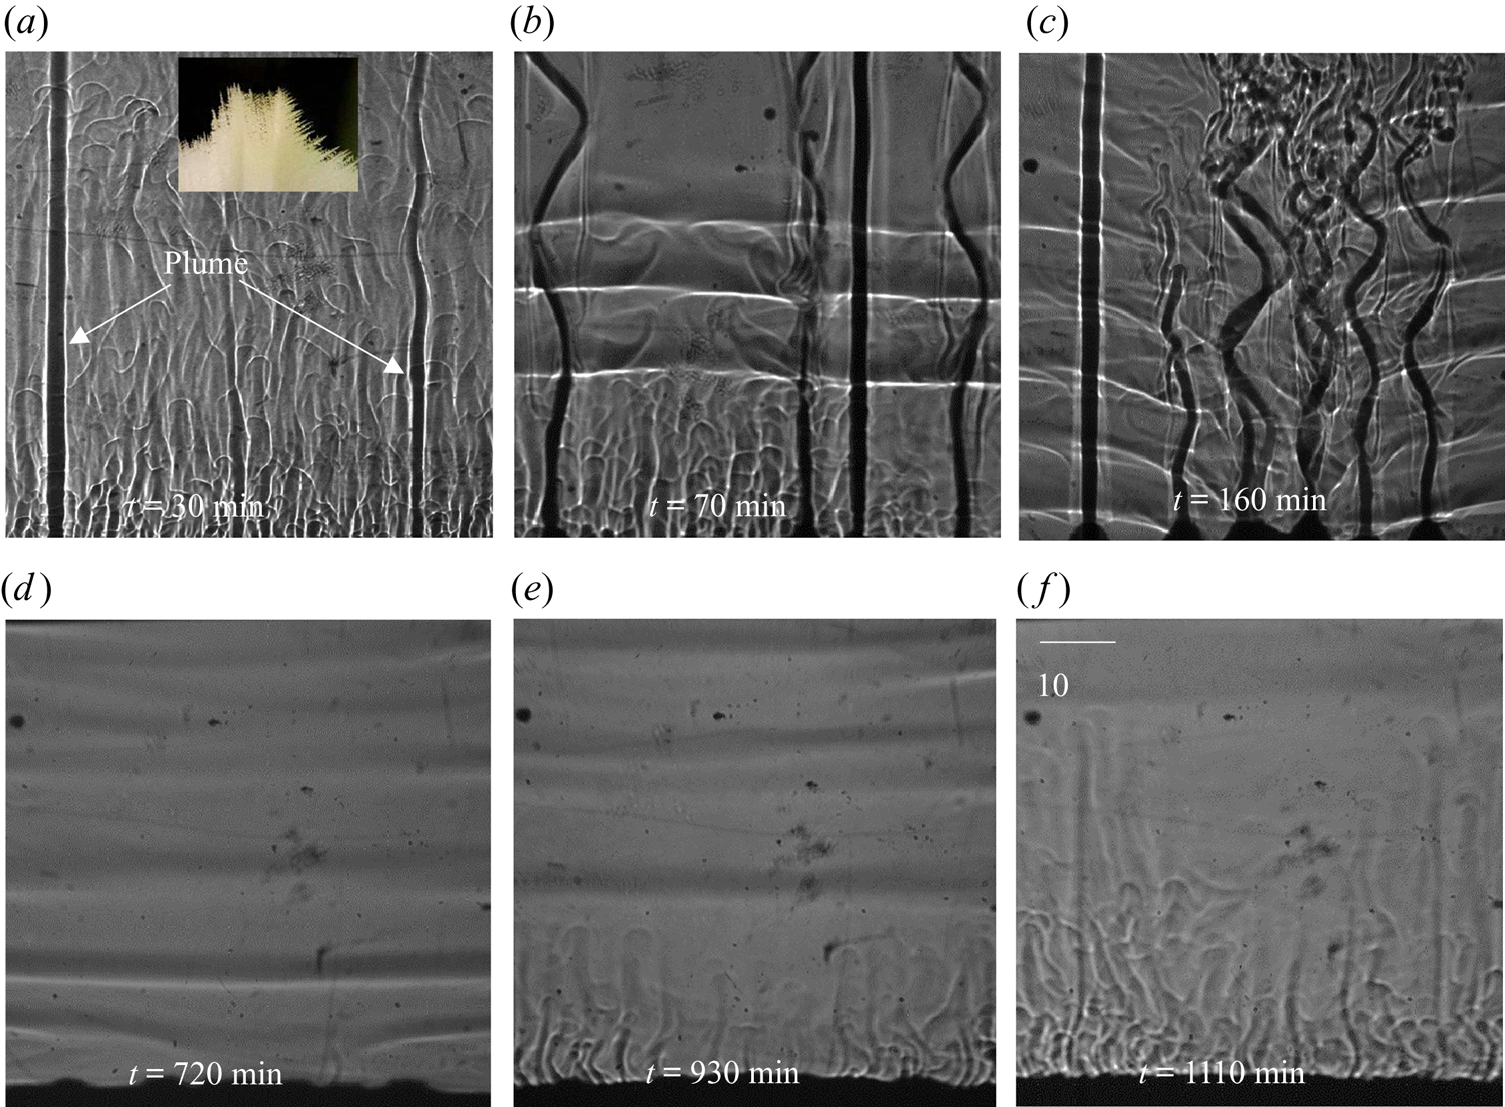
Figure 9. Evolution of the DDLs during bottom-cooled solidification of ternary solutions (water–27 wt % NH4Cl–5 wt % KNO3): (a) local solutal convection and plume formation at 30 min; (b) the onset of DDLs at 70 min; (c) development of DDLs at 160 min; (d) disappearance of plumes at 720 min; (e) domination of localized solutal convection at 930 min; and (f) disappearance of DDLs at 1110 min.
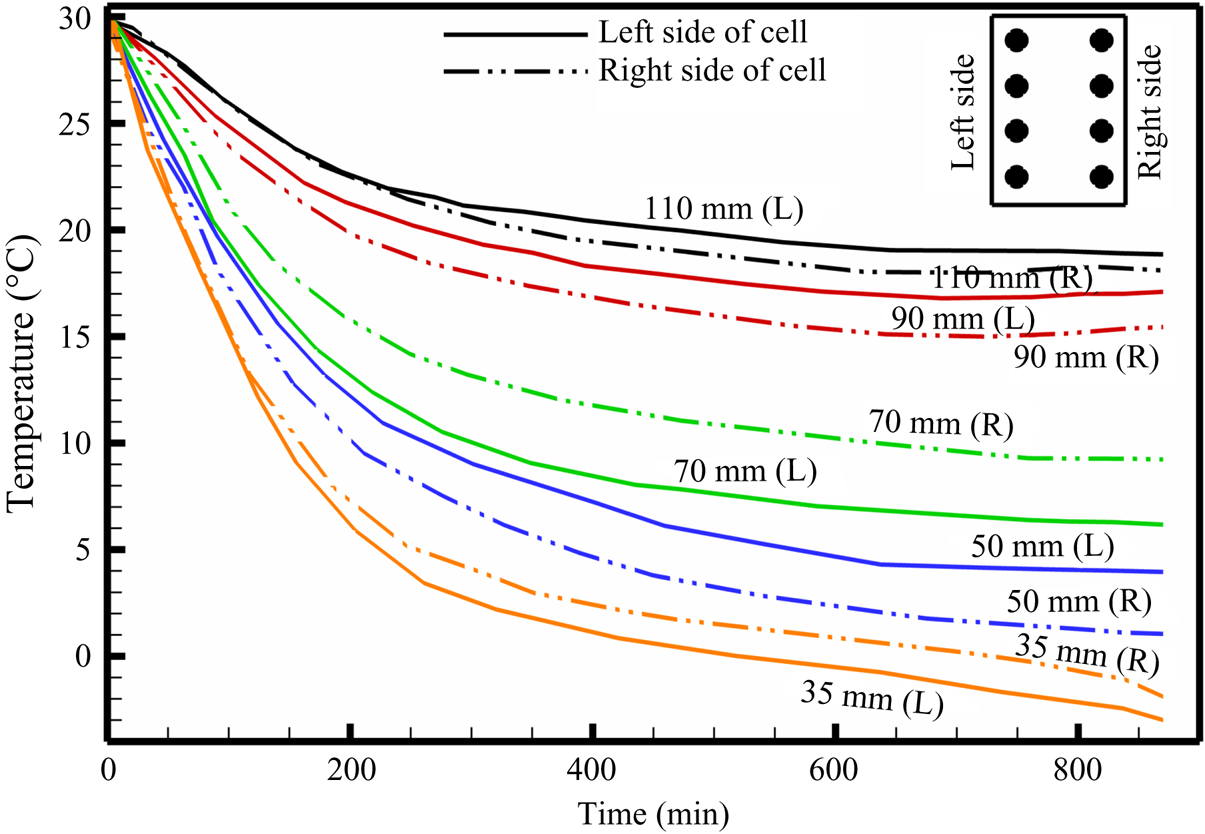
Figure 10. Temperature plot during bottom-cooled solidification of water–27 wt % NH4Cl–5 wt % KNO3. The representative location of thermocouples along the left and right sides of the cell are shown in the inset (top right).
At the onset of DDLs in the present ternary system, the first  $(R{a_{{S_{1\_Exp}}}} = g{\beta _1}\Delta {S_1}{h^3}/\nu {\kappa _{{S_1}}})$ and second $(R{a_{{S_{2\_Exp}}}} = g{\beta _2}\Delta {S_2}{h^3}/\nu {\kappa _{{S_2}}})$ compositional Rayleigh numbers were 1.5 × 10⁹ and 1.3 × 10⁹ (at 75 min), respectively, whereas the thermal Rayleigh number was 10.9 × 10⁶ (discussed in subsequent sections). The literature suggests that the onset of DDLs required a threshold composition convection (composition Rayleigh number = 1.5 × 10⁹) and thermal convection (thermal Rayleigh number = 13.6 × 10⁶) (Kumar et al. Reference Kumar, Srivastava and Karagadde2018a, Reference Kumar, Srivastava and Karagadde2019).
The composition of bulk liquid at the top of the cell was found to be water–20.5 wt % NH4Cl–7.5 wt % KNO3. Observations of the DDL in the central region of the cell are reported for the first time (figure 9b), whereas a DDL occurred from the top in binary cases (Kumar et al. Reference Kumar, Srivastava and Karagadde2018a). As the compositional convection (plume) increases, the localized compositional convection near the solid–liquid interface was suppressed, as shown in figure 9(c). Hence, a DDL was able to sustain near the solid–liquid interface region (figure 9c). This can be verified by the development of a temperature difference at 35 mm after 150 min, as shown in figure 10. With time, the plume disappeared (as the composition reached towards the cotectic), and this led to a decrease in the strength of the DDL (greyscale intensity of interface), as shown in figure 9(d). In the absence of plumes, localized compositional convection reappeared in the cell (figure 9e), which further disrupts the weak DDLs and homogenize the composition within the bulk. Beyond 1110 min (figure 9f), DDLs disappeared from the cell, and the composition of fluid near the solid–liquid interface was water–20.85 wt % NH4Cl–9.8 wt % KNO3, which is near the cotectic line on the phase diagram.
In summary, the formation of a DDL in the central regions of the cell can be attributed to relative density differences between the two rejected components. The prior studies of double-diffusive convection predominantly showed a DDL emerging from the top of the cell, due to the presence of only one solute component in the mixture (Kumar et al. Reference Kumar, Srivastava and Karagadde2018a). The presence of heavier component rejection shows a tendency of settling down, which appeared to disturb the later thermal gradients at the top of the cell and leads to suppress the formation of a DDL in the top region.
4.2.1.2 Quantification of the flow field
Different projections of the velocity field were captured during the solidification of water–27 wt % NH4Cl–5 wt % KNO3 (regime IIa) using PIV. The velocity contours in the front plane (x–y plane,  $(\sqrt {{u^2} + {v^2}} )$) and the top plane (x–z plane, $(\sqrt {{u^2} + {w^2}} )$) are shown in figures 11(a,d) and 11(b,c,e,f), respectively. Figure 11(a) shows the plume velocity contours and vectors at 60 min, and, except for the plume, negligible velocity was observed in the bulk. The bulk fluid and the plumes were captured 20 mm below the free surface, as shown in figure 11(b). The free surface is at the highest position of liquid in the solidification cell.
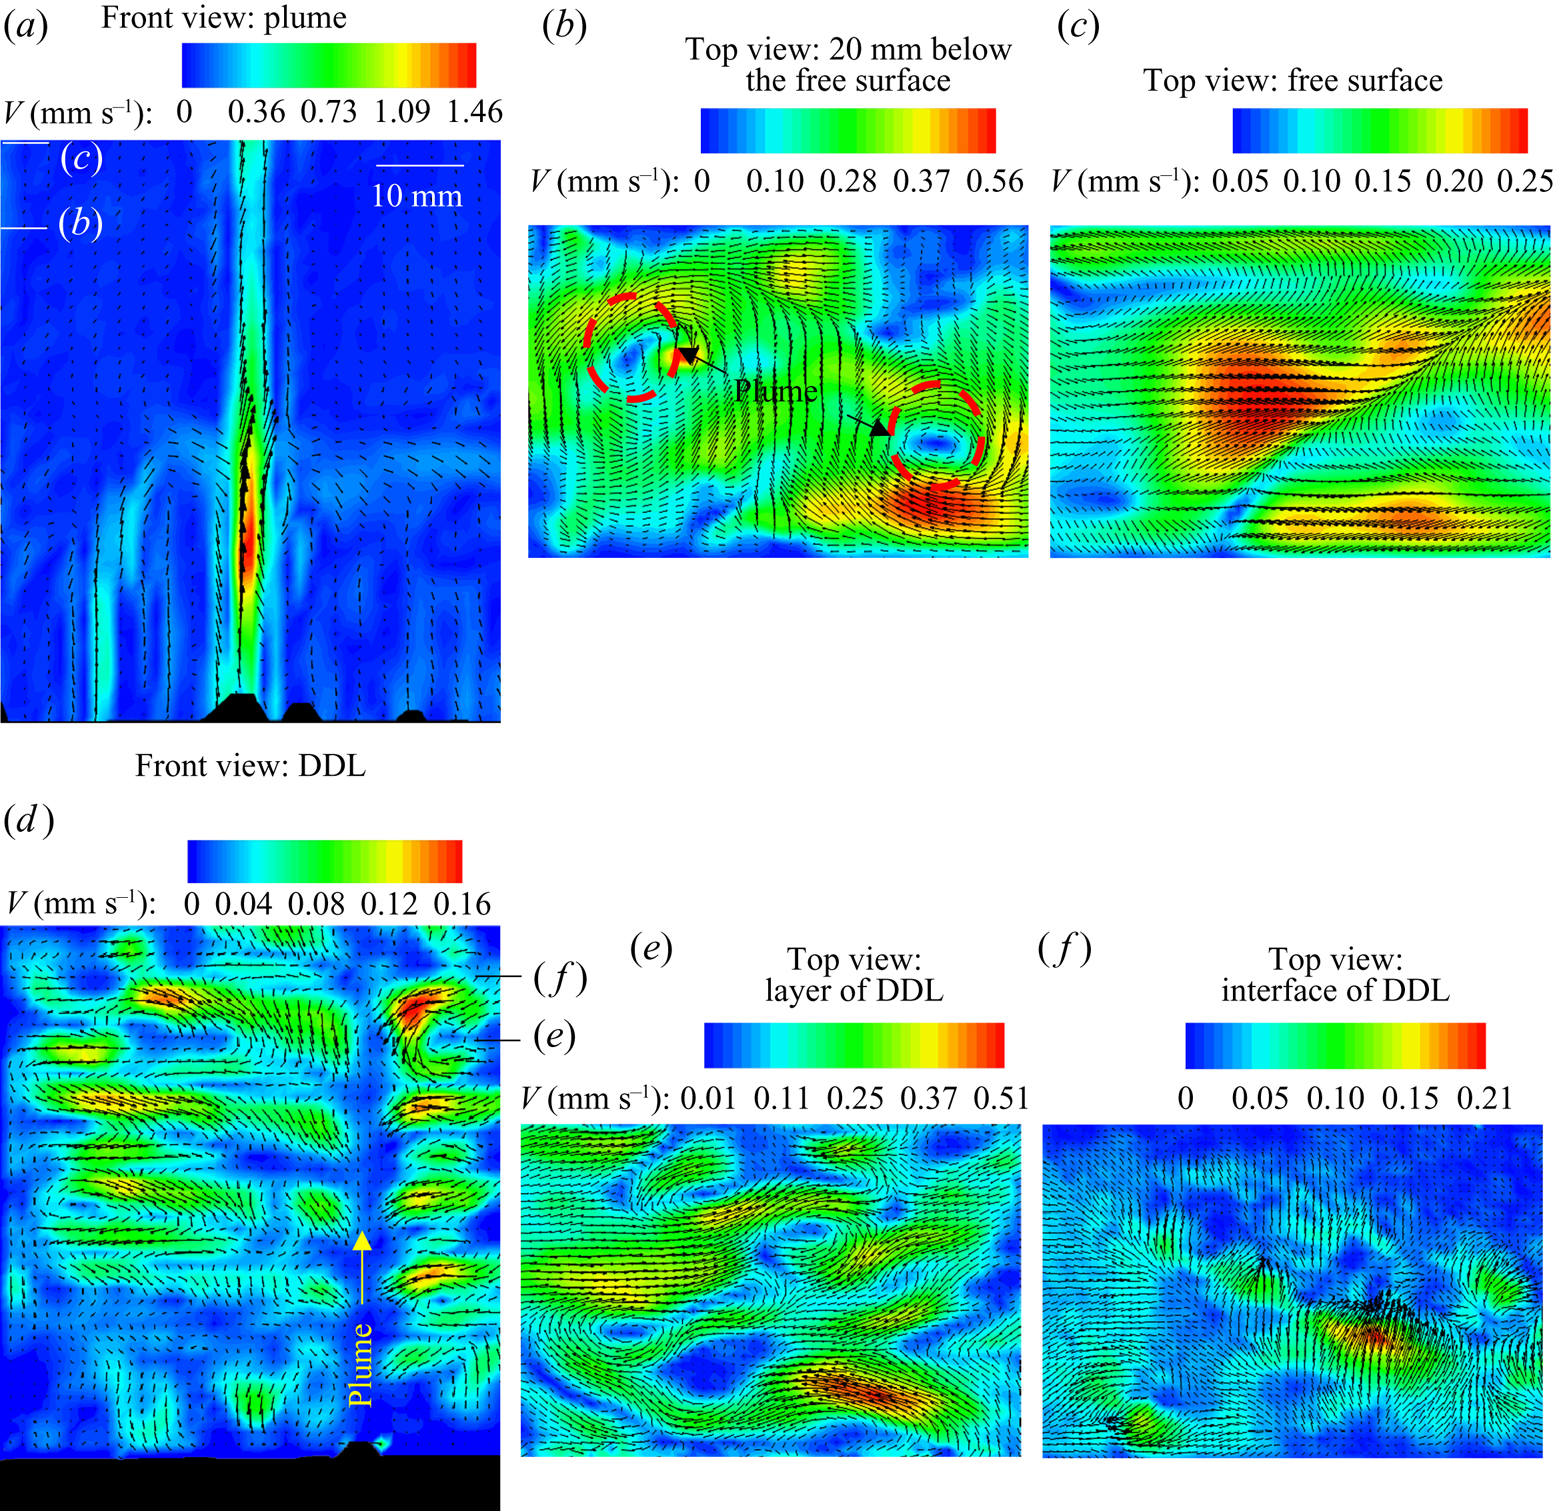
Figure 11. (a,d) Front views (x–y plane): convective velocity contours and vectors of (a) plume and bulk fluid at 60 min and (d) DDLs. (b,c,e,f) Top views (x–z plane): convective velocity contours and vectors of (b) bulk fluid at 20 mm below from the top free surface, (c) free surface, (e) the layer in a DDL and (f) the interface of a DDL. The representative position of the laser sheet during the experiment for panels (b,c,e,f) are marked by the lines in panels (a,d).
The horizontal laser sheet was located 20 mm below the free surface of the liquid for easier identification of mixing and the location of plumes. The low-velocity regions at plume locations (plumes are marked by dashed circles in figure 11b) are due to the two-dimensional images captured at a plane perpendicular to the plume. Around the plume, an inward spiral circulation of flow was observed, indicating the plume enlargement flow phenomenon (figure 11b). At the free surface, the plume mixed with bulk fluid, and these convective patterns were observed in figure 11(c). The downward (y direction) velocity at the top of the cell is of the order of 10−2 mm s−1 (the bulk has very low downward velocity, bluish colour contour in figure 11a). However, the mixing between the bulk and the plumes at the free surface creates a horizontal velocity in the x (u) and z (w) directions. The magnitude of mixing flow is of the order of 10−1 mm s−1 as observed in figure 11(c).
The convective velocity in the DDL (figure 11d) was very low compared to the plume; hence, the plume and convective velocity in the layer were captured and analysed separately. The flow vectors within the DDLs (figure 11d) were obtained using 500 ms pulse width, to correctly capture the tracer particles. In high-pulse-width images, plume particles were not traceable in the interrogation window due to high velocity. For these reasons, the velocity in the DDL only can be quantified. The location of the plumes is marked in figure 11(d). The convective rolls in the layer of each DDL were separated by a low-velocity zone (interface of DDL). The convective roll direction and number of rolls in the DDL were decided by the plume. In figure 11(d), one plume was observed in the field of view, and it behaved like a cold plate; hence rolls flow in a downward direction near the plume in each DDL. The top view of the DDLs is shown in figure 11(e) (layer of DDL) and figure 11(f) (interface of DDL).
4.2.1.3 Scale analysis
From the literature (Kumar et al. Reference Kumar, Srivastava and Karagadde2018a), the length scale for salt-finger cells (d) under composition-driven binary alloy solidification is formulated as
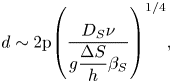 \begin{equation}d\sim 2\mathrm{{\rm \pi} }{\left( {\frac{{{D_S}\nu }}{{g\dfrac{{\Delta S}}{h}{\beta_S}}}} \right)^{1/4}},\end{equation}
where  ${D_S}$ is the compositional diffusivity (m2 s−1), $\nu$ is the kinematic viscosity (m2 s−1), g is the gravitational acceleration (m s−2), h is the height of the liquid, ${\beta _S}$ is the compositional expansion coefficient and $\Delta S$ is the composition difference between plume and bulk composition at the onset of convection (wt %). In the binary mixture, the scaled diameter of salt finger or plume (d from (4.1)) is inversely proportional to ${({\beta _S}\Delta S)^{1/4}}$. However, in ternary systems, the proportionality elements are not known in cases where two different compositional expansion coefficients and composition differences are experienced during the convection.
For studying such systems, a linear stability analysis was performed to validate the present experimental studies. Using the governing equations for mass, momentum, temperature and compositions in linear stability analysis, a characteristic equation has been obtained as follows (the detailed analysis is reported in the supplementary material, available at https://doi.org/10.1017/jfm.2021.1):
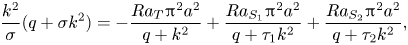 \begin{equation}\frac{{{k^2}}}{\sigma }(q + \sigma {k^2}) ={-} \frac{{R{a_T}{{\rm \pi} ^2}{a^2}}}{{q + {k^2}}} + \frac{{R{a_{{S_1}}}{{\rm \pi} ^2}{a^2}}}{{q + {\tau _1}{k^2}}} + \frac{{R{a_{{S_2}}}{{\rm \pi} ^2}{a^2}}}{{q + {\tau _2}{k^2}}},\end{equation}
where  ${k^2} = {{\rm \pi} ^2}({a^2} + {n^2})$, ${\rm \pi} a$ and ${\rm \pi} n$ are the wavenumbers in the horizontal and vertical directions, and q is the perturbation rate coefficient. Other variables and non-dimensional parameters are:
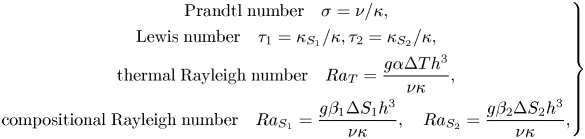 \begin{equation}\left. \begin{gathered} {\textrm{Prandtl}\;\textrm{number}\quad \sigma = \nu /\kappa ,}\\ {\textrm{Lewis}\;\textrm{number}\quad {\tau_1} = {\kappa_{{S_1}}}/\kappa ,{\tau_2} = {\kappa_{{S_2}}}/\kappa ,}\\ {\textrm{thermal}\;\textrm{Rayleigh}\;\textrm{number}\quad R{a_T} = \dfrac{{g\alpha \mathrm{\Delta }T{h^3}}}{{\nu \kappa }},}\\ {\textrm{compositional}\;\textrm{Rayleigh}\;\textrm{number}\quad R{a_{{S_1}}} = \dfrac{{g{\beta_1}\mathrm{\Delta }{S_1}{h^3}}}{{\nu \kappa }},\quad R{a_{{S_2}}} = \dfrac{{g{\beta_2}\mathrm{\Delta }{S_2}{h^3}}}{{\nu \kappa }},} \end{gathered} \right\}\end{equation}
where ΔT and ΔS are the temperature and composition differences between the top and bottom planes, subscripts 1 and 2 correspond to the first and second components, and  $\kappa ,{\kappa _{{S_1}}},{\kappa _{{S_2}}}$ are the kinematic diffusivity of temperature and compositions S 1 and S 2, respectively. The expansion coefficients of the temperature and compositions S 1 and S 2 are indicated by $\alpha ,{\beta _1},{\beta _2}$.
Using marginal stability analysis at the initiation of convection (q = 0) and in the absence of thermal convection, (4.2a) can be simplified to
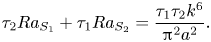 \begin{equation}{\tau _2}R{a_{{S_1}}} + {\tau _1}R{a_{{S_2}}} = \frac{{{\tau _1}{\tau _2}{k^6}}}{{{{\rm \pi} ^2}{a^2}}}.\end{equation}
Based on the Lewis number, (4.3) can be interpreted in two cases.
Case I: The Lewis numbers are different  $({\tau _1} \ne {\tau _2})$ where these relations reach a minimum at ${a^2} = 0.5$ and ${n^2} = 1$ in (4.3) and it is simplified as
 \begin{equation}\frac{{g{h^3}}}{\nu }\left( {\frac{{{\beta_1}\Delta {S_1}}}{{{\kappa_{{S_1}}}}} + \frac{{{\beta_2}\Delta {S_2}}}{{{\kappa_{{S_2}}}}}} \right) = 657.\end{equation}
From this, it can be concluded that the effective compositional Rayleigh number in the ternary system is proportional to  $({\beta _1}\Delta {S_1}/{\kappa _{{S_1}}} + {\beta _2}\Delta {S_2}/{\kappa _{{S_2}}})$.
Case II: Both components (S 1, S 2) have the same Lewis number  $({\tau _1} = {\tau _2} = \tau )$, and (4.3) can be written as
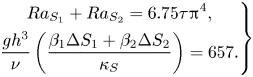 \begin{equation}\left. \begin{gathered} {R{a_{{S_1}}} + R{a_{{S_2}}} = 6.75\tau {{\rm \pi}^4},}\\ {\dfrac{{g{h^3}}}{\nu }\left( {\dfrac{{{\beta_1}\Delta {S_1} + {\beta_2}\Delta {S_2}}}{{{\kappa_S}}}} \right) = 657.} \end{gathered} \right\}\end{equation}
This analysis predicts that the effective compositional Rayleigh number in the ternary system is proportional to  $({\beta _1}\Delta {S_1} + {\beta _2}\Delta {S_2})/{\kappa _S}$.
In the ternary system, the scale of a salt finger can hence be evaluated, and this can be formulated as (4.6) and (4.7) below with the help of (4.1), (4.4) and (4.5).
Case I: Lewis numbers  $({\tau _1} \ne {\tau _2})$ are different,
 \begin{equation}d\sim 2\mathrm{{\rm \pi} }{\left( {\frac{{\nu h}}{g}\left( {\frac{{{\kappa_{{S_1}}}}}{{{\beta_1}\Delta {S_1}}} + \frac{{{\kappa_{{S_2}}}}}{{{\beta_2}\Delta {S_2}}}} \right)} \right)^{1/4}}.\end{equation}
Case II: Lewis numbers  $({\tau _1} = {\tau _2})$ are the same,
 \begin{equation}d\sim 2\mathrm{{\rm \pi} }{\left( {\frac{{\nu h}}{g}\frac{{{\kappa_S}}}{{{\beta_1}\Delta {S_1} + {\beta_2}\Delta {S_2}}}} \right)^{1/4}}.\end{equation}
If the compositional expansion coefficient of the first component is very large compared with that of the other  $({\beta _1} \gg {\beta _2})$, then the diameter of the salt finger can be estimated to be only driven by the second component.
For the present study, we assumed that the Lewis numbers of both compositions are the same, as the orders of the mass diffusion coefficients are similar in order (Tanaka Reference Tanaka1975). The analytical plume diameter is approximately 1.8 mm using (4.7), which compares closely with the average experimental plume diameter (calculated using an averaged pixel count) of 1.7 mm, as shown in figure 12. Figure 12(a) shows the plume location from the top view, and the path of the plume in the porous zone is shown in figure 12(b).
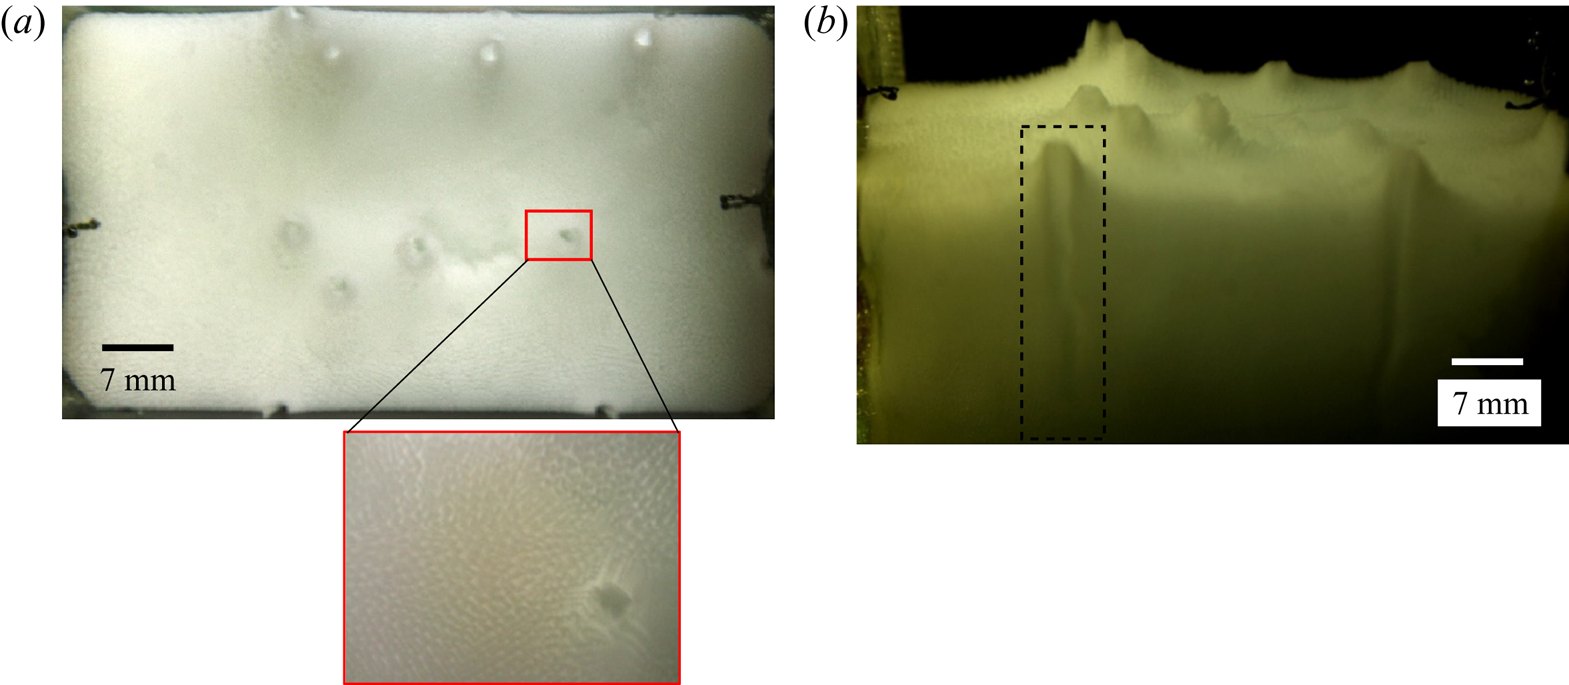
Figure 12. Location of the plumes from (a) the top and (b) the front views at 100 min during solidification of water–25 wt % NH4Cl–5 wt % KNO3. A zoomed-in view of the plume from the top view is shown in the inset of panel (a).
Similarly, a scale for the solutal convective velocity of the plume is evaluated from (Patterson & Imberger Reference Patterson and Imberger1980; Thompson & Szekely Reference Thompson and Szekely1988)
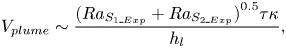 \begin{equation}{V_{plume}}\sim \frac{{{{(R{a_{{S_{1\_Exp}}}} + R{a_{{S_{2\_Exp}}}})}^{0.5}}\tau \kappa }}{{{h_l}}},\end{equation}
where  $R{a_{{S_{1\_Exp}}}} = g{\beta _1}\Delta {S_1}{h^3}/\nu {\kappa _{{S_1}}} = 1.5 \times {10^9}$, $R{a_{{S_{2\_Exp}}}} = g{\beta _2}\Delta {S_2}{h^3}/\nu {\kappa _{{S_2}}} = 1.3 \times {10^9}$ (at 75 min from the experiments). From (4.8), the analytical plume velocity was found to be 3.4 mm s−1, and the experimental velocity, as measured by the PIV technique, was 1.45 mm s−1. Since the present PIV experiments are two-dimensional in nature, the actual plume velocity could not be captured, as the plumes were wavy. The helical angle of the plume was estimated using the shadowgraphs and was used to obtain an approximate plume velocity, and it was found to be 3.6–3.9 mm s−1, which is comparable to analytical results.
The literature suggests that, at the onset of a DDL, the maximum number of plumes were observed in binary systems (Chen Reference Chen1997; Kumar et al. Reference Kumar, Srivastava and Karagadde2018a). In contrast, this was not observed in ternary situations (figure 9b,c). At the onset of DDLs in the ternary system, the thermal Rayleigh number in a DDL  $(R{a_{T\_DDL}} = 10.9 \times {10^6})$ was of the same order as in the binary system (13.6 × 10⁶), which is required for the onset of a DDL (Kumar et al. Reference Kumar, Srivastava and Karagadde2018a). (The thermal Rayleigh number for the DDL was calculated by the average temperature difference between the left and right sides at a horizontal plane $(\Delta {T_{horizontal}})$ and is formulated as $R{a_{T\_DDL}} = g\alpha \Delta {T_{horizontal}}{h^3}/\nu \kappa$ (Kumar et al. Reference Kumar, Srivastava and Karagadde2018a).) The compositional convection $(R{a_{{S_{_{1\_Exp}}}}} + R{a_{{S_{2\_Exp}}}})$ and plume velocity were higher in the ternary system, which led to an early onset of DDLs without the occurrence of a maximum number of plumes.
4.2.1.4 Effect of high compositions of NH4Cl and KNO3
As the initial composition of KNO3 and NH4Cl are increased, the distance between ‘P’ (equilibrium cotectic composition for ‘O’ initial composition) and ‘O’ increases (figure 1). This led to an increase in compositional convection  $({\beta _1}\Delta {S_1} + {\beta _2}\Delta {S_2})$ in porous (primary mush and cotectic mush) zones and the bulk fluid. As a result, the plume diameter decreased (figure 13), and the number of plumes increased; this can be verified from (4.7). In experiments where the bottom plate temperature is lowered, the number of plumes can increase (not performed in the present work).
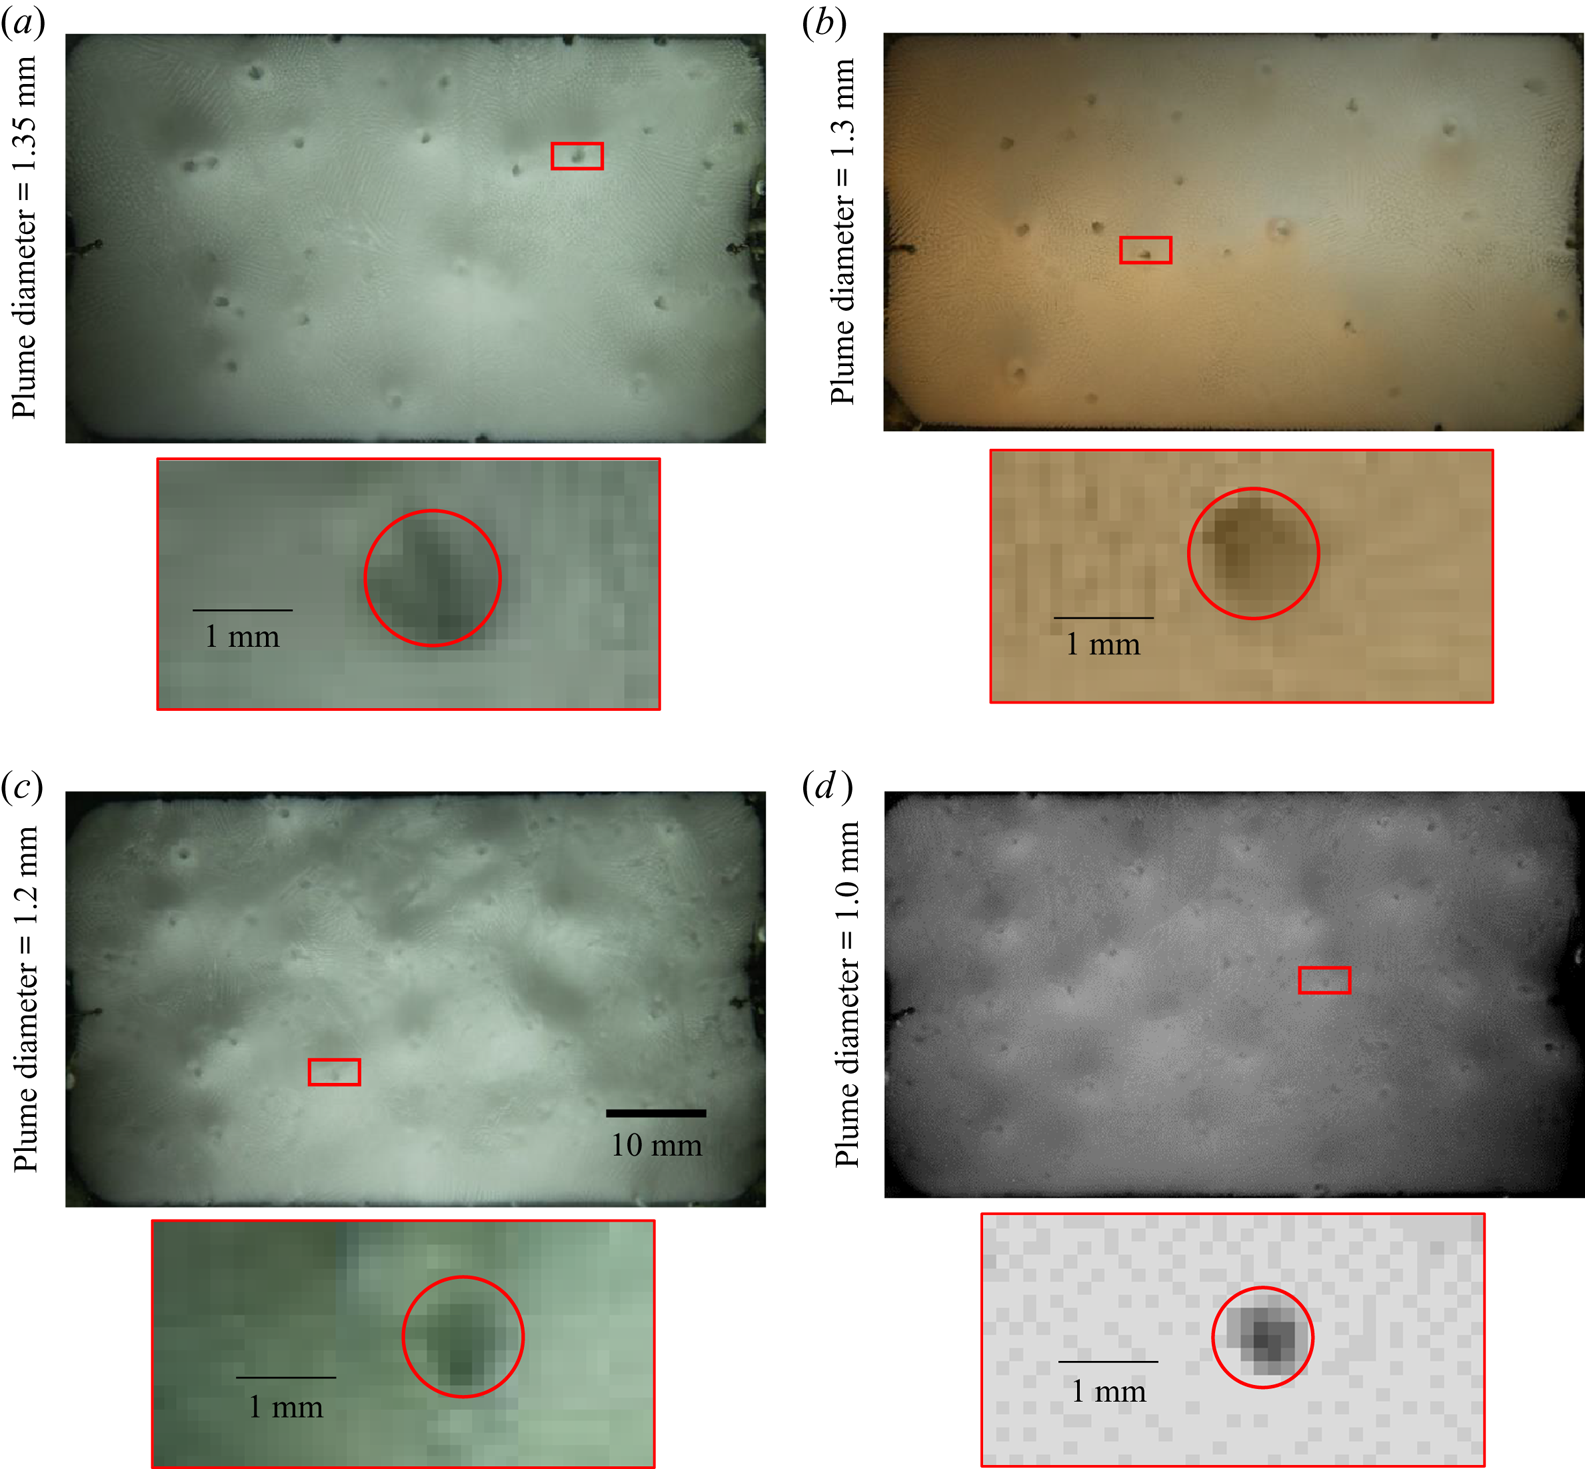
Figure 13. Locations of plumes from the top view for the initial compositions (a) water–10 wt % KNO3–23 wt % NH4Cl, (b) water–10 wt % KNO3–25 wt % NH4Cl, (c) water–15 wt % KNO3–22 wt % NH4Cl and (d) water–17 wt % KNO3–23 wt % NH4Cl. A zoomed-in view of the plume is shown for each case. The red rectangle in each main panel shows the location of the plume that is shown in the zoomed-in view.
In regime IIa, where the amount of KNO3 is increased, this can lead to interesting flow behaviour. The representative area of these initial compositions is marked by a dotted circle in regime IIa on the ternary phase diagram in figure 14(a). During the solidification, KNO3 was transported by the rejected liquid from primary mush (water + KNO3 -enriched mixture) as well as cotectic mush (KNO3 -enriched mixture). During the initial stages, due to the weaker nature of the plume, the bulk fluid was mostly stagnant. As plumes rise upwards, the bulk fluid moves downwards due to mass conservation. For the case of initial composition water–15 wt % KNO3–23 wt % NH4Cl (figure 14b), the mass conservation can be represented through
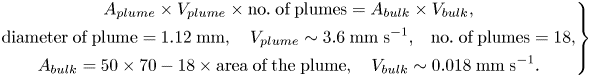 \begin{gather}\left. \begin{gathered} {{A_{plume}} \times {V_{plume}} \times \textrm{no}\textrm{.}\;\textrm{of}\;\textrm{plumes} = {A_{bulk}} \times {V_{bulk}},}\\ {\textrm{diameter}\;\textrm{of}\;\textrm{plume} = 1.12\;\textrm{mm},\quad {V_{plume}}\sim 3.6\;\textrm{mm}\;{\textrm{s}^{ - 1}}\textrm{,}\quad \textrm{no}\textrm{.}\;\textrm{of}\;\textrm{plumes} = 18,}\\ {{A_{bulk}} = 50 \times 70 - 18 \times \textrm{area}\;\textrm{of}\;\textrm{the}\;\textrm{plume},\quad {V_{bulk}}\sim 0.018\;\textrm{mm}\;{\textrm{s}^{ - 1}}.} \end{gathered} \right\}\end{gather}
The downward velocity of bulk was found to be of the order of 10−2 mm s−1, which was also observed from the velocity field from figure 11(a).
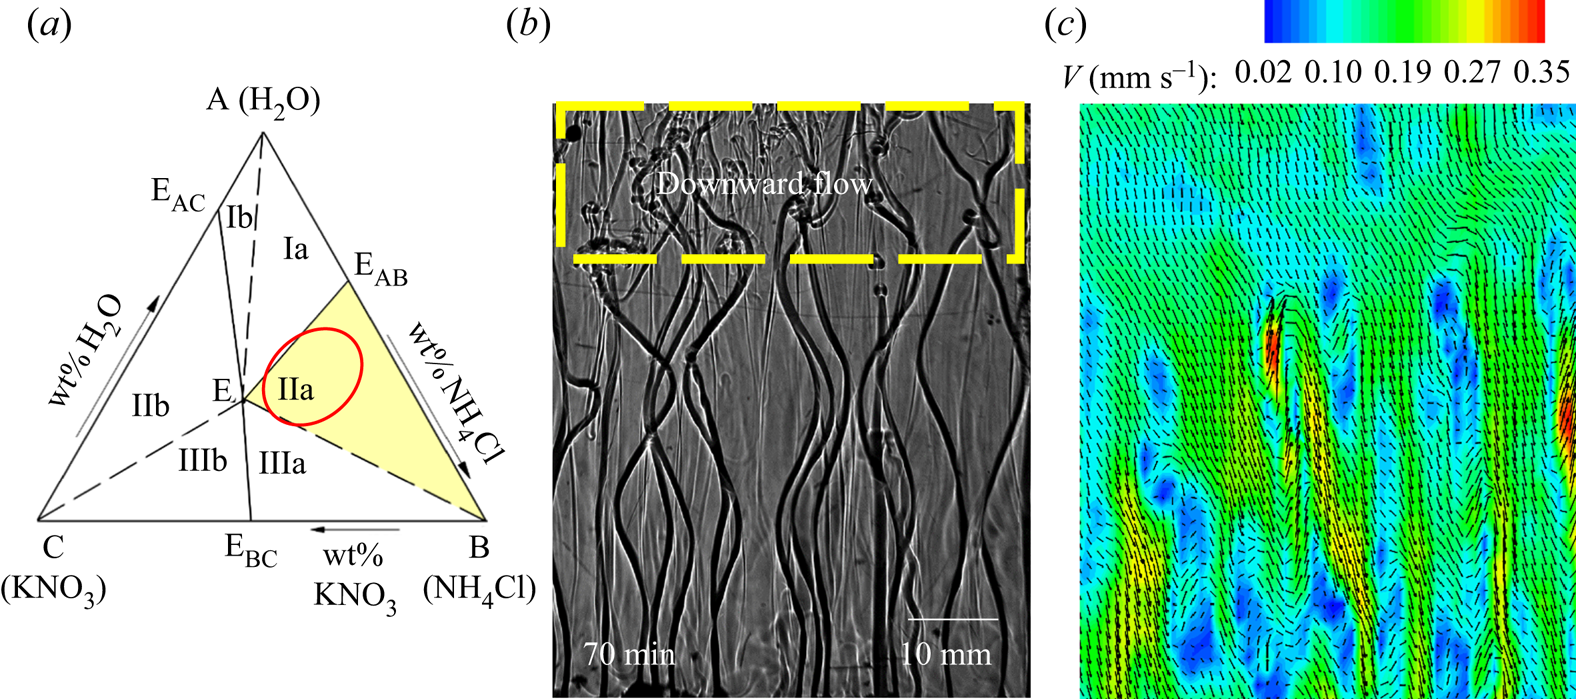
Figure 14. (a) The representative region with higher amount of KNO3 in the initial composition is marked in regime IIa by the red ellipse. (b) Downward convective flow observed in the top section due to the occurrence of Rayleigh–Taylor instability in water–15 wt % KNO3–23 wt % NH4Cl and (c) the corresponding velocity contour (x–y plane).
In binary systems, the plume (less dense) mixes with the bulk (heavier than plume) at the top, leading to a decrease in the density of the bulk. However, in ternary or high-component systems, although the density of the fluid in the plumes is lower compared to the bulk, it can still have considerable amounts of the heaviest component (KNO3, solutal expansion coefficient ~0.0065 wt %−1). As indicative examples, plumes (composition, water–23 wt % KNO3–4.7 wt % NH4Cl, density 1172 kg m−3; or composition, water–24.9 wt % KNO3–0 wt % NH4Cl, density 1170.5 kg m−3) are typically ~0.02 % or 0.04 % lighter in density compared to that of the bulk (composition, water–16 wt % KNO3–21 wt % NH4Cl, density 1172.3 kg m−3; or composition, water–15 wt % KNO3–23 wt % NH4Cl, density 1171.05 kg m−3), even when the heavier component is present in the plume. However, after mixing at the top (composition, water–19.5 wt % KNO3–12.85 wt % NH4Cl, density 1172.6 kg m−3; or composition, water–19.95 wt % KNO3–11.5 wt % NH4Cl, density 1171.68 kg m−3), the liquid can be ~0.028 % or 0.05 % heavier, compared to that of the same bulk. As NH4Cl is less in the plume, water + KNO3 mixing with water + NH4Cl + KNO3 at the top can be heavier compared to the bulk. This implies that the plume (enriched in KNO3) continuously mixes with the high -density bulk material, only at the top of the cell; the overall density of the layers of fluid at the top could become slightly heavier compared to that of the bulk. This peculiar case is likely to occur in ternary or higher component systems and not in binary. It will generally occur in a multi-component system if the components have large differences in their specific gravity.
With the progress in the solidification, due to increased density after mixing of the plume at the top, the previously accumulated (initial time of solidification) bulk fluid moves downwards via Rayleigh–Taylor instability. These motions can be identified by the downward motion of salt fingers at the top of the cell, and the region is marked by a dashed rectangular box in figure 14(b). Note that the temperature difference is negligible between the plume and the bulk liquid at the top of the cell. The thermal expansion coefficient (~10−4) is lower than the solutal expansion coefficient, which indicates the density change at the top is greatly influenced by composition.
During solidification of water–15 wt % KNO3–23 wt % NH4Cl, water–18.7 wt % KNO3–16.4 wt % NH4Cl (1178.2 kg m−3) and water–18.3 wt % KNO3–16.8 wt % NH4Cl (1176.8 kg m−3) were the compositions near the free surface of the cell and 15 mm below the free surface at 70 min, respectively. The downward flow can be observed with an average velocity of 0.2 mm s−1 in the bulk fluid by PIV, as shown in figure 14(c). The increase in downward velocity of the bulk fluid (Vbulk) from order 10−2 (the initial stage of solidification) to 10−1 mm s−1 occurred due to Rayleigh–Taylor instabilities. The convective motion induced by the Rayleigh–Taylor instability homogenized the temperature differences which were required for the onset of DDLs and hence delayed the onset of DDLs.
4.2.2. Dendrites and facets in cotectic mush: dendrites in the primary mush
In regime IIIa, facets and dendrites grow simultaneously in the cotectic mush, the water -enriched mixture is rejected into the bulk fluid (figure 15a), and NH4Cl (which grows as dendrites) is the primary solidifying component in the primary mush (figure 15a). Convective flow is sustained even after the bulk fluid reaches the cotectic region. This can be attributed to the rejection of water -enriched mixture. Water–25 wt % NH4Cl–20 wt % KNO3 (regime IIIa) was chosen as the initial composition for experiments, and it is marked by a dot on the phase diagram in figure 15(b).
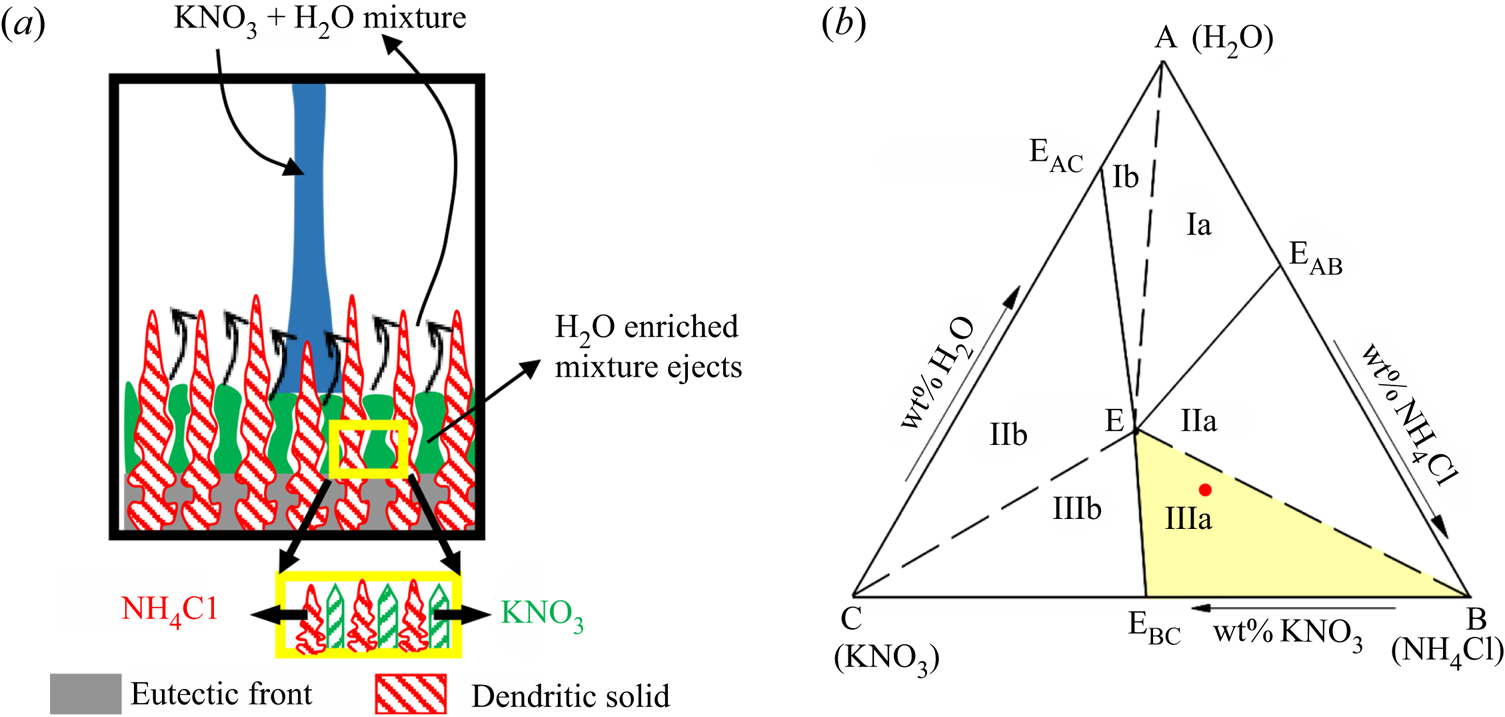
Figure 15. (a) Schematic of growing microstructure in the porous zone and flow patterns where dendrites are the primary solid and facets grow with dendrites in the cotectic mush. (b) The ternary phase diagram of water–NH4Cl–KNO3; the red dot marks the initial composition in regime IIIa.
Figure 16 shows the convective flow for water–27 wt % NH4Cl–20 wt % KNO3 using shadowgraphy. Plumes were observed due to the presence of dendritic growth in the porous zone (figures 16a and 17a). Further, the coexistence of faceted solid along with the dendritic microstructure in the cotectic mush caused weak random convection in the bulk fluid. The region of random convection in the bulk fluids is marked by a dashed rectangle in figure 16(a). The convection in the cotectic mush was weaker, as its height was lower than the primary mush. As discussed in the previous section, downward flow due to the heavier KNO3-rich liquid at the free surface was also observed during the initial solidification in the present regime (the indicative region is marked by the rectangular box in figure 16a).
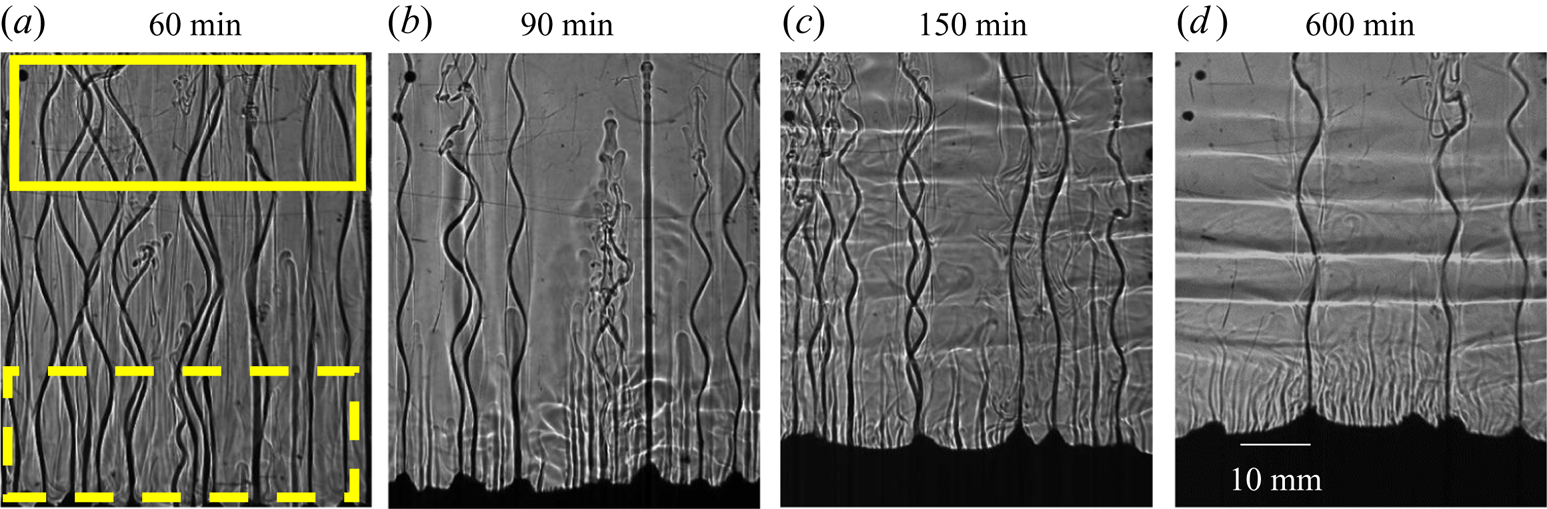
Figure 16. Convective flow observation using shadowgraphy for water–25 wt % NH4Cl–20 wt % KNO3 (regime IIIa). (a) Plume, slight random solutal convection (due to faceted growth in the cotectic mush, dashed lower rectangular box) and downward flow in the top region due to heavy rejection of KNO3 (solid upper rectangular box ) at 60 min. (b) Homogenization of composition due to downward flow via the occurrence of Rayleigh–Taylor instability, at 90 min. (c) The onset of DDLs in the presence of weak random convection at 150 min. (d) The composition reached near the cotectic region and strengthening of the DDLs (600 min) from the previous time instant (150 min).
The random convection due to faceted growth and downward movement of bulk fluid from the top homogenized the thermal and compositional gradients in the bulk fluid (figure 16b). As solidification progressed, the composition of bulk fluid became stable, and a threshold lateral temperature difference  $(R{a_{T\_DDL}})$ and a vertical compositional gradient were formed to initiate a DDL. At 150 min, a DDL was observed, but the gradient at the interface of the DDL (greyscale intensity of interface) was not clear (figure 16c) due to the presence of random convection caused by the faceted growth in the cotectic mush (figure 16c). These can be compared with the DDL in regime IIa, where no random convection occurred and led to a clear DDL (figure 9b,c). As the composition of the bulk fluid reached the cotectic line, random convection in the bulk fluid was reduced, and the residual water-enriched mixture was able to form a high -gradient interface DDL, as shown in figure 16(d). However, the random convection continued to exist and weakened the DDLs. The locations of plumes were captured from the top, as shown in figure 17(b), and the diameter of the plume (0.8 mm) was lower due to a higher amount of compositional convection. In summary, the occurrence of random convection and downward flow due to a greater amount of heaviest component delayed the onset of the DDL.
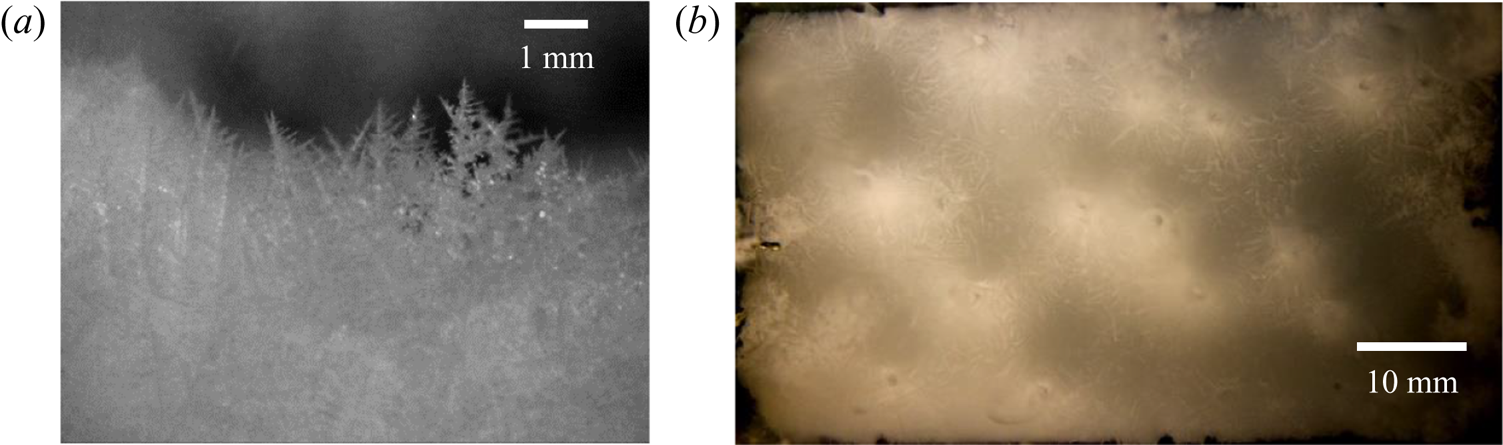
Figure 17. (a) Dendritic microstructures in the primary mush. (b) The location of the plume captured from the top during solidification of water–25 wt % NH4Cl–20 wt % KNO3 (regime IIIa).
4.2.3. Dendrites and facets in cotectic mush: facets in the primary mush
KNO3 (which grows as faceted morphology) is the primary solidifying component in the primary mush, which rejects water–NH4Cl mixture in the bulk, as shown in figure 18(a). In the cotectic mush, facets (KNO3) and dendrites (NH4Cl) solidify simultaneously and reject water into the bulk (figure 18a). Convective flow is observed after reaching cotectic compositions due to the rejection of water-enriched mixture. As a representative case, water–20 wt % NH4Cl–25 wt % KNO3 was chosen as the initial composition in regime IIIb, and it is marked with a dot on the phase diagram in figure 18(b).
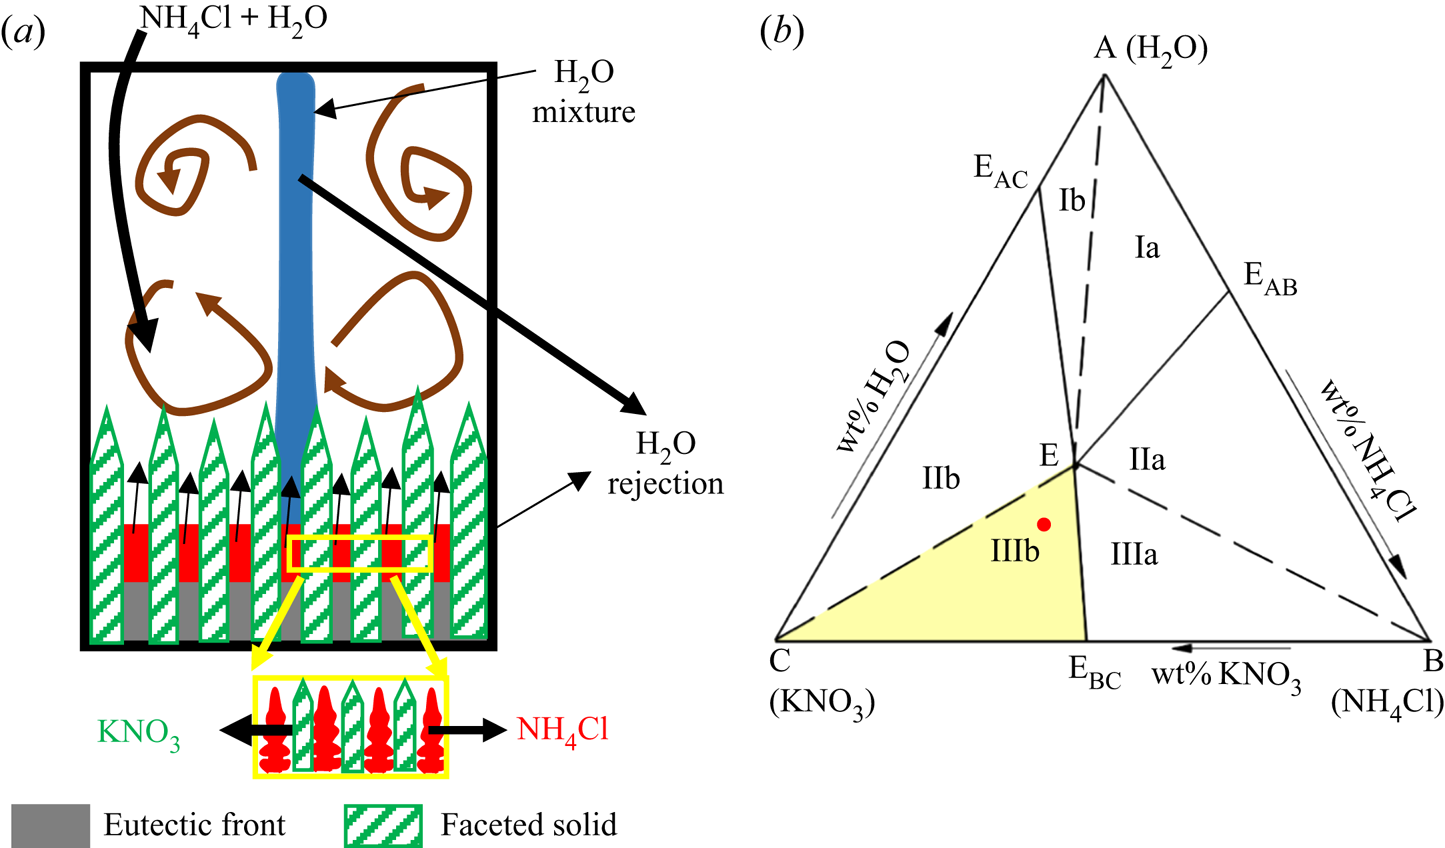
Figure 18. (a) Schematic of growing microstructure in the porous zone and expected flow patterns in regime IIIb. In regime IIIb, facets are the primary solid and dendrites grow with facets in the cotectic mush. (b) The ternary phase diagram of water–NH4Cl–KNO3; the red dot marks the initial composition in regime IIIb.
In water–20 wt % NH4Cl–25 wt % KNO3, both random convection and plumes were observed in the bulk fluid (figure 19a). Random convection was observed due to the facets, whereas plumes were observed due to the presence of dendrites (NH4Cl) in the cotectic mush (figures 18a and 19a). The primary mush (faceted morphology) from the front and top view is shown in figure 20. The plume diameter (0.25 mm) was very small in the solid because the plumes originated from the cotectic mush and were surrounded by faceted solid of the primary mush (a zoomed view of the plume location is shown in the inset of figure 20).
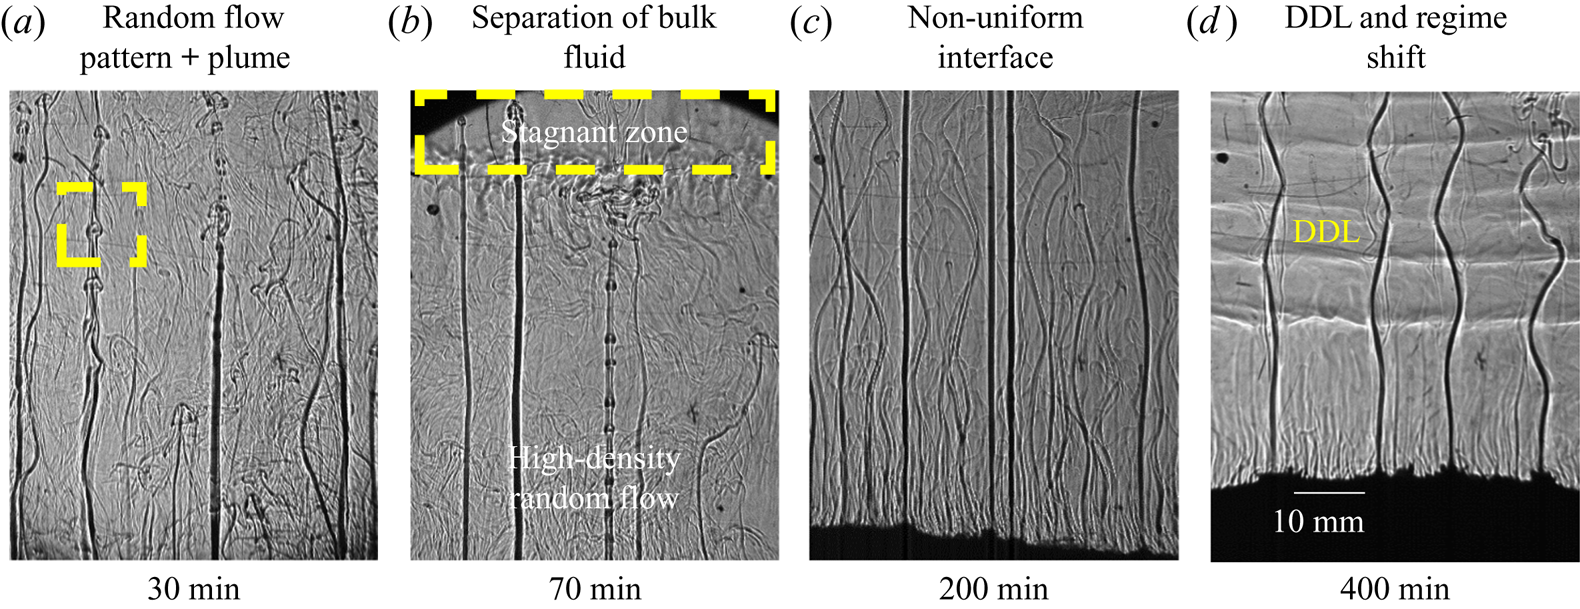
Figure 19. Convective flow for water–20 wt % NH4Cl–25 wt % KNO3 (regime IIIb): (a) random and plume convection at 60 min; (b) separation of bulk fluid into two zones at 70 min, stagnant and random convective zones; (c) reduction in random convection and dominance of plumes at 200 min; and (c) DDL formation after the shift of composition from regime IIIb to IIIa.
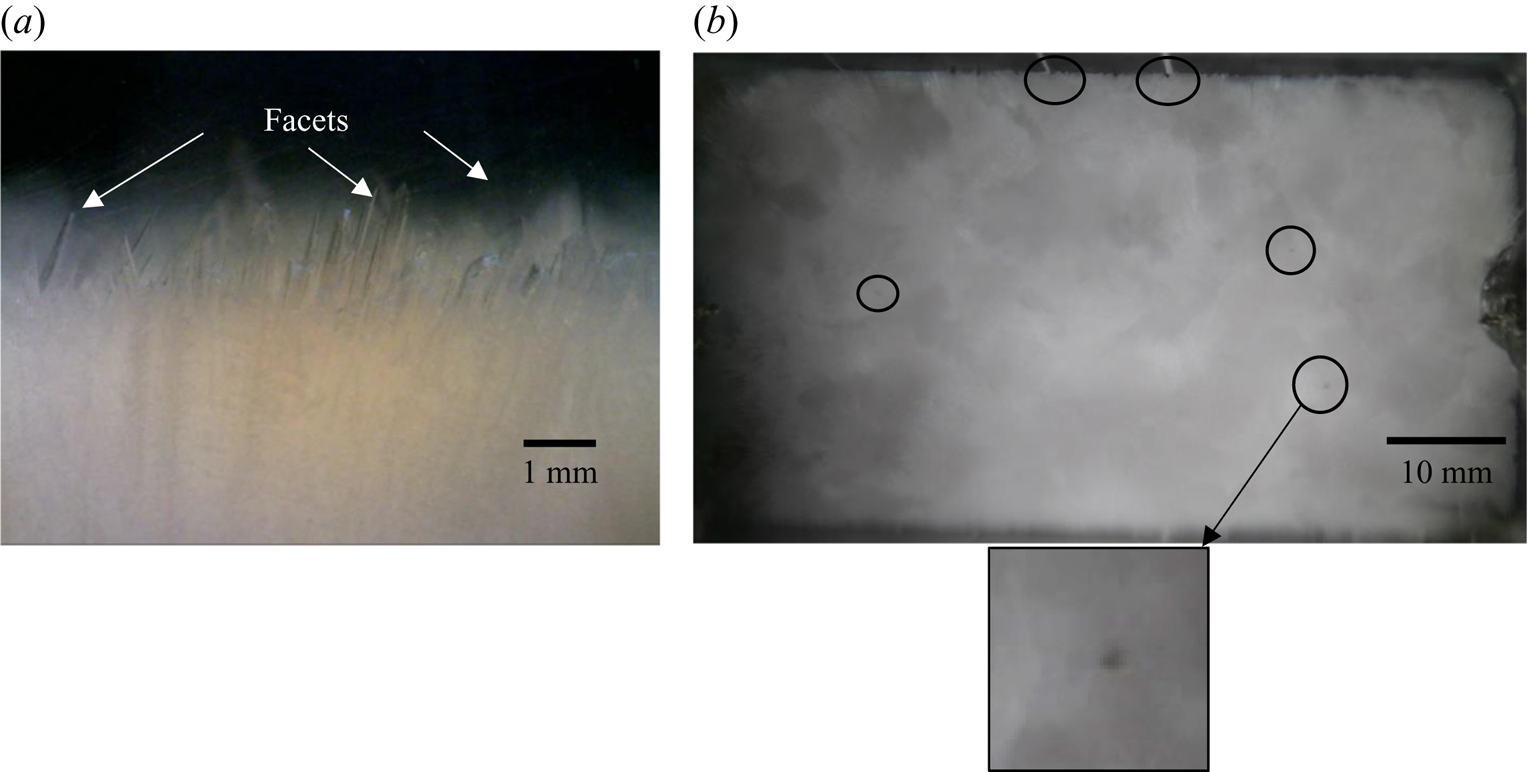
Figure 20. (a) Faceted microstructures in primary mush and (b) top view of solid for water–20 wt % NH4Cl–25 wt % KNO3 at 70 min. A zoomed-in view of plumes (that originate in the cotectic mush) is shown in the inset .
Both discontinuous and continuous types of plumes were observed (figure 19a,b). Discontinuous plumes were observed in the form of discrete mushroom-shaped blobs, marked by a rectangular box in figure 19(a). This discontinuity is due to the obstruction by the faceted solid in the primary mush in the path of rejected water -enriched mixture from the cotectic zone. Combined convective flow patterns separated the bulk fluid into two zones, namely stagnant and random convective zones, as shown in figure 19(b). With solidification, the strength of random convection reduced, and it led to the disappearance of separation in the bulk fluid (figure 19c). With time, DDLs appeared (figure 19d), and these DDLs looked similar to those in regime IIIa (at 600 min, figure 16d). As the strength of the random convection reduced, the discontinuous plumes disappeared, and a more continuous plume in regime IIIa was observed. The experiments were performed with a different initial compositions (water–20 wt % NH4Cl–27 wt % KNO3 and water–20 wt % NH4Cl–28 wt % KNO3) in this regime, and a similar observation was made.
4.2.3.1 Formation of stagnant fluid layers
The primary mush induced random convection of the heavier water–NH4Cl mixture and plumes originated from the cotectic mush, which transported low -density water -enriched mixture (figures 19b and 21a). The height of the random convective flow was restricted due to the accumulation of water -enriched mixture transported by the plume at the top of the cell. This region of random flow is termed the ‘random convective zone’. The accumulation region above this zone, up to the free surface of the cell, is termed the ‘stagnant zone’, as shown in figures 19(b) and 21(a). These two sections of bulk fluid can be observed by PIV. In the bulk fluid, higher convective velocity was observed in the random convective zone, and negligible velocity was observed in the stagnation zone, as shown in figure 21(b). With progress in solidification, the random convection was suppressed, leading to the homogenization of stagnant and random convective zones. Thus, the disappearance of separation of the bulk was observed eventually (figure 19c).
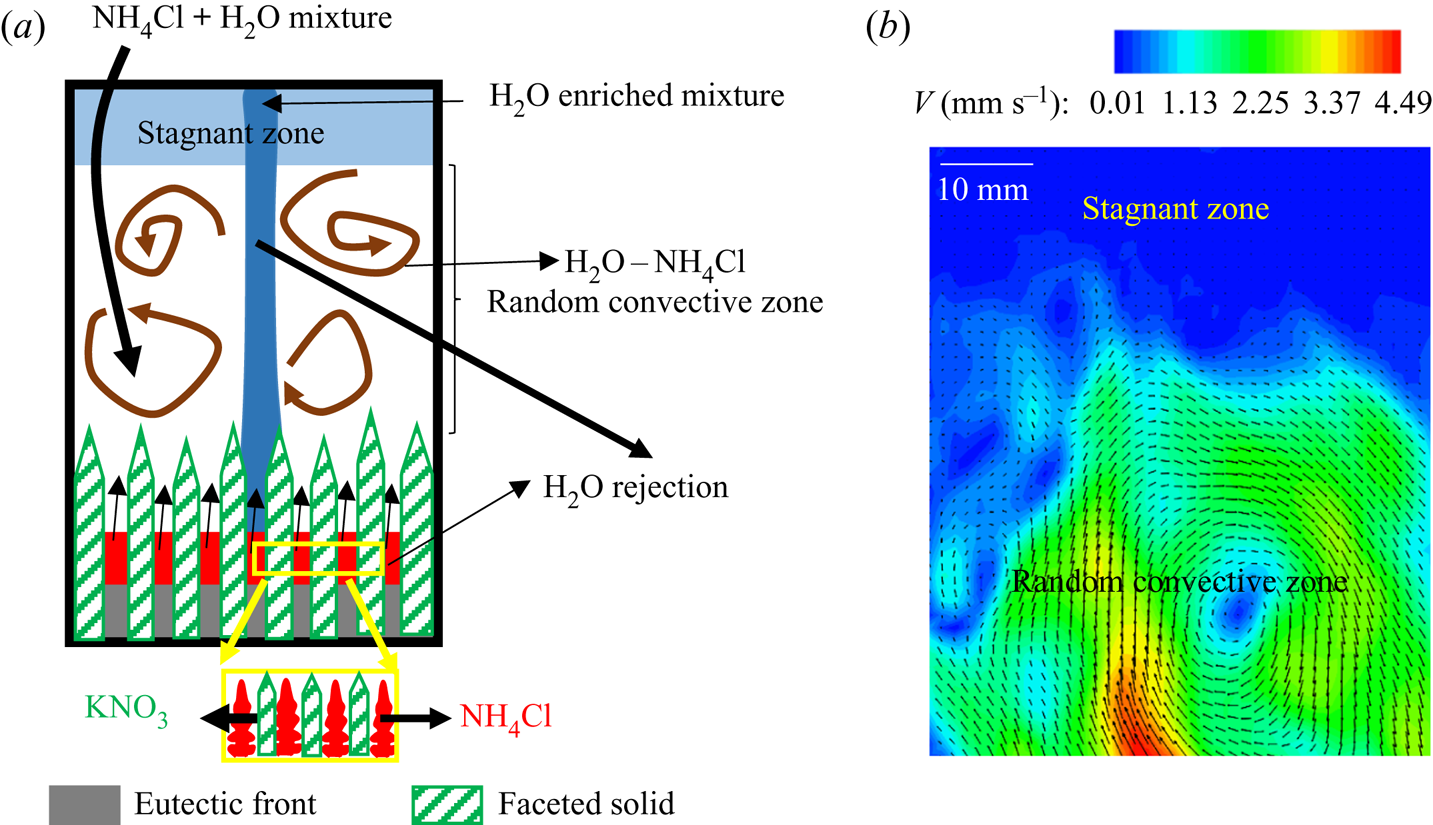
Figure 21. (a) Schematic for the mechanism of the separation in the bulk fluids. (b) Velocity contours and vectors in the bulk liquid where the stagnant zone has no velocity.
4.2.3.2 Shifting of facets to dendrites in the primary mush
The compositions of the stagnant and random convective zones were found to be water–21.2 wt % NH4Cl–20.9 wt % KNO3 and water–20.5 wt % NH4Cl–23 wt % KNO3, respectively, at 70 min. The composition in random convection was near to the cotectic composition. Owing to a high solid fraction (0.73) of growing facets in the primary mush, KNO3 in the bulk depleted, causing a reduction in the growth of facets, thus suppressing random convection during the early stages of solidification (200 min). This resulted in increased NH4Cl presence in the bulk fluid, shifting the composition regime towards regime IIIa. Beyond 200 min, the dendrites began to grow as primary solidifying component instead of facets, for the initial composition in regime IIIb, and local random convection was observed from the cotectic mush, as discussed in § 4.2.2 (for solidification in regime IIIa). The bulk fluid composition was measured to be water–22.2 wt % NH4Cl–20.6 wt % KNO3 at 220 min, which represents regime IIIa.
This hypothesis can be ascertained by observing the microstructures and shadowgraph images. At 300 min, the microscopic view shows the dendritic solid in the primary mush and a few facets ( previously the primary mush solid in figure 20a), as shown in figure 22(a). During the initial stages, the plume location was very small as it grew in the cotectic mush (figure 20b), but after the shift in the composition into regime IIIa, the plume location can be easily identified from the top view as shown in figure 22(b).
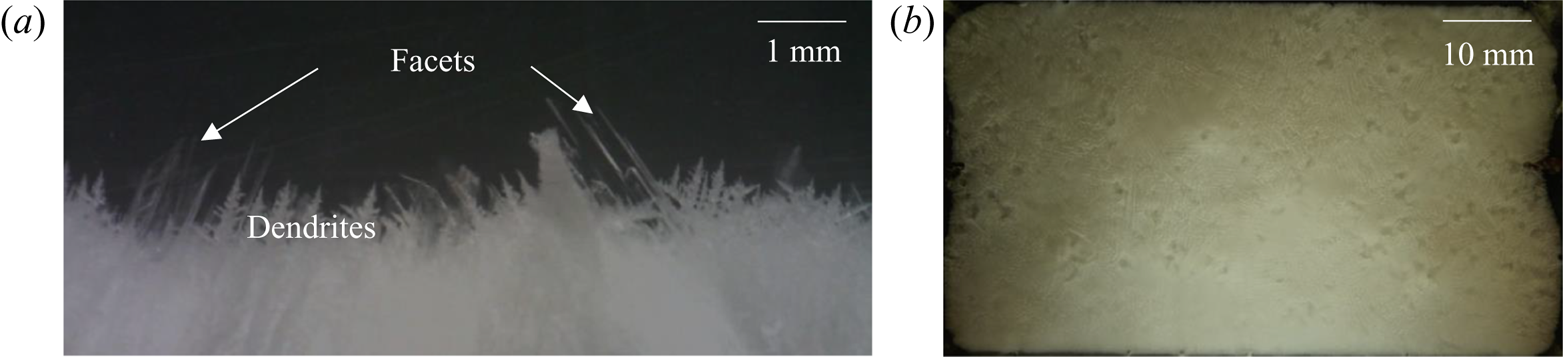
Figure 22. (a) After the shift of the bulk composition from regime IIIb to regime IIIa for initial composition water–20 wt % NH4Cl–25 wt % KNO3 (regime IIIb), at 300 min, this shows dendrites in the primary mush with already existing faceted microstructures in the primary mush (figure 20a). (b) Top view of plume locations after the shift of composition from regime IIIb to IIIa.
An interesting phenomenon of ‘regime shifting’ was observed in systems falling in regime IIIb. The high solid fraction due to faceted structure formation during the initial stages aided the homogenization of composition and temperature, leading to a composition shift to regime IIIa. However, regime IIIa experiences dendritic growth, which always tends to maintain a gradient in the bulk fluid. This is identified as the main reason for the system to remain in the regime with no change in the primary solid.
4.2.3.3 Temperature measurements
The temperature measurements also show an interesting phenomenon (figure 23). In the stagnant zone (90 and 100 mm height), a temperature difference was observed between the left and right sides of the cell, due to the presence of plumes (figure 19). A low-temperature gradient was observed in the random convective zone (60 and 80 mm height in figure 23) till 200 min owing to the homogenization by random convection. On the shift of composition (regime IIIb to IIIa), temperature differences appeared across the height of the bulk fluid.
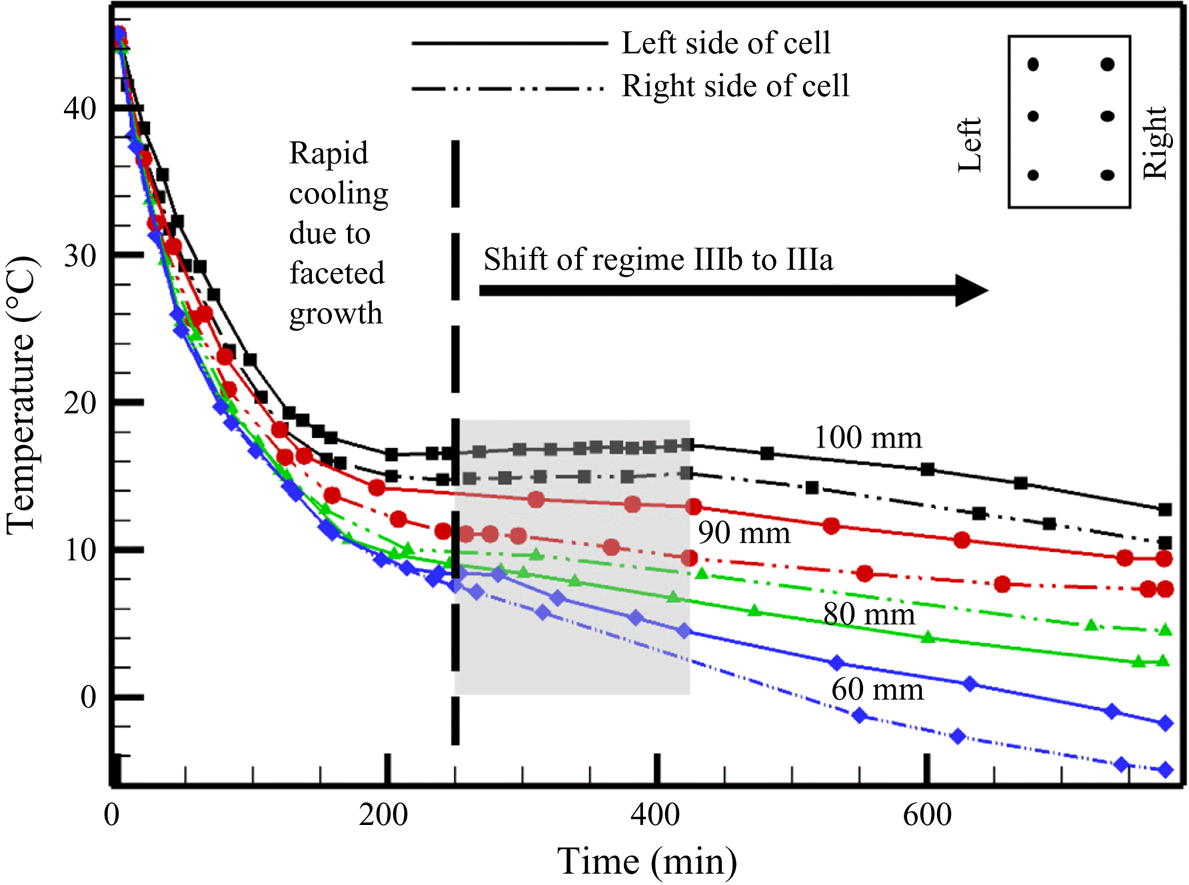
Figure 23. Temperature plot during solidification of water–20 wt % NH4Cl–25 wt % KNO3.
In the presence of faceted growth, a gain in temperature (discussed in § 4.1.1 for faceted growth in figure 7; Kumar et al. Reference Kumar, Abhishek, Srivastava and Karagadde2020a) was observed at the end of random convection. However, in this regime, the gain in temperature disappeared, and flat temperature profiles were observed in the region; this is marked by a grey rectangular box in figure 23. The temperature rise in the liquid after the suppression of random convection was compensated by the exchange of heat with the plumes. A DDL formed and nominal cooling curves at all positions were observed henceforth, as shown in figure 23.
5. Conclusions
The present work discusses the effect of evolving dendritic and faceted microstructures in the porous zone on natural convection during the bottom-cooled solidification of a ternary mixture. Experiments were performed in all representative compositional regimes of the ternary mixture, which exhibit different convective flow phenomena. The presence of facets as primary solid leads to random convection, whereas dendrites in the primary solid lead to plume formation, and further cause the formation of DDLs in the bulk. During plume formation, when the initial composition has large amounts of the heaviest component in the mixture (KNO3), compositional convection is complex due to the downward flow of heavy liquid from the top via Rayleigh–Taylor instability, and it delays the onset of DDLs. During solidification of the dendrites or facets with water in the cotectic mush, the flow patterns are decided primarily by the solid morphology (dendrite or faceted).
When dendrites form in the primary mush, with facets coexisting in the cotectic mush, experiments reveal the formation of plumes, weak random convection and downward flow of heavy solute via Rayleigh–Taylor instability. In a similar cotectic mush morphology, with facets being the primary solid structures, plumes continued to exist even in the presence of strengthened random convection. This resulted in the separation of the bulk fluid into two regions: a stagnant zone near the free surface, and a random convective region. The stagnant zone is the result of the plume transporting water -enriched mixture rejected by the cotectic mush. The stagnant zone vanished over time as it mixed with the random convective zone. Owing to the high solid fraction of the faceted morphology in the porous zones and random convection in the bulk fluid, the shifting of bulk composition (from regime IIIb to IIIa) occurred in such a way that the primary solid changed from faceted to dendritic (lower weight percentage of KNO3 in the bulk). This resulted in the suppression of random convection, with the plume dominating the convection. The sustained plumes further established a lateral thermal gradient across the cell, resulting in the formation of DDLs. The nature of convective flow with growing microstructures is represented in table 2.
Table 2. Primary and cotectic solidifying morphology and nature of convection and their effect.

A scale analysis has been performed using linear stability analysis for the first time to evaluate the scales of plume diameter and natural convection flow in the ternary system (see the supplementary material available at https://doi.org/10.1017/jfm.2021.1). The analysis also suggests that an initial composition away from the cotectic line causes higher compositional convection and lower plume diameter, which matched closely with the experimental observations. To the best of our knowledge, this study is the first to describe the effect of microstructures on natural convection in ternary systems. The study also suggests that further investigation of the flow phenomenon concerning the origin of the plumes and random convection patterns in the cotectic mush at a microscopic scale is necessary to explore structure–convection dependences. The effects of the aspect ratio of the chamber and the bottom temperature on convective patterns require to be explored further.
Supplementary material
Supplementary material for the scale analysis using the linear stability in the ternary system is available at https://doi.org/10.1017/jfm.2021.1.
Acknowledgments
The authors thank the Sophisticated and Advanced Instrumentation Facility (SAIF) at IIT Bombay for use of facilities. We wish to thank Mr G.S. Abhishek for proofreading the original manuscript.
Funding
The authors gratefully acknowledge financial support from the Department of Science and Technology (DST), India (Grant No. EMR/2015/001140).
Declaration of interests
The authors report no conflict of interest.
Appendix. Freezing of water as primary: no bulk convection
Diffusion-controlled solidification was observed with an initial composition of water–10 wt % NH4Cl–5 wt % KNO3 in regime I, where water is the primary solidifying component. In regime I, the diffusion-controlled heat transfer was observed similar to the studies carried out by Aitta et al. (Reference Aitta, Huppert and Worster2000, Reference Aitta, Huppert and Worster2001) with water–KNO3–NaNO3 ternary system. Growth of solid and progressive formation of the parabolic porous zone was observed (figure 24), with similar parabolic shapes as also reported in Aitta et al. (Reference Aitta, Huppert and Worster2000, Reference Aitta, Huppert and Worster2001). It can be hypothesized that these parabolic shapes are a consequence of localized heat gain from the surroundings supported by consequent composition-driven flow, resulting in remelting at the walls. The heavy rejected liquid (NH4Cl–KNO3 mixture) near the solid–liquid interface slipped towards the lowest point (melting zone near-wall boundaries) of the solid–liquid interface, and this direction of flow is marked by an arrow, as shown in figure 24(b). The slip flow along the curved interface towards the wall suppressed the growth of the porous zone near the wall, leading to the formation of a parabolic shape, as shown in figure 24(c). Such parabolic shape formation behaviour is analogous to natural processes like rock formation, floating icebergs in the oceans, etc.
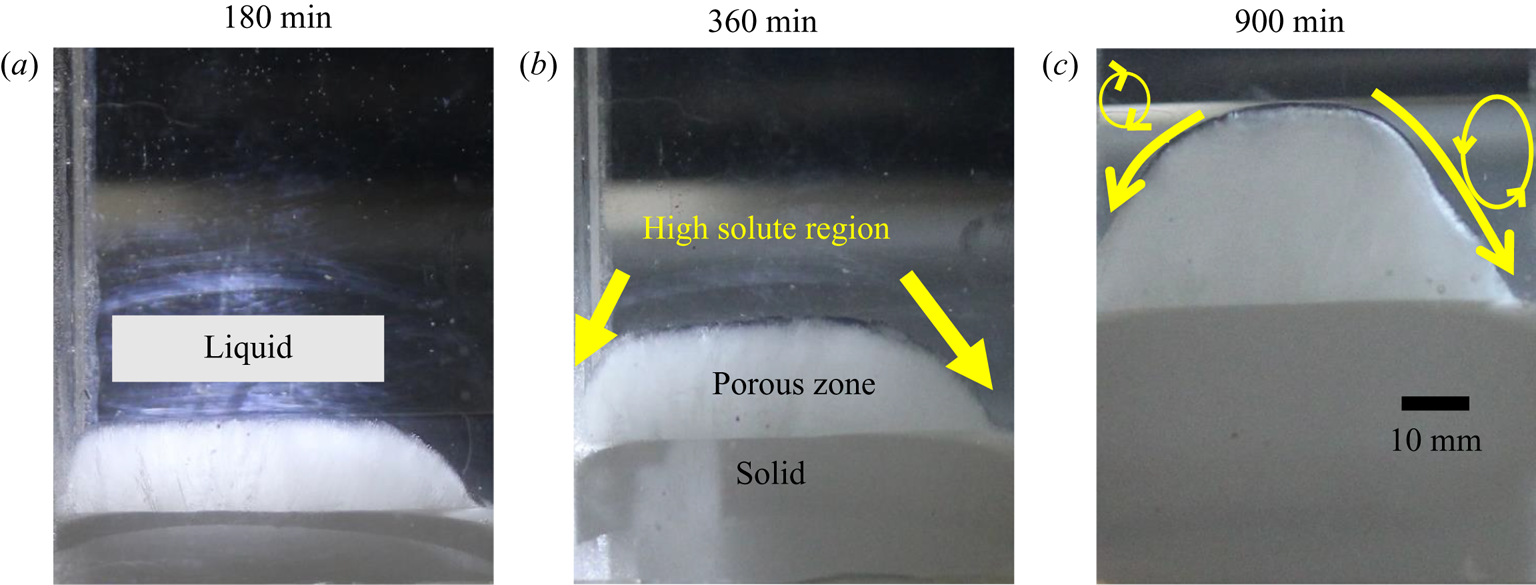
Figure 24. Diffusion-controlled solidification process during solidification of water–10 wt % NH4Cl–5 wt % KNO3 in regime I at (a) 180 min, (b) 360 min and (c) 900 min.


 Open access