


1. Introduction
The blockage of mass flow through constrictions is unfortunately a common issue in industrial processes, which is typically solved by simply substituting the clogged portion of the conduct, with the subsequent elevated costs. This phenomenon can manifest in different ways depending on the nature of the material being transported. For example, when colloidal suspensions are being passed through narrow passages, colloidal particles often feel an attraction towards the walls and to each other. Under the latter conditions, particles tend to form aggregates that can grow up to sizes capable of blocking downstream constrictions (Delouche et al. Reference Delouche, van Doorn, Kodger, Schofield, Sprakel and Tabuteau2021). Cohesive suspensions can also provoke clogs by successive deposition, i.e. particles depositing progressively on the constriction wall thus reducing the constriction size (Wyss et al. Reference Wyss, Blair, Morris, Stone and Weitz2006; Agbangla, Climent & Bacchin Reference Agbangla, Climent and Bacchin2012; Dersoir et al. Reference Dersoir, de Saint Vincent, Abkarian and Tabuteau2015; Duru & Hallez Reference Duru and Hallez2015; Delouche, Schofield & Tabuteau Reference Delouche, Schofield and Tabuteau2020).
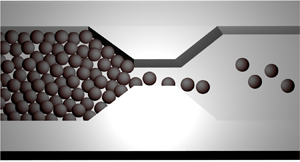
Nonetheless, particles can also clog a constriction purely by mechanical forces, in the absence of cohesive forces towards the wall or towards other particles. This can occur easily when particles (typically larger than colloidal size) form a stable arch that blocks the outlet or the narrow channel, as shown in figure 1. This is a common way of blocking a passage, not only in granular systems (Zuriguel et al. Reference Zuriguel2014), but also in car traffic flow (Helbing & Nagel Reference Helbing and Nagel2004), people escaping in panic (Garcimartín et al. Reference Garcimartín, Parisi, Pastor, Martín-Gómez and Zuriguel2016), or animal herds (Garcimartín et al. Reference Garcimartín, Pastor, Ferrer, Ramos, Martín-Gómez and Zuriguel2015). Although arching in suspensions has several analogies with such many-body systems, suspensions have the special feature of being a two-phase flow, in which both particles and liquid must pass through the constriction. This is a clear and crucial difference, but its implications are still unclear.

Figure 1. Successive snapshots of a burst in a suspension of particles with diameter  $d$ that flows intermittently through a constriction having neck width $1.1D$ and height $D=100\,\mathrm {\mu }{\rm m}$, with $D/d=3.03$. (a) Clog previous to a burst; (b) burst; and (c) clog after the burst. (a) and (c) are separated by approximately 10 ms.
Making use of statistical analysis on many-body flow through constrictions, very clear patterns have been identified (Zuriguel & Garcimartín Reference Zuriguel and Garcimartín2020) also in suspensions flows (Marin et al. Reference Marin, Lhuissier, Rossi and Kähler2018; Souzy, Zuriguel & Marin Reference Souzy, Zuriguel and Marin2020), but the role of the liquid flow is far from being well understood. A fluidic system like the one shown in figure 1 can be driven by forcing a constant volume of fluid per unit time (from now on volume-controlled), which will drag the solid particles along. When an arch is formed, the flow encounters higher hydrodynamic resistance in the constriction, and the local liquid velocity at the constriction will increase to comply with the demanded volume rate. On the contrary, if the system is driven by a hydrodynamic pressure difference (from now on pressure-controlled), the liquid flow velocity will reduce at the constriction upon clogging. Which situation will be more favourable for the mass transport through the constriction? In other words, does a higher local liquid flow velocity at the constriction favour the particle transport or does it rather stabilize arches by pushing particles harder together?
In order to answer this crucial question, in this paper we aim to elucidate the role of the liquid driving method in constricted flows of non-cohesive suspensions, in which the arch formation is due entirely to mechanical forces. Our method is based on reproducible experiments with significant amounts of data from which we can obtain significant statistics on both arch formation and destruction. Since the parametric space is so large, we choose to perform experiments in systems undergoing an intermittent flow regime, in which they are most sensitive to the control parameters. Using the same statistical tools as those employed in granular matter permits us also to make a direct comparison to those ‘dry’ counterparts and gain a deeper understanding of the role of liquid flow in the clogging of constricted suspensions by mechanical forces.
2. Experiments
Our experimental system is designed to flow in both pressure- and volume-controlled driving in an intermittent regime, in which particles flow in bursts, interrupted by the formation of a particle arch that interrupts the flow. Our aim is to obtain (1) the average amount of particles per burst, and (2) the probability distribution of time lapses, i.e. the time passing between bursts. The particle flow is characterized experimentally using these statistical tools, which assess how the system responds to either pressure or liquid volume rate changes.
The experimental set-up is shown in figure 1. The fluidic system consists of a single transparent straight channel of borosilicate glass (isotropic wet etching, Micronit microfluidics) with rectangular cross-section  $100 \times 400\,\mathrm {\mu }{\rm m}^2$ which reduces to an almost square cross-section $100\times 110\,\mathrm {\mu }{\rm m}^2$ to form the neck. The constriction is achieved by a linear narrowing of the channel with half-angle $60^{\circ }$. This specific design, similar of that used in previous studies (Marin et al. Reference Marin, Lhuissier, Rossi and Kähler2018; Souzy et al. Reference Souzy, Zuriguel and Marin2020), forms a two-dimensional nozzle converging towards the neck. Particles and liquid have been chosen carefully to avoid buoyancy effects, particle aggregation and particle deposition at the microchannel walls, an effect that has been analysed previously by many (Sendekie & Bacchin Reference Sendekie and Bacchin2016; Cejas et al. Reference Cejas, Monti, Truchet, Burnouf and Tabeling2017; Dressaire & Sauret Reference Dressaire and Sauret2017; Delouche et al. Reference Delouche, Schofield and Tabuteau2020, Reference Delouche, van Doorn, Kodger, Schofield, Sprakel and Tabuteau2021; Knippenberg et al. Reference Knippenberg, Lüders, Lozano, Nielaba and Bechinger2022). The suspension consists of monodisperse spherical polystyrene particles (Microparticles GmbH) of diameter $d=19.0$, 21.7 and $33.0\,\mathrm {\mu }{\rm m}$ ( $\pm 3$ %). Adopting the neck height $D=100\,\mathrm {\mu }{\rm m}$ as the characteristic length scale, these correspond to neck-to-particle ratios $D/d= 5.26$, 4.61 and 3.03, respectively. Particles are stabilized with negatively charged sulfate groups in a density-matched 26.3 wt% aqueous solution of glycerine, with density $\rho =1062\,{\rm kg}\,{\rm m}^{-3}$ and viscosity $\mu =2.1$ mPa s (Volk & Kähler Reference Volk and Kähler2018). The charged sulfate groups confer on them a small negative surface potential (of the order of $-50$ mV) but sufficient to prevent both their agglomeration and their adhesion to the channel walls (Sendekie & Bacchin Reference Sendekie and Bacchin2016). The suspension is prepared with a particle volume fraction of approximately $2\,\%$, then inserted in the device and driven downstream of the constriction towards a filter that allows only the fluid to flow through. Particles are therefore initially concentrated in that position.
The protocol is similar to the one used in Souzy et al. (Reference Souzy, Zuriguel and Marin2020): an experiment starts when the flow is reversed and particles are dragged by the fluid towards the constriction. Particles flow towards the constriction, forming a compact long ‘column’ of particles. The particle volume fraction as they reach the constriction is close to the random packing fraction, and the suspension is imaged with a high-speed CMOS camera (PCO.dimax CS1) coupled to an inverted microscope (Nikon Instruments, Eclipse TE2000-U). Using this protocol, we have obtained very reproducible results from run to run, despite the variable length of the particle column. Figure 1 presents successive snapshots of a typical intermittent flow experiment. The flow may become interrupted by the spontaneous formation of arches spanning the bottleneck (figure 1a). Upon the formation of an arch, the ‘column’ of particles eventually stops. Although the particle flow is interrupted abruptly through the neck constriction, the length of the particle aggregate that forms upstream of the constriction increases continuously, and the fluid keeps passing through the particles interstices, perturbing the arches, which may eventually collapse. If this happens, then the flow of particles is resumed (figure 1b) and a burst of particles escapes until the development of a new clog arrests the flow again (figure 1c). Note that arches are stabilized by the mutual friction among particles (Wyss et al. Reference Wyss, Blair, Morris, Stone and Weitz2006; Agbangla, Bacchin & Climent Reference Agbangla, Bacchin and Climent2014; Sendekie & Bacchin Reference Sendekie and Bacchin2016; Knippenberg et al. Reference Knippenberg, Lüders, Lozano, Nielaba and Bechinger2022), implying that, despite the presence of electrostatic stabilization, particle-to-particle contact is unavoidable. However, these contacts are not long-lasting as particles separate downstream of the constriction upon resuming the flow.
Before discussing the driving force inducing the flow, we would like to make two important remarks regarding this experimental set-up.
(i) The sole possible clogging mechanism here is by arching, when particles arriving simultaneously at the constriction form an arch that interrupts the flow of particles, i.e. competition of too many particles for little space. Therefore, clogging cannot occur by aggregation (Sendekie & Bacchin Reference Sendekie and Bacchin2016; Dressaire & Sauret Reference Dressaire and Sauret2017; Delouche et al. Reference Delouche, van Doorn, Kodger, Schofield, Sprakel and Tabuteau2021), successive deposition (Agbangla et al. Reference Agbangla, Climent and Bacchin2012; Dersoir et al. Reference Dersoir, de Saint Vincent, Abkarian and Tabuteau2015; Duru & Hallez Reference Duru and Hallez2015; Delouche et al. Reference Delouche, Schofield and Tabuteau2020) or sieving (i.e. particles being larger than the constriction; Sauret et al. Reference Sauret, Barney, Perro, Villermaux, Stone and Dressaire2014).
(ii) The reason for using such a particle size range is dual. On the one hand, we avoid colloidal particle interactions and Brownian motion as the Péclet number is $Pe=\langle U\rangle d / D_0> 10^6$, with $\langle U\rangle$ the average flowing particle velocity at the neck, $D_0=k_BT/3{\rm \pi} \mu d$, where $k_B$ is the Boltzmann constant, and $T=298\,{\rm K}$ is the room temperature. On the other hand, increasing the particle size further would also involve handling larger volumes of fluid, i.e. larger Reynolds number $Re$ and higher working pressures. Therefore, the range of particle size chosen allows us to work with highly monodisperse particles interacting mainly by hydrodynamic interactions and low-pressure solid contacts, manipulated via microfluidic technology, which allows us to obtain a high degree of control and reproducibility that is difficult to achieve at other length scales. Each experiment is typically repeated ${\sim }30\unicode{x2013}50$ times, where typically, each recorded run monitors tens of clog formation/destruction events.


2.1. Liquid flow driving: volume-controlled vs pressure-controlled
To investigate the role of the liquid driving on the clogging/unclogging of constricted particle suspensions, we performed two sets of experiments, where we drive the flow imposing either the flow rate (volume-controlled) or the pressure (pressure-controlled). In both cases, we report the results obtained for neck-to-particle size ratios  $D/d= 5.26$, 4.61 and 3.03. These specific values of the neck-to-particle size ratios are selected as they allow us to explore the limits of aspect ratios for which intermittency has been reported in a previous study performed within the same set-up (Souzy et al. Reference Souzy, Zuriguel and Marin2020).
The experimental fluidic system has been designed carefully to minimize the flow response time using short rigid tubings (PEEK), a glass microchannel, and a steel syringe for volume-controlled driving experiments. We checked quantitatively that the response time of the two sets of experiments are similar, by monitoring the temporal evolution of the velocity of particles  $U$ flowing through the neck constriction; following a short initial transient period that typically lasts ${\lesssim }15\,\%$ of the experiment duration, short and mild fluctuations in the measured particle velocity have been measured in both driving methods, as a consequence of the constant reorganization of the particle network (more details in Appendix B). We checked quantitatively that these fluctuations are similar both in amplitude and duration between both methods, and that the transient time associated with such fluctuations (which can occur after an unclogging event, for instance) does not persist over a period long enough to impact the next clogging. Additionally, flow fluctuations induced by the pump (Li et al. Reference Li, Mak, Sauret and Shum2014) either do not reach the region of the constriction or are too small to be detected, as we have confirmed by particle tracking measurements in the vicinity of the neck.
2.1.1. Volume-controlled driving
In the first set of experiments, the suspension is driven through the constriction at a constant volume flux using a syringe pump (Harvard Apparatus). The flow rate  $Q$ is varied within the range $0.005 \leq Q \leq 2\, {\rm ml}\,{\rm min}^{-1}$, and the average particle velocity at the constriction neck is in the range $2.8 \leq \langle U\rangle \leq 181\, {\rm mm}\,{\rm s}^{-1}$, corresponding to Reynolds numbers $Re=\rho \langle U\rangle d /\mu$ in the range $0.031\leq Re\leq 1.99$. Note that even at the highest pressures, the flow is always viscosity-dominated. Reynolds numbers are employed here simply as a way to non-dimensionalize velocities, since the only time scales in the system are given by the driven flow and the liquid's viscosity. The average particle velocity $\langle U \rangle$ is used to define the Stokes time $\tau =d/\langle U\rangle$ (the time a particle takes to travel its own diameter), which will be used as the characteristic flow time scale. The use of a syringe pump implies that a constant liquid volume flux is forced through the channel, even when an arch forms at the bottleneck, blocking particles. In that case, only liquid flows through the bottleneck, and pressure increases locally due to the increased hydrodynamic resistance. For safety, the upstream pressure is measured and the experiment is stopped and re-initialized to avoid damage in the set-up if the pressure reaches 700 kPa.
2.1.2. Pressure-controlled driving
The second set of experiments is performed driving the flow with a constant pressure using a microfluidic flow control system (Fluigent). The pressure  $P$ is varied within the range $2 \leq P \leq 200$ kPa, and the average particle velocity at the constriction neck is in the range $0.9 \leq \langle U\rangle \leq 17.9\,{\rm mm}\,{\rm s}^{-1}$, corresponding to Reynolds number $0.009\leq Re\leq 0.197$. Driving the flow with a constant pressure implies that when a clog forms, the hydraulic resistance increases rapidly as the particles accumulate upstream of the constriction neck (Kim, Ahn & Lee Reference Kim, Ahn and Lee2017; Sauret et al. Reference Sauret, Somszor, Villermaux and Dressaire2018). A constant pressure configuration can thus be considered as self-regulated: the clog reduces both the liquid and particle flow, preventing any damage in the fluidic system.
3. Results
The overall intermittent behaviour, in which several flow and arrested periods of time alternate, can be better visualized in spatio-temporal diagrams as shown in figure 2. As a visual guide, in the figures throughout the paper an orange background refers to the volume-controlled configuration, while a green background refers to the pressure-driven configuration. There, in order to analyse the different regimes of particle flow, we report the results obtained for  $D/d = 4.61$. A spatio-temporal diagram is constructed by selecting a vertical line of unit pixel width at the middle of the constriction. This line is then sampled for every frame and is stacked alongside. Interestingly, for the volume-controlled driving (figure 2a), there is no clear qualitative difference in the flow behaviour in the investigated range of flow rate. Conversely, for the pressure-controlled driving (figure 2b), the diagrams clearly reveal a difference in the flow behaviour: for $P=5$ kPa, the flow of particles (which appears dark) is almost continuous, with only a few short-lasting arrest times (which appear in light grey). As $P$ is increased up to $P=200$ kPa, fewer particles escape when a burst of particles is released, and the arrest times become longer and more abundant.

Figure 2. Spatio-temporal diagrams at the constriction neck for  $D/d=4.61$. (a) For volume-controlled driving, varying the flow rate $0.005< Q<2\,{\rm ml}\,{\rm min}^{-1}$ does not affect the intermittent flow of particles. (b) For pressure-controlled driving, increasing $P$ induces fewer particles escaping (dark) before a clog forms, and longer arrest times (in grey). The red-framed diagrams highlight two similar $Re$ configurations (see also table 1).
Table 1. Values of  $Re$,
$Re$,  $\langle s\rangle$ and $\alpha$ for various neck-to-particle size ratios, for volume-controlled and pressure-controlled driving. Grey areas indicate non-investigated parameter values. NA indicates non-intermittent configurations for which we could not estimate the corresponding values: $^{a}$continuous particle flow, and $^{b}$everlasting clog. Red frames highlight two similar Reynolds number configurations (see also the corresponding spatio-temporal diagrams in figure 2).

In what follows, we will quantify the intermittent dynamics by analysing separately the arch formation and destruction processes by looking at the statistics of burst sizes and arrest times, respectively.
3.1. Burst size/clogging probability
Similarly to pedestrians (Garcimartín et al. Reference Garcimartín, Parisi, Pastor, Martín-Gómez and Zuriguel2016), animal flocks (Garcimartín et al. Reference Garcimartín, Pastor, Ferrer, Ramos, Martín-Gómez and Zuriguel2015) and avalanches (Fisher Reference Fisher1998), the number of entities escaping per burst has been found to follow an exponential distribution in constricted flow of suspensions (Souzy et al. Reference Souzy, Zuriguel and Marin2020) (see also Appendix A). This reveals that the arch formation follows a Poisson process, with an exponential dependence of the discharged particle mass on the neck-to-particle size ratio. Consequently, the average number  $\langle s\rangle$ of escaping particles per burst is a good proxy for the probability of clogging.
Since we cannot track individual particles in all cases, we compute the total number of particles in an indirect fashion. We first determine the total number of escapees per burst  $N_{tot}=t_{part}^{flow}\times Q_{part}^{flow}$, where $t_{part}^{flow}$ is the duration of a burst or the time during which particles flow through the constriction between two consecutive clogs, and $Q_{part}^{flow}$ is the particle rate when the system is not clogged. The particle rate can be computed easily as $Q_{part}^{flow}= \langle U\rangle \phi _c S_{neck}/V_p$, with $\phi _c\approx 63\,\%$ the random close-packing volumetric fraction for monodisperse spheres, $S_{neck}$ the constriction-neck cross-section, and $V_p={\rm \pi} d^3/6$ the volume of a single particle. The average number of escapees per burst is thus given by $\langle s\rangle = N_{tot}/N_{bursts}$, where $N_{bursts}$ is the number of burst events.
Given the discrete nature of the system, defining an arrest/clog time threshold to set apart successive bursts is not straightforward. This is done by looking at the distribution of times between the passage of two consecutive particles (as will be shown below). From those distributions, and using the Clauset–Shalizi–Newman method (Clauset, Shalizi & Newman Reference Clauset, Shalizi and Newman2009), a characteristic minimum time  $T_{min}$ is obtained. We define a clog event as any event where the time lapse $T$ between the passage of two consecutive particles is such that $T\geq T_{min}$. We checked that this choice does not affect the general trend of our results.
Figure 3 shows  $\langle s\rangle$ for various neck-to-particle size ratios $D/d$. The horizontal error bars indicate the standard deviation of the flowing particle velocity measurement $U$, obtained by performing particle image velocimetry (PIV) at the constriction neck when particles are flowing. The vertical error bars are computed using the standard deviation of the number of escapees. In total, under either pressure or flow-rate driving conditions, for each fixed value of $D/d$, more than 1500 bursts have been analysed per $Re$ value. As is well-known in dry systems (To, Lai & Pak Reference To, Lai and Pak2001; Zuriguel et al. Reference Zuriguel, Garcimartín, Maza, Pugnaloni and Pastor2005; Thomas & Durian Reference Thomas and Durian2015), the neck-to-particle size ratio is the governing parameter for the intermittent clogging statistics, therefore it is not surprising to observe a steep increase of $\langle s \rangle$ for higher $D/d$.

Figure 3. Average number  $\langle s\rangle$ of escapees per burst, for various neck-to-particle size ratios $D/d$. (a) In the volume-driven configuration, $\langle s\rangle$ remains almost constant when varying the flow rate $Q$. For $D/d=3.03$, no intermittency is observed for $Re > 0.478$ ( $Q > 0.1\, {\rm ml}\,{\rm min}^{-1}$) as any developed clog is permanent and everlasting. (b) In the pressure-driven configuration, $\langle s\rangle$ decreases when increasing the imposed pressure $P$. For $D/d=5.26$, the flow of particles is continuous for $Re\leq 0.025$ ( $P\leq 48$ kPa).
In figure 3(a), we show the average number of escapees per burst for the volume-controlled configuration for different particle sizes ( $D/d$) and flow rates ( $Re$). First, regarding the effect on the particle size, the average number of escapees $\langle s\rangle$ increases by one or two orders of magnitude when we reduce the particle size by just 33 % (from $D/d=3.03$ to $D/d=4.61$). An even smaller relative decrease of the particle size results in a continuous flow of particles for $D/d=5.26$, in which $\langle s\rangle$ could not be defined (over the range of investigated $Q$), which is consistent with what was reported in Souzy et al. (Reference Souzy, Zuriguel and Marin2020). Regarding the dependence with the flow rate ( $Re$), the trend is not entirely clear: for $D/d=4.61$, the number of escapees decreases noticeably with increasing $Re$, up to a certain value, where we report a sudden increase. The other set of data, $D/d=3.03$, shows a somewhat different trend, with low sensitivity to the change of flow rate in the same range of values, and sudden permanent clogs after a critical Reynolds number/flow rate ( $Q\geq 0.5\, {\rm ml}\,{\rm min}^{-1}$). After this critical point, any particle arch is either permanent or lasting more than our largest measurable time scale. This is limited by the maximum time that can be captured on our camera's digital memory, which sets the maximum number of frames that we can capture on each experiment. Nevertheless, the experiments are designed to guarantee that the duration of each recording is at least four orders of magnitude larger than the Stokes time. More concretely, maximum number of frames that we can acquire is $2^{16}=65\,536$. For this particular experiment, with $D/d=3.03$ and flow rate $Q=0.5\,{\rm ml}\,{\rm min}^{-1}$, running the camera at 5000 fps sets the maximum recording time to 13 s, which represents roughly more than 10 000 times Stokes time $\tau$ based on the flow of particles that manage to get through the constriction prior to the eventual formation of a ‘permanent’ arch. We therefore conclude that within the accessible parameter range and the observable time window, when running the system using a syringe pump, we observe the expected dependency of $\langle s \rangle$ on $D/d$, and a certain decrease of the number of escapees with increasing flow rate in the range $0.02< Re<1$.
The average number of escapees per burst for the pressure-controlled configuration is shown in figure 3(b), for practically the same range of  $Re$ as in figure 3(a), showing a similar overall trend, yet with subtle differences. An increase in pressure $P$ (and therefore an increase in particle velocity and $Re$) leads to a decrease in the average number of escapees $\langle s \rangle$, thus increasing the clogging probability, similarly to the volume-controlled driving. Interestingly, a noticeable difference is given for the smallest particle size, corresponding to $D/d=5.26$: for comparable particle velocities as in the volume-controlled experiments, we observe a continuous particle flow when the flow rate is imposed, while the flow is intermittent for the pressure-driven configuration.
In summary, both the pressure- and volume-driven configurations show a decreasing average number of escapees  $\langle s \rangle$ with increasing flow rates and pressures, respectively. Note that this is exactly the opposite response reported for clogging with cohesive suspensions. In such cases, higher pressure leads to increased shear and to the fragmentation of particle aggregates or the detachment of wall-deposited particles, and thus to a decrease of the clogging probability (Dersoir et al. Reference Dersoir, de Saint Vincent, Abkarian and Tabuteau2015; Kim et al. Reference Kim, Ahn and Lee2017; Delouche et al. Reference Delouche, van Doorn, Kodger, Schofield, Sprakel and Tabuteau2021). It is nonetheless a striking result even in the absence of cohesive forces, as it suggests a counter-intuitive effect of the driving force on the clog development process for constricted particle suspensions.
It has been suggested previously that clogging in constricted suspensions by mechanical forces occurs when the particle rate reaches a certain critical value, below which bridging will not occur since hydrodynamic forces at the constriction have to overcome the repulsion barrier (Agbangla et al. Reference Agbangla, Climent and Bacchin2012; Hsu et al. Reference Hsu, Baysal, Wirenborn, Mårtensson, Wittberg and Isa2021). Our results reveal that clogging by arching of non-cohesive suspensions is set not only by the particle velocity (Ramachandran & Fogler Reference Ramachandran and Fogler1999; Guariguata et al. Reference Guariguata, Pascall, Gilmer, Sum, Sloan, Koh and Wu2012) but also by the liquid driving choice, as for a given aspect ratio and particle velocity, different qualitative and quantitative behaviours are observed, depending on whether the flow is driven imposing a flow rate or pressure.
While the dependence of the arch formation on the liquid driving method is somewhat subtle in the data shown so far, it will be much more noticeable on the arch destruction process, which will be analysed using the statistical distribution of time lapses.
3.2. Arch destruction/unclogging probability
In order to investigate the unclogging process, we now analyse the probability distributions of time lapses  $T$ between the passages of consecutive particles. This approach has been implemented extensively in previous studies on intermittent flowing systems, such as hungry sheep herds (Garcimartín et al. Reference Garcimartín, Pastor, Ferrer, Ramos, Martín-Gómez and Zuriguel2015), pedestrian crowds (Helbing et al. Reference Helbing, Buzna, Johansson and Werner2005; Krausz & Bauckhage Reference Krausz and Bauckhage2012; Garcimartín et al. Reference Garcimartín, Parisi, Pastor, Martín-Gómez and Zuriguel2016), mice escaping a water pool (Saloma et al. Reference Saloma, Perez, Tapang, Lim and Palmes-Saloma2003), or vibrated silos of dry granular material (Janda et al. Reference Janda, Maza, Garcimartín, Kolb, Lanuza and Clément2009; Lastakowski, Géminard & Vidal Reference Lastakowski, Géminard and Vidal2015). In such systems, the distribution of arrested time lapses exhibits a power-law tail $P(T)\propto T^{-\alpha }$, a signature of systems susceptible to clogging (Zuriguel et al. Reference Zuriguel2014; Zuriguel & Garcimartín Reference Zuriguel and Garcimartín2020). Furthermore, the value of the exponent $\alpha$ can be related directly to the long-term behaviour of the system: the average time lapses $\langle T\rangle$ can be defined only for distributions fulfilling $\alpha >2$, while $\langle T\rangle$ diverges for $\alpha \leq 2$. This feature has therefore been interpreted as a transition to a scenario in which a permanent clog could occur eventually with finite probability. Indeed, for $\alpha \leq 2$, there is a non-zero probability of observing everlasting clogs, while for $\alpha >2$, the system can be blocked temporarily due to the formation of clogs, but no arch will persist infinitely. More detailed discussions can be found in Zuriguel et al. (Reference Zuriguel2014), Zuriguel & Garcimartín (Reference Zuriguel and Garcimartín2020) or Garcimartín et al. (Reference Garcimartín, Guerrero, Nicolas, da Silva and Zuriguel2021).
Figure 4 presents the probability distribution of the arrest lapses obtained for  ${D/d=3.03}$ with pressure-controlled driving. The distribution $P(T/\tau )$ exhibits the characteristic power-law tail $P(T/\tau )\propto (T/\tau )^{-\alpha }$. The time lapse probability distribution is obtained for $0.013\leq Re\leq 0.399$ (corresponding to $2\leq P\leq 200$ kPa). Note that we have been able to measure time lapses up to four orders of magnitude larger than the Stokes time, and that under either pressure or flow-rate driving conditions, for each fixed value of $D/d$, around 2000 bursts have been analysed per $Re$ value.

Figure 4. Distribution of the arrest time lapses normalized by the Stokes time  $T/\tau$ for $D/d=3.03$ with pressure-controlled driving. The lines correspond to the best power-law fits with their exponent $\alpha$, as given by the Clauset–Shalizi–Newman method (Clauset et al. Reference Clauset, Shalizi and Newman2009).
Finding the right parameters for power-law tails can easily suffer from arbitrary biases, therefore the exponent  $\alpha$ of the power-law tail is obtained using the rigorous and widely accepted Clauset–Shalizi–Newman method (Clauset et al. Reference Clauset, Shalizi and Newman2009). This method also yields the estimated error of the fit and gives the minimum time lapse $T_{min}$ from which the power-law fit is valid – which is the time lapse used to set apart consecutive bursts, as mentioned before.
Figure 5 presents the value of  $\alpha$ for various neck-to-particle size ratios $D/d$ and different liquid driving methods. The vertical error bars are given directly by the Clauset–Shalizi–Newman method (Clauset et al. Reference Clauset, Shalizi and Newman2009), and they represent the standard error of the fit to a power law. The first thing to notice, as reported previously (Souzy et al. Reference Souzy, Zuriguel and Marin2020), is that the value of $\alpha$ decreases significantly with the neck-to-particle size ratio $D/d$. This is expected: the smaller the particles, the higher the value of $\alpha$, thus the higher the probability of short-lived clogs. This highlights the fact that arches composed of more particles (large $D/d$) are less stable, and thus more prone to break due to the perturbations induced by the interstitial flow. In other words, shorter arches are stronger than longer ones.

Figure 5. Exponent  $\alpha$ of the power-law tail of the time lapse distribution $P(T/\tau )\propto (T/\tau )^{-\alpha }$. (a) In the volume-driven configuration, $\alpha$ remains almost constant when varying the flow rate $Q$. For $D/d=3.03$, no value of $\alpha$ could be defined for $Re > 0.478$ ( $Q > 0.1\, {\rm ml}\,{\rm min}^{-1}$) as there is no intermittency. (b) In the pressure-driven configuration, $\alpha$ exhibits a power-law decrease $\alpha \propto Re^{-0.076}$. For $D/d=5.26$, no value of $\alpha$ could be defined for $Re\leq 0.025$ ( $P\leq 48$ kPa) as there is a continuous flow of particles. The explicit values of $\alpha$ can be found in table 1.
The response of the system to different driving liquid methods is more noticeable here: for the volume-controlled configuration (figure 5a), the exponent  $\alpha$ remains practically constant over more than two decades of flow rate values, while there is a clear and robust dependence for the pressure-controlled configuration (figure 5b). More specifically, in the pressure-controlled configuration, $\alpha$ exhibits a clear power-law decrease, which is well fitted by $\alpha \propto Re^{-0.076}$ over two decades. This trend is found consistently for both $D/d=3.03$ and $4.61$. The decrease in $\alpha$ indicates that for higher imposed pressure, the probability of long-lived (i.e. more stable) clogs increases. Again, note that this is precisely the opposite trend observed with cohesive suspensions (Dersoir et al. Reference Dersoir, de Saint Vincent, Abkarian and Tabuteau2015; Kim et al. Reference Kim, Ahn and Lee2017; Delouche et al. Reference Delouche, van Doorn, Kodger, Schofield, Sprakel and Tabuteau2021). As mentioned in the previous subsection, for $D/d=5.26$, the flow is found to be intermittent only for $Re\geq 0.108$ ( $P\geq 200$ kPa), thus the exponent $\alpha$ could be determined only for the maximum experimental pressure that we could impose.
4. Discussions and conclusion
Using direct visualization at the particle scale, flow measurements and statistical techniques, we investigate the role of the liquid driving in the intermittent flow of non-cohesive particle suspension through a constriction by reporting the average number of escapees per burst  $\langle s\rangle$ (a proxy for the probability of clog formation), and the exponent $\alpha$ of the power-law tail of the distribution of arrest time (connected to the probability of clog persistence).
Our aim was to answer the apparently trivial question: will more particles pass through the constriction if we ‘push’ the liquid harder? The answer that we have found is complex and depends on the way the liquid is being driven through the channel. Surprisingly, we find striking differences in the clog destruction process, but not for the clog formation process, depending on how the liquid is driven.
When a constant liquid flow rate is imposed,  $\langle s\rangle$ decreases with the flow rate, but $\alpha$ appears to be practically constant over the range $0.031\leq Re\leq 1.98$ ( $0.005\leq Q\leq 2\, {\rm ml}\,{\rm min}^{-1}$). In this sense, the probability of forming an arch is weakly dependent on the imposed flow rate, but the probability of breaking it is practically independent of the liquid flow rate. There is, however, an exception for the largest particle size tested ( $D/d=3.03$), for which we observe a sudden transition from intermittent to permanent clog when $Re$ is increased from 0.47 to 0.6 (figures 3a and 5a). We do not have a clear explanation for this sudden transition. It could be due to certain critical behaviour at a certain flow rate, but it could also be an experimental limitation due to our limited time to capture long enough arrest times. Note that these results are in agreement with our previous work (Souzy et al. Reference Souzy, Zuriguel and Marin2020), performed in the volume-controlled configuration, for which we found only intermittent regimes with $\alpha \leq 2$. Consequently, our previous and current results imply that volume-controlled driving leads to intermittent regimes with a high probability of persistent clogs, practically independent of the liquid flow rate applied.
For the pressure-controlled configuration, both  $\langle s\rangle$ and $\alpha$ decrease when increasing the pressure $P$. Such a trend is found consistently for $D/d=3.03$ and $4.61$. For the smallest particle size ( $D/d=5.26$), the system flows continuously for low pressures, and it becomes intermittent after increasing the pressure (or $Re$) above a certain value ( $P\geq 200$ kPa, $Re=0.102$). Remarkably, for $D/d=4.61$ and $5.26$, values $\alpha >2$ were found in the pressure-controlled configuration, thus indicating that the intermittent regimes would continue indefinitely, with clogs that would not persist. Thus in the pressure-controlled configuration, a non-cohesive suspension passing through a constriction behaves similarly to other scenarios where clogging transitions have been reported based on the power-law tails of the arrest times, such as vibrated silos (Janda et al. Reference Janda, Maza, Garcimartín, Kolb, Lanuza and Clément2009), Brownian particles (Hidalgo et al. Reference Hidalgo, Goñi-Arana, Hernández-Puerta and Pagonabarraga2018), pedestrians (Zuriguel et al. Reference Zuriguel2014) and self-propelled robots (Patterson et al. Reference Patterson, Fierens, Jimka, König, Garcimartín, Zuriguel, Pugnaloni and Parisi2017). All those systems reported a fairly smooth transition from an intermittent clogged state ( $\alpha \leq 2$) to a continuous flow, passing through a region of intermittent flow with $\alpha >2$.
It is not entirely clear to us why such a smooth transition does not occur with a volume-controlled driving. In this respect, note that due to the narrow size distribution of our particles, the number of particle configurations that result in a stable arch is greatly reduced. That might have an impact in the different regimes that could manifest, and could be an explanation for the sudden transition from an intermittent clogged state ( $\alpha \leq 2$) to a continuous flow regime in the volume-controlled driving. Nevertheless, whether such a regime ( $\alpha >2$) exists or not in the volume-controlled driving configuration remains an open question, which we will continue studying in the future.
We could rationalize the results in the following way. On the one hand, the arch formation follows generally similar trends for both liquid driving configurations: a higher liquid velocity at the neck (higher  $Re$) induces a higher number of escaping particles per unit time during burst periods. This leads to shorter and faster bursts, and a somewhat decreased number of particles per burst. Such a decrease might be related to the larger hydrodynamic shear that the particles suffer, associated with the higher liquid flow velocity, which would bring particles closer together and facilitate the formation of arches. Quantitatively speaking, the average burst size does not depend strongly on the choice of liquid driving (as shown in figure 3 and discussed in § 3.1).
On the other hand, the arrest time statistics, and hence the clog breakup mechanism, is clearly more sensitive to the driving method: as shown in figure 5 (and discussed in § 3.2), the arrest time statistics are practically independent of the flow rate in a system controlled by a syringe pump. In such a system, whenever a clog is formed, the liquid flow responds, increasing the pressure locally in the region of the arch, and therefore the flow velocity too. Particles accumulate progressively behind the newly formed arch, increasing the hydrodynamic resistance further as the aggregate's length increases. Since the liquid flow rate needs to be kept constant, the liquid velocity, and therefore the drag pushing particles together, increases. This would lead to an increased and more stable contact chain force network, probably close to jamming, following Cates’ definition (Cates et al. Reference Cates, Wittmer, Bouchaud and Claudin1998). That compact network imposes such a large hydrodynamic resistance that a flow rate increase (in the range explored here) does not change significantly the stability of the arch. Consequently,  $\alpha$ remains effectively constant for the range of flow rates explored. However, in a pressure-controlled system, the local pressure, and therefore the liquid velocity, decreases in the arch and its vicinity, leaving a rather loose packing in the region behind the arch. An increase in pressure leads to a larger compacted region upstream of the arch, stabilizing it. Therefore, lower pressure results actually in less stable arches, which translates into better net particle transport. While driving the flow imposing low-pressure results in intermittent non-persistent clogs, increasing the imposed pressure results in longer-lasting clogs, eventually becoming everlasting, thus mitigating the particle transport rate: a fluid-dynamical version of the ‘slower is faster’ effect observed in pedestrians (Zuriguel et al. Reference Zuriguel2014).
Why is there more sensitivity in the liquid driving method for arch formation than for the arch breakage? During a burst, the system flows with the same hydrodynamic resistance regardless of the liquid driving, so there should not be any difference in the behaviour of the system. The arch formation is a random process that depends simply on the number of arch configurations (or microstates; see Koivisto & Durian Reference Koivisto and Durian2017) randomly sampled by the system per unit time. We have confirmed that the particle rate during a burst is dependent only on the velocity field around the neck area, and completely independent of the liquid driving (Appendix C), and therefore both liquid driving methods explore the number of potential arch configurations at comparable rate. The differences between pressure- and volume-controlled driving manifest most dramatically whenever a clog occurs. The hydrodynamic pressure on the arch and its vicinity reduces in a pressure-controlled system, and increases in a volume-controlled system. We have hypothesized above about the reasons why the reduction of hydrodynamic pressure spoils the arch's stability, but more research needs to be dedicated to understand this mechanism. Numerical simulations capable of solving the continuous flow together with the particle dynamics are still challenging, but will be crucial to understanding this phenomenon.
During a continuous flow period, or during a burst, our results could be somewhat compared with the experiments of Aguirre et al. (Reference Aguirre, Grande, Calvo, Pugnaloni and Géminard2010), in which circular disks were driven towards an aperture driven not by gravity, but by a conveyor belt in which the velocity could be controlled. In some sense, the drag produced by the conveyor belt could be an analogue to the drag produced by the flow in our system. Using this system in the continuous flow regime ( $4.5\leq D/d\leq 10$), Aguirre et al. (Reference Aguirre, Grande, Calvo, Pugnaloni and Géminard2010) demonstrated that the rate of dry granular material through an aperture is controlled by the velocity at the aperture imposed on the particles and not by the ‘pressure’ at the base – where ‘pressure’ in the context of dry granular matter is related only by the particles’ weight over a certain area. Interestingly, in our case, the particle flow rate during a burst (or in a continuous regime) is directly proportional to the particle's velocity and independent of the liquid flow driving method (see Appendix C).
The results shown in this paper stand in stark contrast with what is reported for cohesive particle suspensions, which follows a more intuitive trend. The shear flow counteracts particle adhesive forces, and therefore an increase of pressure or flow rate leads a decrease of the clogging probability (Dersoir et al. Reference Dersoir, de Saint Vincent, Abkarian and Tabuteau2015; Kim et al. Reference Kim, Ahn and Lee2017; Delouche et al. Reference Delouche, van Doorn, Kodger, Schofield, Sprakel and Tabuteau2021).
Our results provide new efficient strategies for controlling the flow of non-cohesive particle suspensions driven through constrictions. Several strategies have already been investigated based on different parameters. For example, Arévalo et al. (Reference Arévalo, Zuriguel, Maza and Garcimartín2014) showed using simulations that gravity decreases the probability of both clogging and unclogging for granular inert particles passing through a bottleneck. Janda et al. (Reference Janda, Maza, Garcimartín, Kolb, Lanuza and Clément2009) and Mankoc et al. (Reference Mankoc, Garcimartín, Zuriguel, Maza and Pugnaloni2009) showed experimentally that for dry granular silos, applying strong vibrations decreases the clogging probability, and that the remaining clogs also break more easily. Hidalgo et al. (Reference Hidalgo, Goñi-Arana, Hernández-Puerta and Pagonabarraga2018) showed using simulations that increasing the thermal fluctuations in Brownian suspensions leads to an increase of both the clogging and the unclogging probabilities. We herein show that for non-Brownian and non-cohesive suspensions, increasing the driving pressure leads to an increase of the clogging probability and a decrease of the unclogging probability. Consequently, an efficient strategy for limiting clogging of non-cohesive particle suspension is to drive the flow imposing lower pressure.
There are a number of open questions that we cannot answer fully at the moment, but we will discuss them below based on our current observations. For example, we cannot entirely reject the presence of particle dilatancy due to shear close to the constriction (Kulkarni, Metzger & Morris Reference Kulkarni, Metzger and Morris2010) during the flowing periods. However, the intermittent nature of the regimes studied here probably eclipses effects caused by dilation (like self-filtration, which in this case occurs naturally due to clogging). Proving the presence of dilatancy effects would require a more sophisticated set-up to be able to measure pressure differences between positions upstream and the constriction.
Another question that arises from our results is whether the same mechanism discussed here would apply for dilute suspensions. We believe that this is the case, but at different time scales. Our main argument to explain the different behaviour between volume- and pressure-controlled driving is based on the fact that the system responds differently to an increase of hydraulic resistance. In the dilute case, the increase of resistance after the formation of a clog is small, and it would increase slowly as a particle column forms. Once the particle column behind the first arch is large enough, and the arch is not fully stabilized, the system might turn intermittent and behave basically identically to the one that we have investigated here. In any case, whether that ‘build-up’ time would interfere with the arch stability and the intermittency time distribution would need to be checked experimentally for different  $D/d$ ratios. The advantage of using a dense suspension in this case is the quick response of the system and the high reproducibility of the intermittent flow, in which one can observe a clear power law for the time lapse distribution. The extended time scale and the low rate of events in the dilute case would make the experiments even more challenging. Using diluted suspensions (Marin et al. Reference Marin, Lhuissier, Rossi and Kähler2018), we concluded that the arch formation follows essentially the same mechanism and statistics as in the concentrated case, except that the sampling rate of the ‘microstates’ (Koivisto & Durian Reference Koivisto and Durian2017) is rather discontinuous and patchy (Vani, Escudier & Sauret Reference Vani, Escudier and Sauret2022).
Acknowledgements
The authors would like to acknowledge the motivation for this work and insights from Iker Zuriguel, and also to Devaraj van der Meer for multiple discussions and suggestions.
Funding
This work was supported by an ERC (European Research Council) starting grant (grant agreement no. 678573).
Declaration of interests
The authors report no conflict of interest.
Appendix A. Flow/Burst time distribution
In a previous paper (Souzy et al. Reference Souzy, Zuriguel and Marin2020), we confirmed – using a volume-controlled configuration – that both the distribution of burst size  $p(s)$ and the distribution of flowing (or bursting times) $p(T_{flow})$ follow exponential laws with $s$ and $T_{flow}$, respectively. In figure 6, we show measurements of $p(T_{flow}/\tau )$ for the data presented in the current paper in the pressure-controlled configuration.

Figure 6. Distribution of the burst time  $P(T_{flow}/\tau )$ for pressure-controlled driving for $D/d=4.61$. The lines correspond to the expected exponential trend. The difference in the slopes of the exponential fits indicates that the average number of escapees $\langle s\rangle$ is quantitatively different between these two configurations.
The exponential trend shown in figure 6 for two different pressure (and Reynolds number) values confirms that the method employed here is reliable even in the present very dense system explored over a large range of imposed pressures. Consequently, the average number of escapees per burst is as good a proxy of the arch formation process as the average  $\langle T_{flow}/\tau \rangle$.
Appendix B. Flow fluctuations induced by syringe pumps
We confirm here that the transients and flow fluctuations within our microfluidic set-up are negligible, as we carefully choose the channel material (glass), the tubing and the connectors (both PEEK tubing, elastic modulus approximately 3 GPa), and stainless steel syringes (for volume-controlled driving). To prove our point, figure 7 shows particle velocity measurements of the passing particles at the neck using both volume-controlled (figure 7a) and pressure-controlled driving (figure 7c). As can be seen, the transients in both cases (and all other cases) are  ${\leq }15\,\%$ of the total measurement time and very similar for both drivings (a few seconds in figures 7a,c). We interpret the observed transient as a signature of the time it takes for the suspension to reach a stable (dense) concentration in the neck region. Figures 7(b,d) show the binary signals used to detect bursts/clogs, based on image analysis (particle detection) at the constriction neck, respectively for volume- and pressure-controlled driving. In addition, figures 7(a,c) show that after the short initial transient, the oscillations around the fixed value of the particle velocity are small compared to the main velocity. We checked that after the initial transient, the variations of mean particle velocity $\langle U \rangle$ and its corresponding standard deviation, from which are evaluated $Re$ and its error bars, are quantitatively similar for both pressure and flow-rate controlled experiments. Consequently, we confirm that the differences in arch-formation and arch-destruction processes between volume- and pressure-controlled driving are not driven by a discrepancy in the response time of the two apparatuses as their response times are quantitatively comparable. To further prove our point, we provide measurements of the flow rate in the volume-controlled driving in figure 8: the flow rate is quickly stabilized with undetectable oscillations upon clogging/unclogging events. This highlights that the response time of the system is short, such that arch formation or unclogging events when an arch breaks do not lead to flow rate variations that persist over a period long enough to impact the next clogging event.

Figure 7. For volume-controlled driving: (a) particle velocity at the neck (measured using PIV); and (b) clogging events ( $1\rightarrow$ clog, $0\rightarrow$ particle burst) for $D/d=4.61$, $Re=0.031$, $\left \langle s\right \rangle =46\,000$ and $\alpha =1.83$. For pressure-controlled driving: (c) particle velocity at the neck; and (d) clogging events for $D/d=4.61$, $Re=0.063$, $\left \langle s\right \rangle =15\,000$ and $\alpha =1.85$. Note that velocity can be measured only during particle bursts.

Figure 8. For volume-controlled driving: (a) flow rate measurement performed upstream of the constriction; and (b) clogging events ( $1\rightarrow$ clog, $0\rightarrow$ particle burst), for neck-to-particle ratio $D/d=3.03$ and Reynolds $Re=0.17$.
To conclude this appendix, and as mentioned in § 2.1, we corroborate that the fluctuations induced by the pump itself (Li et al. Reference Li, Mak, Sauret and Shum2014) are either too small to be detected or damped before reaching the region of the constriction, as we have not been able to measure any of those fluctuations in the particle velocities (at least at the typical frame rate of our experiments). We estimate that if any, such fluctuations should be in the range of 0.1 %, which is the order of magnitude of our error in the velocity measurements. One could wonder whether such fluctuations would influence the arch stability. To answer this question, we refer to classical studies on vibrated silos. For example, Mankoc et al. (Reference Mankoc, Garcimartín, Zuriguel, Maza and Pugnaloni2009) reported the effect of moderated vibrations ( ${\sim }22\,\%$ of the driving force) on the arch stability. In this sense, the force fluctuations in our system are therefore estimated to be two orders of magnitude smaller than the force disturbances ( ${\sim }22\,\%$) experienced by particles in moderated vibrated silos of dry particles such as investigated in Mankoc et al. (Reference Mankoc, Garcimartín, Zuriguel, Maza and Pugnaloni2009). Consequently, we conclude that if oscillations in the flow are present, then they should not play a significant role in the phenomena reported here.
Appendix C. Particle flow rate during a burst
Figure 9 shows the average particle flow rate during a burst, i.e. taking into account only the periods when the particles are flowing continuously. Interestingly, the average particle flow rate increases linearly with  $Re$, independently of the liquid flow driving method. As discussed in § 4, this is comparable to the experiments of Aguirre et al. (Reference Aguirre, Grande, Calvo, Pugnaloni and Géminard2010), in which circular disks are driven towards an aperture driven not by gravity, but by a conveyor belt in which the velocity could be controlled.

Figure 9. Average particle flow rate during a burst, (number of particles per second) taking into account only the periods when the particles are continuously flowing. Horizontal error bars indicate the standard deviation of the flowing particle velocity measurement  $U$, and vertical error bars are computed using the standard deviation of the number of escapees.


 Open access