


1. Introduction
A particle-laden plume is a multiphase convective flow comprised of fluid and particles originating from a localised source of buoyancy. Such flows are ubiquitous in both industry and the environment. Industrial examples include smoke plumes generated by combustion processes and the release of wastewater effluent into marine outfalls. In nature, explosive volcanic eruptions propel dense particles and fine ash tens of kilometres into the atmosphere and in the deep ocean, black smokers and gas hydrate plumes disperse metallic and carbon-rich particles in the water column.
Attention was first given to the physical behaviour and properties of particle-laden plumes by Carey, Sigurðsson & Sparks (Reference Carey, Sigurðsson and Sparks1988). In their unstratified plume experiments, they found that low concentration or ‘dilute’ particle-laden plumes behaved similarly to a single-phase plume with a reduced buoyancy flux. In the case of a single-phase plume, the buoyancy flux of the plume fluid,  $B_{0,f}$, is produced due to the presence of a density deficit between the fluid in the environment and the fluid in the plume. This quantity drives the upwards motion of the flow and is defined as
 \begin{equation} B_{0,f}=Q_0g\frac{(1-{\phi_0})({\rho_0}-{\rho_f})}{\rho_0}, \end{equation}
where  $Q_0$ is the volume flux at the source; $g$ is acceleration due to gravity; $\phi _0$ is the source particle volume fraction (which is equal to zero in a single-phase plume); and $\rho _f$ and $\rho _0$ are the density of the plume fluid and a reference density, generally taken as the density of the environment at the plume source. As observed by Carey et al. (Reference Carey, Sigurðsson and Sparks1988), when dense particles are introduced into the flow at the source, an additional negative buoyancy flux is present and is defined as
 \begin{equation} B_{0,p}=Q_0g\frac{{\phi_0}({\rho_0}-{\rho_p})}{\rho_0}, \end{equation}
where  $\rho _p$ is the particle density. In their unstratified experiments, Carey et al. (Reference Carey, Sigurðsson and Sparks1988) found that when the plume particle volume fraction was small (i.e. $B_{0,f}\gg -B_{0,p}$), the fine, dense particles were transported upwards with the plume before then subsequently spreading with the surface gravity current. The particles were observed to decouple from the radial flow and sediment into the ambient fluid below, creating a veil of particles around the plume. A portion of these particles in the sedimenting veil were re-entrained back into the main body of the plume; a process which the authors believed strongly impacted the plume dynamics.
Following this pioneering work, other experimental studies were conducted to gain a better understanding of the plume sedimentation behaviour (Sparks, Carey & Sigurðsson Reference Sparks, Carey and Sigurðsson1991; Ernst et al. Reference Ernst, Sparks, Carey and Bursik1996; Zarrebini & Cardoso Reference Zarrebini and Cardoso2000; Cardoso & Zarrebini Reference Cardoso and Zarrebini2001b) and the influence of particle re-entrainment on the plume dynamics (Veitch & Woods Reference Veitch and Woods2000; Cardoso & Zarrebini Reference Cardoso and Zarrebini2001a). Of the studies detailed above, all are associated with a plume rising in a uniform ambient with a gravity current spreading at the surface of an environment of finite vertical extent. Although a surface current can be compared with an intrusion of a stratified plume which spreads close to the height of neutral buoyancy, the absence of a linear density gradient inhibits dynamic behaviour which is likely to occur in particle-laden plumes rising through stratified environments.
The first linearly stratified particle-laden plume experiments were conducted by Mirajkar, Tirodkar & Balasubramanian (Reference Mirajkar, Tirodkar and Balasubramanian2015), who concentrated mostly on the maximum and spreading heights of the plume, as well as the spreading dynamics of the submerged plume intrusion. These authors shortly published a subsequent article, focusing their efforts on the parabolic cloud of fluid and particles which forms beneath the intrusion near the edge of the plume (Balasubramanian, Mirajkar & Banerjee Reference Balasubramanian, Mirajkar and Banerjee2018). Sutherland & Hong (Reference Sutherland and Hong2016) conducted stratified particle-laden plume experiments in an attempt to non-intrusively predict the particle sedimentation patterns using light attenuation techniques. Most recently, Mingotti & Woods (Reference Mingotti and Woods2020) completed a series of experiments with a primary focus of understanding the increase in intrusion interstitial fluid height following the sedimentation of particles from the plume's radially spreading gravity current.
Of the few authors to experimentally study stratified particle-laden plumes, all have noted that the maximum plume height was less than that of a single-phase plume due to particle re-entrainment. The maximum height of a single-phase plume was originally determined by Morton, Taylor & Turner (Reference Morton, Taylor and Turner1956) as
 \begin{equation} {z_{m}}=1.37{\alpha}^{{-}1/2}{B_0}^{1/4}{N}^{{-}3/4}, \end{equation}
where  $B_0$ is the plume buoyancy flux at the source and $\alpha$ is the top hat entrainment coefficient; $N$ is the ambient buoyancy frequency and is defined as
 \begin{equation} N=\sqrt{-\frac{g}{\rho_0} \frac{\textrm{d}\rho_e}{\textrm{d}z}}, \end{equation}
where  $\textrm {d}\rho _e/\textrm {d}z$ is the ambient density gradient.
Mirajkar et al. (Reference Mirajkar, Tirodkar and Balasubramanian2015) utilised an empirical method to alter (1.3) through the use of additional constants to fit their experimental data. However, their  $B_0$ terms excluded the negative buoyancy contributed by the particles in the plume at the source and they also considered the influence of particle settling velocity even though this remained constant throughout their experiments. Sutherland & Hong (Reference Sutherland and Hong2016) similarly fitted their results for intrusion height, $z_s$, empirically, however, due to having a relatively large momentum flux at the source, $M_0$, they classified their flows as forced plumes and presented their results as
 \begin{equation} \frac{z_s}{L_m}=f(\sigma), \end{equation}
where  $\sigma =(M_0N/B_0)^2$, a dimensionless parameter representing the balance between plume rise height ( $z_{m} \sim B_0^{1/4}N^{-3/4})$ and momentum jet length, $L_m=(M_0^{3}/B_0^{2})^{1/4}$ (Kaye Reference Kaye2008). Initially introduced by Morton (Reference Morton1959) and subsequently utilised by a number of authors including Fischer et al. (Reference Fischer, List, Koh, Imberger and Brooks1979) and Bloomfield & Kerr (Reference Bloomfield and Kerr1998), $\sigma$ allows forced flows to be compared with those with zero momentum at the source. Specifically, when $\sigma$ is small, buoyancy forces drive the flow's motion once the influence of stratification becomes important. Conversely, momentum forces dominate when $\sigma$ is large, note, however, that the definition of large varies between $\sigma >1$ (Fischer et al. Reference Fischer, List, Koh, Imberger and Brooks1979) and $\sigma >49$ (Richards, Aubourg & Sutherland Reference Richards, Aubourg and Sutherland2014).
A second important parameter to compare forced and pure plumes is the scaled source Richardson number,
 \begin{equation} {\varGamma_0}=\frac{5}{8 {\alpha}{\rm \pi}^{1/2}}\frac{{Q_0}^2{B_0}}{{M_0}^{5/2}}. \end{equation}
Having been utilised in various experimental and theoretical works concerning both single-phase and particle-laden plumes (Hunt & Kaye Reference Hunt and Kaye2001; Mehaddi, Candelier & Vauquelin Reference Mehaddi, Candelier and Vauquelin2013; Balasubramanian et al. Reference Balasubramanian, Mirajkar and Banerjee2018),  $\varGamma _0$ allows the plume to be classified as pure ( $\varGamma _0=1$), lazy ( $\varGamma >1$) or forced ( $\varGamma _0<1$), irrespective of the presence of an ambient density gradient.
In a recent theoretical study by Apsley & Lane-Serff (Reference Apsley and Lane-Serff2019), a method of predicting the steady-state rise height of a pure particle-laden plume ( $\sigma =0,\varGamma =1$) was proposed, along with an associated collapse criterion based upon the ratio of the particle and fluid buoyancy flux components present at the source,
 \begin{equation} P=\frac{-B_{0,p}}{B_{0,f}}\approx\frac{{\phi_0}{(\rho_p-\rho_0)}}{(\rho_0-\rho_f)}. \end{equation}
This theory was developed assuming that the plume maintains a defined veil of particles and each individual particle follows a trajectory associated only with the particle settling velocity and the inward radial velocity produced by plume entrainment. Although a suitable assumption for dilute plumes, particle trajectory is expected to be influenced by convective instabilities in plumes with significant particle loading at the source.
Authors of a number of experimental studies considering the behaviour of unstratified particle-laden plumes (Carey et al. Reference Carey, Sigurðsson and Sparks1988; Veitch & Woods Reference Veitch and Woods2000; Cardoso & Zarrebini Reference Cardoso and Zarrebini2001a) found that flows with high particle concentrations at the source tended to be unstable, and in some cases produced downward currents in the environment. Specifically, Veitch & Woods (Reference Veitch and Woods2000), the authors who introduced (1.7) into the literature, described the narrowing of the particle veil due to the presence of a counter-flowing collar of dense fluid around the plume for source buoyancy flux ratios greater than  $P=0.19$. This value is significantly less than the critical ratio of $P_c=e^{-1} (\approx 0.368)$ which Apsley & Lane-Serff (Reference Apsley and Lane-Serff2019) proposed for the collapse (i.e. $z_m\approx 0$) of a pure particle-laden plume. Additionally, direct sampling of the particle concentration in the environment below a surface intrusion of a highly concentrated particle-laden plume showed that ambient convection was sufficient such that the environment became fully mixed with a particle concentration independent of height (Cardoso & Zarrebini Reference Cardoso and Zarrebini2001a).
Similar observations have been made in stratified plumes. In both Mirajkar et al. (Reference Mirajkar, Tirodkar and Balasubramanian2015) and Balasubramanian et al. (Reference Balasubramanian, Mirajkar and Banerjee2018), although not specifically stated by the authors, convection appears to be present in the environment surrounding the plume resulting in the production of a trough of plume fluid and particles below the intrusion, which under some conditions fully collapses to the base of the tank (see figure 8, Mirajkar et al. Reference Mirajkar, Tirodkar and Balasubramanian2015; and figure 4, Balasubramanian et al. Reference Balasubramanian, Mirajkar and Banerjee2018). Another interesting observation in both pieces of work is the development of a secondary intrusion between the original current and the source, yet in neither of their papers do the authors describe the physics leading to its development. In the concluding remarks of Mingotti & Woods (Reference Mingotti and Woods2020), the authors specifically state that further work is required to understand the influence of convective sedimentation on the dynamics of a stratified particle-laden plume.
In this paper, an attempt to further this understanding has been made by determining the transition point of a stratified particle-laden plume from undergoing dilute behaviour to one influenced by the presence of ambient convection. In § 2, the experiments conducted in this study are described before qualitative descriptions of five steady-state flow regimes are presented in § 3. These regimes are characterised by the source buoyancy flux ratio and the relative magnitudes of the particle settling velocity and the ambient convective velocity, of which a prediction is presented and discussed in § 4. In § 5, the plume heights are compared with models currently within the literature and a simple model for the increase in intrusion height following the sedimentation of particles is presented. Finally, in § 6, conclusive remarks are provided.
2. Experimental methods
Particle-laden plume experiments were conducted in the laboratory through injecting a mixture of fresh water and particles into an acrylic tank with dimensions  $69\ \textrm {cm}\times 69\ \textrm {cm}\times 50\ \textrm {cm}$. The tank was filled with aqueous saline solution to a height of 40 cm and a linear stratification was produced using the double-bucket method (Oster & Yamamoto Reference Oster and Yamamoto1963). The strength of the density gradient created in each experiment is characterised using the ambient buoyancy frequency, $N$.
$N$.
The plume fluid was supplied to an upwards directed nozzle with an internal diameter of  $d_n=6\ \textrm {mm}$. This nozzle was connected to a stirred vessel, placed at a height approximately 1 m above the nozzle, and was used to suspend the particles in fresh water. Acid Red 1 (Azophloxine) dye was added to the plume fluid to assist with plume visualisation, and an LED light sheet was placed outside the tank, directly behind the plume to provide an even distribution of light when viewing experiments.
Experimental conditions are provided in table 1 and were designed so that plume dynamics could be observed for a range of source buoyancy flux ratios ( $P$), whilst also varying source forcing and ambient stratification strength to give plume parameters between the values of $10^{-3}<\varGamma _0<10^{-1}$ and $0<\sigma <10$. Such parameter selection resulted in jet length to plume rise height ratios in the range $2< z_m/L_m<8$.
Table 1. List of experiments.

Particle-laden plumes, in theory, can be produced with  $P$ up to a value of 1 before becoming neutrally buoyant, however, in the case of these experiments, a range of $0< P<0.8$ was achieved. This experimental limitation was a result of attempting to limit $\sigma <10$ with a source buoyancy flux which diminishes with increases in $P$, whilst also attempting to achieve an appropriate spreading height within the tank. In addition to this, the plume feed nozzle began to block for source particle volume fractions exceeding 1.2 %. Note that many of the experiments presented here have source conditions exceeding the critical buoyancy flux ratio for plume collapse $P_c=e^{-1}$, however, this theoretical value refers to plumes rising from virtual point sources of buoyancy whereas the flows studied here are forced with non-zero volume and momentum fluxes.
A source flow rate of  $Q_0 \approx 3 - 7\ \text {cm}^3\ \text {s}^{-1}$ was supplied to the nozzle using a peristaltic pump. The change in height of the stirred feed vessel over a known time was used to determine the exact flow rate and momentum flux ( $M_0=4Q_0^2/{\rm \pi} d_n^2$) for each individual experiment. The flow was observed to be turbulent no more than 2 cm above the plume nozzle with source Reynolds numbers between 700 and 1700. These values are of similar magnitude to previous turbulent plume studies (Carazzo, Kaminski & Tait Reference Carazzo, Kaminski and Tait2006). The source buoyancy flux, $B_0=B_{0,f}+B_{0,p}$, was calculated using source values of volume flux ( $Q_0$), particle volume fraction ( $\phi _0$) and a reference density, $\rho _0$, equivalent to the ambient density at the plume source. In all experiments, the positive buoyancy created by the density deficit between the fluid in the plume and the ambient fluid at the source ( $B_{0,f}$) exceeded the negative buoyancy associated with the dense particles dispersed in the flow ( $B_{0,p}$). Here, it is worth noting that the effective density of the particle-laden plumes in this study, defined as $\rho _{plume}=\phi _0\rho _p+(1-\phi _0)\rho _f$, were of a similar order of magnitude to the density of the environment, with the ratio of $\rho _{plume}/\rho _0$ exceeding $97.5\,\%$ in all cases. As such, the resultant flow is Boussinesq with density effects being negligible except in the case of forces arising due to buoyancy.
Particle settling was assumed to follow Stokes’ law with the terminal particle velocity,  $u_{st}$, defined as
 \begin{equation} u_{st}=\frac{g(\rho_p-\rho_0)d_p^2}{18\mu}, \end{equation}
where  $d_p$ is the particle diameter and $\mu =8.9 \times 10^{-3}\ \text {g} \ \text{cm}^{-1}\ \textrm {s}^{-1}$ is the dynamic viscosity of the ambient fluid. Three different types of monodisperse particles were used to achieve the range of settling speeds detailed in table 1. The upper and lower velocities of $0.92$ and $0.45\ \text{cm}\ \text{s}^{-1}$ are associated with two sets of glass ballotini ( $\rho _p=2.5\ \text{g} \ \text{cm}^{-3}$), each with average particle diameters of $100 \pm 2.5$ and $70 \pm 2 \ \mathrm {\mu }\textrm {m}$. The third particle set, $70 \pm 2 \ \mathrm {\mu }\textrm {m}$ silicon carbide particles ( $\rho _p=3.2\ \text{g} \ \text{cm}^{-3}$), was used to achieve the intermediate velocity of $u_{st}\approx 0.64\ \text {cm s}^{-1}$. In all cases, the source buoyancy flux was sufficiently large such that the characteristic plume velocity, $(B_0N)^{1/4}$, exceeded the particle settling velocity. This ensured all particles dispersed in the plume reached the maximum height, before spreading radially with the intrusion (Ernst et al. Reference Ernst, Sparks, Carey and Bursik1996).
Experiments were captured using a Nikon D300s camera, fitted with an AF-S Micro NIKKOR 60 mm f/2.8G ED lens. For each experiment, the camera was placed on a 1.2 m high tripod approximately 2.5 m from the experimental tank. During the first 10 min of plume injection (the maximum time to achieve steady state), videos with a frame rate of 24 Hz were taken for post-experimental analysis. Such analysis was completed using MATLAB and included the determination of the maximum and spreading heights of each plume, as well as the plume volume flux at the spreading level,  $Q_s$, by measuring the evolution of intrusion volume over time (Sigurðardóttir et al. Reference Sigurðardóttir, Barnard, Bullamore, McCormick, Cartwright and Cardoso2020). After the 10 min filming period, samples of plume fluid were taken near the top of the plume. The particles in these samples were washed and then dried to estimate the particle concentration at the plume spreading height. This method was determined to be accurate within ${\pm }10\,\%$ by sampling a well-mixed tank with a known particle concentration.
All experimental measurements and other useful variables determined from image analysis are provided in the supplementary material available at https://doi.org/10.1017/jfm.2021.673.
3. Qualitative experimental observations
In all experiments, the early behaviour of each plume was very similar. Upon initial release into the tank, each plume rose vertically from the nozzle and was observed to be turbulent and conical in shape. Within seconds, the plume reaches a maximum height before collapsing upon itself and spreading radially as a gravity current at the height of neutral buoyancy. The particles present within the plume initially spread with the current before decoupling from the radial flow and settling into the environment. After this initial stage of plume injection, the flow dynamics evolves due to the re-entrainment of particles. In some cases when viewing the plume, the dynamics remained very similar throughout the experiment with all the particles following a clear trajectory from the base of the intrusion to the edge of the plume. In other experiments, the environment around the plume appeared to be undergoing convection with particles moving erratically within a column of convecting fluid.
As shown visually in figure 1, the steady-state behaviour of a particle-laden plume is observed to be very dependent upon whether the particles settle in the environment individually at their Stokes velocity  $u_{st}$, or whether particle trajectory is dictated by an ambient convective velocity associated with particle-induced instabilities. In an unstratified environment, Cardoso & Zarrebini (Reference Cardoso and Zarrebini2001a) determined a criterion for the onset of convection based upon the ambient convective velocity, $U_c$. They determined this velocity to be a function of the particle concentration gradient present beneath the plume's surface current, represented by $\textrm {d}\phi /\textrm {d}z$, and proposed the scaling,
 \begin{equation} U_c \sim \left(\rho_p\frac{\textrm{d}\phi}{\textrm{d}z}\right)^{1/4}. \end{equation}
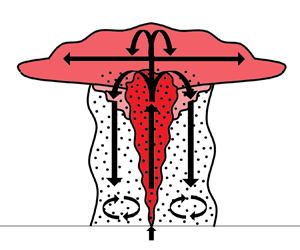
Figure 1. False colour experimental images produced using MATLAB R2020A to aid in the identification of plume regimes. Images were time averaged over 120 s once steady state was achieved. Navy and maroon represent maximum and minimum values of light intensity. (a) Experiment 11, quiescent at steady state. Weak sedimenting veil and plume maximum visible. (b) Experiment 55, undergoing convection at steady state. Both the convection column and the plume trough are clearly visible.
In an attempt to characterise these qualitative observations into defined flow regimes, it is assumed that when the environment around the plume is still and the particles are settling at a terminal velocity,  $u_{st}>U_c$. Conversely, when the environment is undergoing convection and the particle trajectory is controlled by fluid motion, $u_{st}< U_c$. Using this a priori assumption, along with the buoyancy flux ratio $P$ (for consistency with previous work qualitatively evaluating the dynamics of particle-laden plumes, specifically Veitch & Woods Reference Veitch and Woods2000), five flow regimes are characterised. These regimes include Type 1 and 1* plumes, where individual particles settle in the environment at a terminal sedimentation velocity ( $U_c/u_{st}<1$); transitional Type 2 plumes, where both individual particle settling and ambient convection appear to be present ( $U_c/u_{st}\approx 1$); and Type 3 plumes, where particle settling is driven by ambient convection ( $U_c/u_{st}>1$), which in some cases, leads to the development of secondary intrusions (Type 3*, $U_c/u_{st}\gg 1$). Descriptions of the specific dynamics unique to each regime, along with illustrations and photographs of each plume type, are presented in the subsequent paragraphs.
3.1. Type 1 plumes:  $U_c/u_{st}<1$ and $P>0.2$


In a Type 1 plume, the terminal settling velocity of the particles exceeds the ambient convective velocity associated with particle-induced instabilities. As predicted by Apsley & Lane-Serff (Reference Apsley and Lane-Serff2019), the buoyancy flux ratio has a significant impact upon the steady-state height of plumes where  $u_{st}>U_c$. When particle buoyancy at the source is very small compared with the buoyancy of the fluid, the plume silhouette at steady state is representative of a stratified single-phase plume (see figure 2a). A defined plume maximum remains present above the spreading intrusion and the particles flow radially in the gravity current before settling into the ambient fluid below.

Figure 2. Illustrations and photographs (taken at  ${\approx }{300}$ s) of Type 1/1* plumes. Photographs shown are (a) experiment 54 (Type 1); and (b) experiment 12 (Type 1*).
At steady state, the flux of particles in the intrusion beyond the critical re-entrainment radius (Sparks et al. Reference Sparks, Carey and Sigurðsson1991) is equivalent to the particle flux at the source. Any particles settling from the intrusion within this critical radius are re-entrained into the plume, and from both experimental measurements (see figure 3) and previous theoretical predictions (Veitch & Woods Reference Veitch and Woods2000; Zarrebini & Cardoso Reference Zarrebini and Cardoso2000), this results in a particle concentration at the spreading level  $e^1$ times greater than if there was no re-entrainment. Even with this multiplier, the concentration of particles in plumes within this regime is so small that re-entrainment has very little influence on the steady-state plume maximum.

Figure 3. The ratio of the particle flux at the spreading level to the plume source against the buoyancy flux ratio,  $P$. The $y$ axis presents the coefficient associated with the re-entrainment of particles into the plume at steady state which, when no ambient convection is present, is expected to be equivalent to $e^1$ (presented as the dotted line). The particle concentration at the spreading height of Type 1/1* (small circle blue) plumes aligns with the predicted value, however, all plumes (Type 2, small square red; Type 3, small triangle magenta and Type 3*, small circle black) where convection is present appear to re-entrain less particles.
3.2. Type 1* plumes: $U_c/u_{st}<1$ and $P>0.2$ when $\sigma \ll 1$


As shown in figure 2b, Type 1* is very similar to its predecessor, however, particle recycling results in a significant decrease in maximum height until a steady state is achieved either within or below the original intrusion. The ‘single-phase’ silhouette described for Type 1 begins to disappear for source buoyancy flux ratios of  $P>0.2$ for plumes with negligible momentum at the source (i.e. $\sigma \ll 1$). Although suitable for pure plumes, the transitional value of $P > 0.2$ is very dependent upon the level of forcing at the source as non-zero volume and momentum fluxes will increase this value due to the additional entrainment of ambient fluid both at the plume margins and in the descending fountain at the plume maximum (see figure 10 in Apsley & Lane-Serff Reference Apsley and Lane-Serff2019). To fully characterise this regime for plumes rising from non-idealised sources, a forced plume equivalent of the model derived by Apsley & Lane-Serff (Reference Apsley and Lane-Serff2019) would need to be developed and this is outside of the scope of this current study.
Although the plume height decreases, the general behaviour of the plume remains consistent. The intrusion spreads below the plume maximum and a sedimenting veil can be observed around the plume. Notably, the measurements presented in figure 3 for both regimes with plumes rising through quiescent environments (Type 1/1*) suggest that the intrusions are well mixed with a particle concentration which decays exponentially with radius (Sparks et al. Reference Sparks, Carey and Sigurðsson1991).
Over time, the trajectory of the particles in the environment remains relatively unchanged, however, the position of fluid in the intrusion does not. Due to the changing plume height, a defined intrusion, like one would observe in a single-phase plume, is not present as the spreading height decreases until reaching a new steady state. Also, in some instances after the particles have settled into the environment below, the fluid in the intrusion rises to a new height of neutral buoyancy, as observed by Mingotti & Woods (Reference Mingotti and Woods2020). This phenomenon was particularly evident in weakly stratified experiments with a large flux of particles at the source i.e. large  $Q_0\phi _0$ and small $N$.
$N$.
3.3. Type 2 plumes: $U_c/u_{st}\approx 1$, independent of $P$


Within this regime, the convective velocity in the environment below the plume intrusion is assumed to be approximately equivalent to the settling velocity of each individual particle. The particles remain dispersed in the plume intrusion before settling into the environment below. A sedimenting veil is present and the majority of the particles appear to settle according to their terminal velocity. However, in some portions of the veil, minor convection can be seen as well as the presence of a small parabolic cloud of dyed fluid directly below the intrusion (see figure 4). Previous authors referred to this phenomenon as the plume trough (Mirajkar et al. Reference Mirajkar, Tirodkar and Balasubramanian2015; Balasubramanian et al. Reference Balasubramanian, Mirajkar and Banerjee2018). The plume trough appears close to the plume edge and is created by the large, localised flux of sedimenting particles dragging the lighter interstitial plume fluid from the intrusion into the ambient fluid below.

Figure 4. Illustrations and photographs (taken at  ${\approx }{300}$ s) of a Type 2 plume. Photograph shown is experiment 10.
An assessment of figure 3 shows a reduction in particle re-entrainment compared with Type 1/1* plumes for not only Type 2 flows, but all those rising in the presence of ambient convection. This suggests either a change in the intrusion's distribution of particles or more likely, a change in the particle trajectory from the intrusion to the plume margin. Unlike in particle-laden plumes rising through unstratified environments (see Veitch & Woods Reference Veitch and Woods2000), the lack of trend in figure 3 shows that the buoyancy flux ratio at the source has little to no influence on the development of the plume trough or any other convective instabilities occurring within the sedimenting veil.
3.4. Type 3 plumes: $U_c/u_{st}>1$, independent of $P$


Once ambient convection overcomes the settling of individual particles, an obvious transition in the dynamics occurs. After a period of re-entrainment similar to the previous regimes, the particle concentration at the top of the plume reaches some threshold which subsequently causes the particles dispersed in the gravity current to decouple from the intrusion fluid close to the edge of the plume. This decoupling is followed by packets of highly concentrated particle-laden ambient fluid settling towards the base of the tank at speeds significantly greater than the individual particle's Stokes velocity.
This localised settling creates a column of convecting ambient fluid around the plume between the intrusion and the tank floor (shown in figure 5a), similar to the annulus of fluid and particles observed for plumes with source loading exceeding  $P \approx 0.20$ in a uniform environment (Veitch & Woods Reference Veitch and Woods2000). Although a specific value for transition was noted in the unstratified case, as previously noted for Type 2 plumes, no specific threshold of buoyancy flux ratio was observed to achieve $u_{st}< U_c$ across the three different settling speeds presented in this study. Upon reaching the tank base, the particles in the convection column deposit onto the floor and the once particle-laden fluid slightly rises back up in the stratified environment. In the convection zone, the plume trough remains present below the intrusion and very small portions of dyed fluid are dragged down into the convection column.

Figure 5. Illustrations and photographs (taken at  ${\approx }{300}$ s) of Type 3/3* plumes. Photographs shown are (a) experiment 29 (Type 3); and (b) experiment 21 (Type 3*).
The steady-state plume heights are less than what would be observed in a single-phase plume, yet due to the change in particle trajectory associated with the transition from sedimenting veil to convection column, the model assumptions of Apsley & Lane-Serff (Reference Apsley and Lane-Serff2019) no longer hold. The decoupling of the solid and fluid phases also more obviously shows the light interstitial fluid in the intrusion rising and spreading at a new neutral buoyancy height above the original current.
3.5. Type 3* plumes: $U_c/u_{st}\gg 1$, independent of $P$


When the particle concentration at the spreading level is very large, convection at the edge of the plume becomes so great that dyed plume fluid is dragged down from the maximum plume height to the base of the tank, mixing with the ambient fluid below to create a flow reminiscent of a stratified single-phase fountain (Bloomfield & Kerr Reference Bloomfield and Kerr1998). Although no association with a fountain was made, Balasubramanian et al. (Reference Balasubramanian, Mirajkar and Banerjee2018) also observed that particles in the intrusion of plumes with high source concentrations drag down plume fluid from the intrusion to the plume source. These authors compare the radius of the trough with an altered version of the critical re-entrainment radius; however, such a comparison is not suitable as the particle trajectory is governed by the fluid motion instead of the individual particle settling speed.
As the downflow reaches the base of the tank, a particle-laden gravity current can be seen spreading radially away from the nozzle. As in previous particle-laden current experiments (Woods & Bursik Reference Woods and Bursik1994), the gravity current becomes buoyant following the deposition of the particles onto the tank floor and can then be seen to rise into the stratified environment. This dyed fluid reaches a neutrally buoyant height and then spreads between the main current and the base of the tank as a secondary intrusion (see figure 5b), as observed previously in other stratified particle-laden plume experiments (Mirajkar et al. Reference Mirajkar, Tirodkar and Balasubramanian2015; Balasubramanian et al. Reference Balasubramanian, Mirajkar and Banerjee2018). In addition to observing fountain-like flow behaviour, buoyant fluid can be seen to rise from the main intrusion to spread as a new intrusion above the original current (as has been observed in other regimes).
At this qualitative stage of the study, the transition from Type 3 to Type 3* behaviour is somewhat ambiguous other than expecting larger convective velocities to be present in the environment around Type 3* plumes. In an attempt to address this, quantitative detail on this flow transition is presented and discussed in § 4.1.
4. Criterion for the onset of ambient convection
Experimental observations show that, within the environment near the edge of a Type 3 (and 3*) plume, parcels of particle-laden fluid can be seen settling around the plume at speeds much greater than the settling velocity of each individual particle. This convection is confined to a defined radius around the plume, suggesting that the unstable stratification produced by the presence of particles in the environment below the gravity current is directly associated with the intrusion particle concentration; a concentration which decays exponentially away from the edge of the plume (Sparks et al. Reference Sparks, Carey and Sigurðsson1991).
Given that the convection observed is a result of a Rayleigh–Taylor instability, created by a denser fluid–particle suspension lying above lighter particle-free fluid, it is likely that the velocity of the convective front will change in time, firstly accelerating downwards before decelerating due to the ambient stratification (Lawrie & Dalziel Reference Lawrie and Dalziel2011). Rather than capturing these time and position dependent complexities, it is of more interest to simply determine the plume conditions required for the onset of ambient convection such that the steady-state flow regime may be predicted.
In their study on particle-laden plumes in a uniform environment, Cardoso & Zarrebini (Reference Cardoso and Zarrebini2001a) utilised a scaling approach to estimate the magnitude of the ambient convective velocity, the scaling of which is presented in (3.1). The full equation they derived is written as
 \begin{equation} U_c \approx \left(\frac{Gr_cg\nu^2}{\rho_0}\right)^{1/4} \left(\rho_p \frac{\textrm{d}\phi}{\textrm{d}z}\right)^{1/4}, \end{equation}
where  $\nu$ is the kinematic viscosity of the fluid–particle suspension; and $Gr_c$ is the critical Grashof number, a dimensionless parameter analogous to the Reynolds number for natural convection; defined as
 \begin{equation} Gr_c = \frac{g'_sL_c^3}{\nu^2}=\frac{g\rho_pL_c^4}{\rho_0\nu^2} \frac{\textrm{d} \phi}{\textrm{d}z},\end{equation}
where  $g'_s=g\Delta \rho _s/\rho _0$ is the reduced gravity of the fluid–particle suspension with $\Delta \rho _s$ representing the density difference between the suspension and the ambient; and $L_c$ is the convection length scale.
Cardoso & Zarrebini (Reference Cardoso and Zarrebini2001a) determined  $\textrm {d}\phi /\textrm {d}z$ numerically through solving a set of differential equations, however, a simple extension to their analysis allows the gradient to be determined analytically. Here, it is proposed that the density gradient resulting in ambient convection is solely due to the presence of particles in the gravity current, and that the gradient can be determined through the combination of the radial change of intrusion particle concentration, $\textrm {d}\phi /\textrm {d}r$, and the expected trajectory of particles in the environment prior to the onset of convection, $\textrm {d}r/\textrm {d}z$, both of which are well defined within the literature. Sparks et al. (Reference Sparks, Carey and Sigurðsson1991) determined the change in gravity current particle concentration with radial position as
 \begin{equation} \frac{\textrm{d}\phi}{\textrm{d}r}=\left(\frac{{2{\phi_s}{\rm \pi}{u_{st}} r}}{Q_s}\right)\exp{\left[\frac{-{\rm \pi}{u_{st}}(r^2-{b_s}^2)}{Q_s}\right]}, \end{equation}
where  $r$ is the radial position along the intrusion and $\phi _s$, $b_s$ and $Q_s$ are the particle volume fraction, plume radius and volume flux at the spreading height. Equation (4.3) assumes that the intrusion is well mixed and based upon experimental measurements of particle re-entrainment in quiescent plumes (see figure 3) and also the successful comparison of these experiments with the theory of Apsley & Lane-Serff (Reference Apsley and Lane-Serff2019) (see figure 9), the utilisation of this model here is reasonable.
Particle trajectory in the environment around the plume can be written as (Zarrebini & Cardoso Reference Zarrebini and Cardoso2000; Apsley & Lane-Serff Reference Apsley and Lane-Serff2019)
 \begin{equation} \frac{\textrm{d}r}{\textrm{d}z}=\frac{-{u_e}}{u_{st}}=\frac{b\alpha\omega}{u_{st}r}, \end{equation}
where  $u_e$ is the entrainment velocity and $\omega$ is the plume velocity. Using (4.3), (4.4) and the fact that $Q_s={\rm \pi} {b_s}^2\omega$, the analytical expression for the particle concentration gradient present below the plume intrusion may be written as
 \begin{equation} \frac{\textrm{d}\phi}{\textrm{d}z}=\frac{\textrm{d}\phi}{\textrm{d}r}\frac{\textrm{d}r}{\textrm{d}z} = \left(\frac{{2\alpha {\phi_s}}}{b_s}\right)\exp{\left[\frac{-{\rm \pi}{u_{st}}(r^2-{b_s}^2)}{Q_s}\right]}. \end{equation}
 As interest lies in determining the transition of plume regime between individual particle settling ( $u_{st}>U_c$) and convective settling ( $u_{st}< U_c$) in the environment at the edge of the plume, the intrusion radius is set as $r=b_s$ before substituting (4.5) into (4.1) to give
 \begin{equation} U_c \approx \left(\frac{Gr_cg\nu^2}{\rho_0}\right)^{1/4} \left(\frac{{2\alpha\rho_p \phi_s}}{b_s}\right)^{1/4}. \end{equation}
 In this form, (4.6) is suitable to determine the convective velocity in the environment at the edge of the plume and, for a known particle settling velocity, can be used as the criterion for determining the transition of settling behaviour in particle-laden plumes. Although a distinct similarity can be seen between (4.6) and (4.1), it is worthwhile utilising the definition of  $Gr_c$ to recast (4.6) such that any inferred dependence on $\nu$ may be eliminated. Upon substituting (4.2) into (4.6), after some rearrangement, a dimensionless form of $U_c$ may be presented as
 \begin{equation} \frac{U_c}{\left(\dfrac{gL_c^4N_s^2}{b_s}\right)^{1/4}} \approx \left(\frac{{2\alpha\rho_p \phi_s}}{\rho_0}\right)^{1/4}, \end{equation}
where  $N_s=(g\rho _p\,\textrm {d}\phi /\rho _0\,\textrm {d}z)^{1/2}$ is the buoyancy frequency associated with the particle concentration gradient below the intrusion.
4.1. Regime diagram
Experimental measurements of  $\alpha$ (determined using the bulk parameter method; see § 5 and Appendix A.1) and $b_s$ were input into (4.6), the criterion for the onset of convection at the edge of the plume, and a Type 1/1* spreading level particle concentration of $\phi _s = Q_0 \phi _0e^1/Q_s$ was assumed for consistency across all experiments. In figure 6, $u_{st}$ is plotted against $U_c$ and shows that the regimes can be suitably separated when using a critical Grashof number of $Gr_c = 2.2 \times 10^4 \pm 1 \times 10^4$, for $\rho _0 = 1\ \text{g} \ \text{cm}^{-3}$ and $\nu = 8.9 \times 10^{-3} \ \text {cm}^2\ \text {s}^{-1}$. For the experiments plotted, this empirically determined value of $Gr_c$ results in $U_c/u_{st}<0.90$ for quiescent plumes; $U_c/u_{st}>1.05$ for plumes undergoing ambient convection; and a range of $0.93< U_c/u_{st}<1.11$ for transitional Type 2 plumes.

Figure 6. Plume regime diagram plotting the individual particle settling velocity,  $u_{st}$, against the ambient convective velocity, $U_c$. The dashed line corresponds to a critical Grashof number of $Gr_c=2.2 \times 10^4$. Type 1/1* (small circle blue) plumes appear on the left of the plot, Type 3 (small triangle magenta) and 3* (small circle black) on the right and Type 2 (small square red) approximately on the dashed line.
From an assessment of (4.6), it can be seen that high dilution of the particles at the spreading level (i.e. large  $Q_s$), along with a large plume rise height (as $z_s \sim b_s/\alpha$; Morton et al. Reference Morton, Taylor and Turner1956), will both strongly mitigate the development of ambient convection. Therefore, the parameters which appear to be of most importance in defining the settling regime are the particle flux at the source; the magnitude of the flow's driving force (that being $B_0$ for pure plumes or a combination of $B_0$, $Q_0$ and $M_0$ for forced plumes); and the strength of the ambient stratification $N$, given that both the plume spreading height and the volume flux associated with it are functions of these source and stratification parameters. Particle density $\rho _p$, is less significant in defining the settling regime as any increases in convective velocity owing to increases in particle density will be immediately mitigated by increases in individual particle settling speed.
An interesting observation is that the regimes can be determined from the particle-induced density gradient alone, and that the fluid density gradient appears to have no influence on the convective velocity achieved, even in cases where  $\textrm {d}\rho _e/\textrm {d}z$ is large enough to result in a negative (stable) density gradient when added to the value calculated using (4.5). This suggests that either the local density gradient present in the ambient fluid is not important; or due to the presence of the plume trough, over the course of the experiment, the fluid directly below the intrusion may become well mixed, allowing the suspension of particles to create an unstable stratification. Alternatively, the localised and continuous sedimentation of particles could also impact the fluid stratification as previously shown by Blanchette (Reference Blanchette2013). Using simulations, they showed that a single pass of particles settling at their Stokes velocity through a stratified environment can result in the short-term disturbance of the ambient density gradient (with regeneration occurring over a multiple of $N^{-1}$ seconds), or in some extreme cases, can lead to the complete destruction of the fluid stratification. This work considered only isolated settling events, whereas particle settling in this study's experiments occurs continuously between the intrusion and the tank floor. Therefore, it is not unreasonable to expect that a similar disruption to the fluid density gradient could occur in the environment immediately below the intrusion over the length scale of interest.
In figure 6, the transition from Type 3 to 3* plumes is observed to occur when  $U_c\geqslant 1\ \text {cm}\ \textrm {s}^{-1}$, irrespective of particle settling speed. This suggests that the transition is a direct result of sufficiently strong convection pulling intrusion fluid to the plume source and one would expect that this would occur for a consistent ambient velocity, especially in the case of these experiments where the intrusion heights above the source are reasonably small. However, it is not expected that this transition will necessarily be the same in plumes with much greater intrusion heights, such as those present in nature.
The critical Grashof number determined here is an order of magnitude larger than previously suggested for convection in unstratified particle-laden plumes, however, it is important to note that the value of  $Gr_c=10^3$ used by Cardoso & Zarrebini (Reference Cardoso and Zarrebini2001a) was adopted from Hoyal, Bursik & Atkinson (Reference Hoyal, Bursik and Atkinson1999), who investigated the development of particle-rich fingers across a density interface in a step stratified fluid. Hoyal et al. (Reference Hoyal, Bursik and Atkinson1999) considered the convection length scale to be equivalent to the finger thickness, yet the critical Grashof number determined here is expected to be associated with a length scale in the $z$-direction. Thus, the critical value used by both Hoyal et al. (Reference Hoyal, Bursik and Atkinson1999) and Cardoso & Zarrebini (Reference Cardoso and Zarrebini2001a) is not directly comparable to the result determined here.
Carazzo & Jellinek (Reference Carazzo and Jellinek2012) studied negatively buoyant particle-laden jets in a two-layer stratification which produced umbrella cloud Grashof numbers in the range  $10^2 \sim 10^7$ using a length scale of $L_c=z_m-z_s$. A value of $Gr_c \approx 2.2 \times 10^4$, along with the particle-induced ambient density gradients determined for each experiment, suggests convection length scales in this study between 2 and 4 cm. These values are certainly of the order of magnitude of the differences observed between the experimental plume maximum and spreading heights.
In their work, Carazzo & Jellinek (Reference Carazzo and Jellinek2012) noted that some of their experiments developed ambient convection below the intrusion yet did not state the critical umbrella cloud Grashof number for convection to occur. The authors instead conducted a similar approach to Hoyal et al. (Reference Hoyal, Bursik and Atkinson1999) using  $Gr_c=10^3$ and a smaller length scale associated with the intrusion's particle-bearing boundary layer. Rather than considering the influence of natural convection, Carazzo & Jellinek (Reference Carazzo and Jellinek2012) suggested the transition of flow regime from buoyant plume to collapsing fountain is a function of the source Richardson number (i.e. $\varGamma _0$). This approach was extended to linearly stratified plumes by Balasubramanian et al. (Reference Balasubramanian, Mirajkar and Banerjee2018), yet from the results in this study, neither the scaled source Richardson number, nor $\sigma$, are capable of independently defining the regime transition in initially buoyant, linearly stratified particle-laden plumes. The influence of these two parameters is discussed further in the next section.
4.2. Influence of a real plume source
For a plume where  $Q_0$ and $M_0$ are sufficiently small, the flow can be considered to be driven only by buoyancy and will act as a pure plume. In this instance, the onset of convection can be predicted using the solution of Morton et al. (Reference Morton, Taylor and Turner1956) for the maximum flow rate in a plume, $Q_s\approx 3.5\alpha ^{1/2}B_0^{3/4}N^{-5/4}$, and the radius at the spreading level can be estimated using the equivalent radius of a plume rising in a uniform environment, $b_s=6\alpha z_{B=0}$/5, where $z_{B=0}$ corresponds to the stratified plume's height of neutral buoyancy. Such an approximation is reasonable considering that the differences in plume radius between an unstratified and stratified plume up to the height of neutral buoyancy are small and that the differences present are almost eliminated due to the fact that $U_c\sim b_s^{-1/4}$.
In the case of forced plumes, such as those in this study, the approach described above cannot be taken as both volume flux and radius are dependent upon  $\varGamma _0$ and $\sigma$. Mehaddi et al. (Reference Mehaddi, Candelier and Vauquelin2013), who theoretically studied the evolution of stratified single-phase plumes with respect to these parameters, determined that
 \begin{equation} \frac{Q_s}{Q_0} = \frac{(\sigma + 1)^{3/8}}{\varGamma_0^{1/2}\sigma^{5/8}}\left[\frac{5}{2}\beta\left[\frac{1}{2},\frac{5}{4}\right]-I(\sigma)+\frac{\varGamma_0\sigma^{5/4}}{(\sigma+1)^{3/4}}\right]^{1/2}, \end{equation}
and
 \begin{equation} \frac{b_s}{b_0} = \frac{(\sigma + 1)^{1/8}}{\varGamma_0^{1/2}\sigma^{3/8}}\left[\frac{5}{4}\beta\left[\frac{1}{2},\frac{5}{4}\right]-I(\sigma)+\frac{\varGamma_0\sigma^{5/4}}{(\sigma+1)^{3/4}}\right]^{1/2}, \end{equation}
where  $I(\sigma )=(5/4)\int _{0}^{\sigma }[t^{1/4}/(t+1)^{7/4}] dt$ is an incomplete beta function and the beta function $\beta [1/2,5/4]=1.748$.
An analysis of (4.8) and (4.9) using the source conditions of this study's experiments suggests that  $Q_sb_s/Q_0b_0 \approx 2.5(1+\sigma )^{1/2}/\sigma \varGamma _0$. By substituting this expression into (4.7), along with the definitions of $\varGamma _0$, $\sigma$ and $b_0=Q_0/({\rm \pi} M_0)^{1/2}$, the theoretical convective velocity may be written as
 \begin{equation} \frac{U_c}{(g'_sL_c^3N^2)^{1/4}} \approx \left(\frac{e^1}{2}\right)^{1/4} \left[\frac{\rho_p\phi_0}{(\rho_0-\rho_{plume})(\sigma+1)^{1/2}}\right]^{1/4}, \end{equation}
where  $g'_sL_c^3N^2$ is a velocity scale, which, despite appearing to contain unknown values, is simply a rewritten form of the critical Grashof number and is equivalent to $Gr_c\nu ^2N^2$.
Out of interest, (4.10) may also be written in terms of  $P$ as
 \begin{equation} \dfrac{U_c}{(g'_sL_c^3N^2)^{1/4}} \approx \left(\frac{e^1}{2}\right)^{1/4} \left[\frac{P}{1-P} \frac{1+\rho_0/(\rho_p-\rho_0)}{(\sigma+1)^{1/2}}\right]^{1/4}. \end{equation}
Here, it is clear that  $P$, an alternative definition of particle loading at the source, does have some influence over the magnitude of $U_c$. However, as per (4.6), source parameters and ambient stratification strength are also important and therefore, unlike unstratified particle-laden plumes (see Veitch & Woods Reference Veitch and Woods2000) and as observed in § 3, the value of $P$ alone cannot dictate the steady-state plume dynamics.
Now, having derived (4.10), the convective velocity in the environment at the edge of the plume can now be estimated using a number of source parameters and the strength of the ambient density gradient. To determine this method's suitability, it must be compared with the approach using experimental measurements taken at the plume spreading height. By equating (4.10) with (4.7), and accounting for that fact that the two velocity scales in each equation are simply rearrangements of  $Gr_c$, dimensionless scaling may be presented as
 \begin{equation} \frac{(g'_sL_c^3N^2)}{\left(\dfrac{gL_c^4N_s^2}{b_s}\right)}=\frac{N^2b_s}{g} \approx 4 \left[\frac{\alpha B_0(\sigma+1)^{1/2}}{Q_sg}\right]. \end{equation}
A plot of (4.12) (see figure 7) shows that the two prediction methods do in fact scale together, however, instead of being equivalent, the method utilising source parameters tends to result in convective velocity predictions 5 %–10 % larger than those predicted using experimental measurements. The difference observed is expected to be due to an underprediction of both the plume volume flux and plume radius at the spreading level. In terms of volume flux, the theoretical prediction is associated with entrainment into the plume up to its maximum height and does not account for any additional entrainment into the descending fountain at the top of the plume – a phenomenon which has been observed previously in similar experimental studies (Cardoso & Woods Reference Cardoso and Woods1993; Hunt & Burridge Reference Hunt and Burridge2015). Similarly, the value of plume radius calculated by Mehaddi et al. (Reference Mehaddi, Candelier and Vauquelin2013) is at the height of neutral buoyancy (which moves closer to the source for increasing  $\sigma$ and decreasing $\varGamma _0$), whereas the experimental measurements are of the plume radius at the spreading level, which occurs at some height between $z_{B=0}$ and $z_{m}$. Even with these limitations, figure 7 shows that an additional coefficient of $4^{1/4}/1.5\approx 0.95$ on the right-hand side of (4.10) can predict the convective velocity below the gravity current, and hence the expected settling regime for a given particle settling velocity, within approximately $10\,\%$ of that determined from experimental measurements.

Figure 7. Comparison of the dimensionless velocity predictions using the scaling presented in (4.12), raised to the  $1/4^{\text{th}}$ power. The solid line represents a gradient of 1.50 with the dashed lines showing a gradient range of 1.35–1.67.
To further confirm this approach, comparisons can also be made with other studies where convective behaviour has been observed in particle-laden plumes. Due to only changing the source particle concentration, the experiments of Mirajkar et al. (Reference Mirajkar, Tirodkar and Balasubramanian2015) allow for the most straightforward application of (4.10). Their source conditions were  $Q_0\approx 33\ \text {cm}^3\ \text {s}^{-1}$, $M_0\approx 860\ \text {cm}^4\ \text {s}^{-2}$ and $B_0\approx 333 - 661\ \text {cm}^4\ \text {s}^{-3}$ for source particle concentrations of $\phi _0=0.7\,\%$ and $\phi _0=0\,\%$ respectively. The stratification strength of $N=0.67\ \text {s}^{-1}$ remained constant across all their experiments and resulted in forced plumes with $\sigma \approx 0.76 - 2.99$. The ballotini ( $\rho _p\approx 2.5\ \text{g} \ \text{cm}^{-3}$) used in all their plumes had a settling velocity of $u_{st}\approx 0.8\ \text{cm} \ \text{s}^{-1}$ and from (4.10), the settling regime change is expected to occur for $\phi _0\approx 0.35\,\%$. This value aligns with their observations as upon assessment of their figures (see their figure 8), clear Type 2 behaviour can be seen in their 0.35 % experiment, followed by Type 3/3* behaviour when $\phi _0>0.35\,\%$. It is also worth noting that their Type 3* plume has a predicted convective velocity of $U_c\approx 0.96\ \text{cm} \ \text{s}^{-1} \pm 0.1\ \text{cm} \ \text{s}^{-1}$, a value similar to this study's observation for Type 3* plumes developing once $U_c\geqslant 1\ \text{cm} \ \text{s}^{-1}$.
5. Steady-state plume heights
As observed by previous authors experimentally studying stratified particle-laden plumes, a significant reduction in plume height is seen due to the re-entrainment of particles. The theoretical model of Apsley & Lane-Serff (Reference Apsley and Lane-Serff2019) assumes a re-entrainment model where particle trajectory between the intrusion and the plume margins is associated only with the particle settling velocity and the radial velocity in the environment due to plume entrainment. With steady-state height measurements extracted from experimental analysis, an opportunity exists to verify the model's suitability to predict both the maximum rise and spreading heights of Type 1/1* plumes (where  $u_{st}>U_c$).
The key equations of their model include the steady-state height of the plume as a function of  $P$,
$P$,
 \begin{equation} z_{\infty}=z_0 \left(\frac{|j|}{1+|j|} \right)^{1/4}, \end{equation}
where  $z_{\infty }$ and $z_0$ are the steady-state and initial plume heights, with $j$ defined as
 \begin{equation} j=\frac{1-P_c/P}{1-P_c}. \end{equation}
Here,  $P_c$ is the critical buoyancy ratio for plume collapse, which Apsley & Lane-Serff (Reference Apsley and Lane-Serff2019) determined to be equivalent to $P_c=e^{-1}$ for pure plumes. Their second equation of interest is the change in plume height with time, $t$, as
 \begin{equation} z=z_0-\left(1-(1-P_c)^{1/4}\right)u_{st}t. \end{equation}
 In the case of both (5.1) and (5.3), the values of  $z$,
$z$,  $z_{\infty }$ and $z_0$ refer to the spreading height of the plume, which Apsley & Lane-Serff (Reference Apsley and Lane-Serff2019) assumed to be the height of neutral buoyancy for plumes with no additional entrainment in the descending fountain at the top of the plume. Under this particular condition, one would expect that the model can be expanded simply to also predict the maximum height of the plume by utilising the Morton et al. (Reference Morton, Taylor and Turner1956) constant for the dimensionless height where momentum in the plume goes to zero. Apsley & Lane-Serff (Reference Apsley and Lane-Serff2019) non-dimensionalised their height predictions using the scale $l_p=\alpha ^{-1/2}B_0^{1/4}N^{-3/4}$, such that the steady-state heights of a plume where $P=0$ (single phase) are $z_s/l_p=1.04$ and $z_{m}/l_p=1.37$.
To allow a direct comparison of the experimental results with their theory, appropriate values for  $\alpha$ must be estimated. Kaye (Reference Kaye2008) states that the two basic approaches for determining $\alpha$ in stratified plumes experimentally is through either measuring the radial growth rate of the plume near the source and using $\alpha =5b/6z$ or through measuring a bulk property such as $z_{m}$ and then subsequently inferring $\alpha$ from (1.3). In this study, the latter approach has been utilised (see Appendix A.1). Obviously, due to the presence of particles in the plume, additional complexities are present when considering the value of $z_{m}$ compared with a single-phase plume as the maximum height of a particle-laden plume decays over time due to particle re-entrainment. To avoid this problem, $\alpha$ was estimated using the value of $z_{m}$ prior to any particle recycling, such that the plume rise height would be equivalent to that of a single-phase plume with the same source buoyancy flux.
Also, due to using a real source, an adjustment to account for the source momentum and volume fluxes must be applied such that  $z_{m}=z_{max}-z_v$, where $z_{max}$ is the plume height above the nozzle and $z_v$ is the virtual source. Virtual sources were estimated for each experiment and were found to vary between $-0.6$ and $-3.2\ \textrm {cm}$ using the method for forced plumes described initially by Morton (Reference Morton1959) and later by Hunt & Kaye (Reference Hunt and Kaye2001) (see Appendix A.2). Using the approach described above, the experimental plumes had top hat entrainment coefficients varying between that of a pure plume ( $\alpha _p=0.118$) when $\sigma =0$ and a pure jet ( $\alpha _j=0.076$) for $\sigma \geqslant 1$ (Carazzo et al. Reference Carazzo, Kaminski and Tait2006). Unlike in unstratified plumes, the entrainment coefficient appeared independent of $\varGamma _0$, aligning with observations from previous experimental work on plumes in a stratified environment (Konstantinidou & Papanicolaou Reference Konstantinidou and Papanicolaou2003).
Having determined appropriate values for  $\alpha$, the heights associated with each plume were non-dimensionalised and are presented in figure 8 against the source buoyancy flux ratio, $P$. Figure 8(b) details the steady-state spreading height of the plume intrusion, consisting of both fluid and particles, and also the final height of the buoyant interstitial fluid which rises from the main current following the sedimentation of the once dispersed particles into the environment below. Further discussion on the change in intrusion fluid height is presented in § 5.1.

Figure 8. Various plume heights as a function of  $P$ where (a) shows the dimensionless steady-state maximum heights categorised by each plume type: 1/1* (small circle blue), 2 (small square red), 3 (small triangle magenta) and 3* (small circle black); and (b) the dimensionless steady-state heights of the particle-laden intrusion (small circle red) and the height of neutral buoyancy of the intrusion fluid following the sedimentation of particles (small square blue). In both panels, the solid lines represent the Apsley & Lane-Serff (Reference Apsley and Lane-Serff2019) collapse model with the parameters $P_c=e^{-1}$ and $\epsilon =0$.
The steady-state maximum height of the plume above the virtual source, along with the flow regime observed, is detailed in figure 8(a). Interestingly, all plumes where  $P<0.2$ follow the Apsley & Lane-Serff (Reference Apsley and Lane-Serff2019) prediction, irrespective of flow regime. However, for $P>0.2$, the point at which significant height decay occurs, only a number of Type 1* measurements continue to follow the theory, with the majority of other plumes remaining significantly above the predictions. For plumes where $u_{st}< U_c$, diversion from the theory is expected due to the significant difference in ambient particle motion, whereas the steady-state heights achieved by plumes where $u_{st}>U_c$, it is expected that the differences observed is due to real source effects, particularly differences in entrainment behaviour both at the plume margins and in the descending fountain at the plume maximum.
To confirm this, an additional plot of dimensionless height against  $P$ has been produced and only Type 1/1* plumes with a jet length, $L_m$, less than 30 % of the steady-state maximum have been included. From figure 9(a), it can be said that by excluding plumes with large momentum fluxes at the source, the height prediction of Apsley & Lane-Serff (Reference Apsley and Lane-Serff2019) is within the uncertainty of the experimental measurements. This model verification is further supported by analysing the change in plume height with time. A number of maximum height measurements were taken at various times for three Type 1/1* experiments with small values of $L_m$. In figure 9(b), the change in plume height over the particle settling velocity, $\Delta z_{max}/u_{st}$, is plotted against time $t$ and the gradient predicted by (5.3), $(1-(1-P_c)^{1/4})\approx 0.108$, is found to provide reasonable height estimates prior to the experimental measurements tailing off due to reaching a steady state.

Figure 9. (a) Comparison of the rise (small square blue) and spreading (small circle red) height of Type 1/1* plumes with the collapse model of Apsley & Lane-Serff (Reference Apsley and Lane-Serff2019). The plumes included have small jet length scales ensuring  $z_{max}/L_m>3$. The average entrainment coefficient of the plumes is $\alpha = 0.1 \pm 0.01$. (b) Change in plume height as a function of time. The points plotted are from experiments 6 (small circle red), 12 (small square blue) and 54 (small triangle magenta). The black line has a gradient of $0.108$, associated with a buoyancy flux ratio of $P_c=e^{-1}$.
Given the accuracy achieved by the model for plumes with small values of  $L_m$, it is expected that this pure plume model could also predict the expected steady-state height of forced particle-laden plumes if appropriate alterations were made. Apsley & Lane-Serff (Reference Apsley and Lane-Serff2019) proposed an additional term, $\epsilon =Q_s/Q_t-1$ (with $Q_t$ as the plume volume flux at the theoretical neutral buoyancy height), to account for any additional entrainment into the plume's descending fountain and found that $\epsilon >0$ produced larger values of $P_c$ and as a result, greater steady-state plume heights. Although this term accounts for one source of the additional volume present in a forced plume, it is expected that the addition of other parameters accounting for the volume entering at the source and the differences in entrainment at the plume margins would need to be utilised to accurately predict the plume height.
5.1. Change in intrusion height
In both this study and the work of Mingotti & Woods (Reference Mingotti and Woods2020), the interstitial fluid in the plume intrusion appears to separate from the main current following the sedimentation of particles. This fluid spreads at a new height of neutral buoyancy, above the original current, and creates an anvil shaped intrusion reminiscent of particle-laden plumes in nature (Sparks, Moore & Rice Reference Sparks, Moore and Rice1986; Woods & Kienle Reference Woods and Kienle1994). Notably in their theoretical work, Apsley & Lane-Serff (Reference Apsley and Lane-Serff2019) commented on the potential for the intrusion fluid to increase in height following particle sedimentation, however, specifically stated that they did not expect such a rise to occur.
Following their experimental observations, Mingotti & Woods (Reference Mingotti and Woods2020) produced a very simple model to estimate the change in fluid height with respect to the particle and fluid density deficits present at the plume source. Such an approach neglects the influence of particle re-entrainment on the particle concentration at the spreading level, however, reasonable agreement was achieved with their measurements taken at early stages of plume evolution. At steady state, however, an approach ignoring re-entrainment cannot be used as both measurements in this study (figure 3) and previous theoretical works (Zarrebini & Cardoso Reference Zarrebini and Cardoso2000) have shown that re-entrainment significantly increases the particle concentration at the spreading level, and thus will have a significant impact on the magnitude of negative buoyancy present in the plume intrusion. To take advantage of the measurements of the spreading level particle concentration collected during each experiment, a simple theory which accounts for the re-entrainment of particles can be developed. Using the definition of  $N$, the density of the fluid at any height in the environment away from the reference height (taken as the height of the source) can be determined as
 \begin{equation} \rho = \rho_0 \left(1-\frac{N^2z}{g}\right). \end{equation}
 Now consider the difference between the density of the intrusion of fluid and particles and the density of the interstitial fluid only, with corresponding steady-state heights of  $z_s$ and $z_f$ respectively, using (5.4),
 \begin{equation} \rho_i-\rho_f = \frac{\rho_0N^2}{g}(z_f-z_s). \end{equation}
As the density of the intrusion is defined as  $\rho _i \approx \rho _f + \phi _s\rho _p$, (5.5) can be rearranged to
 \begin{equation} z_f-z_s \approx \frac{\phi_sg}{N^2} \left(\frac{\rho_p}{\rho_0}-1\right), \end{equation}
given that  $\rho _f/\rho _0 \approx 1$.
In figure 10, the experimental results for the change in intrusion fluid height are presented. When determining the height difference using the leading edges of both the multiphase intrusion below the plume maximum and the new fluid-only intrusion present higher in the environment (heights of which are presented visually in figure 8b), good agreement is found with (5.6). With this finding, the expected change in intrusion fluid height associated with particle fallout in a Type 1/1* plume can be readily determined using a re-entrainment coefficient of  $e^1$ as long as the particle flux at the source and the intrusion volume flux are known. However, this is not the case for plumes rising in the presence of ambient convection as the re-entrainment behaviour in these plumes is not yet understood and is outside of the scope of this particular study.

Figure 10. Change in intrusion fluid height following the sedimentation of particles from the two-phase intrusion. The solid line has a gradient of 1.
6. Conclusion
From this work, five different flow regimes in stratified particle-laden plumes have been identified. Although a number of parameters are important in defining the different plume types, what must be known in all cases is whether the particles are settling in the environment with some terminal settling velocity or whether the particle's downwards motion is dictated by ambient convection.
When no convection is present, the particle motion in the environment can be easily predicted and experiments have shown that the steady-state heights associated with these plumes can be determined by the model of Apsley & Lane-Serff (Reference Apsley and Lane-Serff2019). However, when ambient convection becomes important (i.e.  $u_{st}< U_c)$, the particle trajectory, and therefore particle re-entrainment, can no longer be predicted using the models currently present within the literature.
Because of this, further investigations into particle-laden plumes rising in the presence of ambient convection must be conducted such that additional insight can be gained into these complex flows. Examples of this include gaining a better understanding of the radial extent of convection in the environment and whether this has any influence on the transition between Type 3 and 3* behaviour, and also the development of methods to predict important flow characteristics such as the maximum plume height and the heights of the primary and secondary intrusions.
Supplementary material
Supplementary material is available at https://doi.org/10.1017/jfm.2021.673.
Funding
This work was funded by the Woolf Fisher Trust. Professor S. Cardoso and Dr N. Mingotti are also both greatly acknowledged for their contributions to this research.
Declaration of interests
The author reports no conflict of interest.
Appendix A. Real source corrections
A.1. Entrainment coefficient
The entrainment coefficient,  $\alpha$, for each plume was determined using the bulk parameter method, specifically by rearranging (1.3) to
 \begin{equation} \alpha = \left(\frac{(z_{max}-z_v)}{1.37B_0^{1/4}N^{{-}3/4}}\right)^{{-}2}. \end{equation}
A plot of  $\alpha$ against $\sigma$ shows the coefficient's dependence upon $\sigma$ (figure 11). Konstantinidou & Papanicolaou (Reference Konstantinidou and Papanicolaou2003) proposed that the entrainment coefficient of a stratified forced plume varied between pure plume and pure jet values with the empirical expression,
 \begin{equation} \alpha = \alpha_p \exp \left[\ln \left(\frac{\alpha_j}{\alpha_p}\right) \left(\frac{\sigma}{\sigma_c}\right)^2\right], \end{equation}
where  $\sigma _c$ is a critical value of $\sigma$ where momentum begins to dominate flow behaviour. Using this expression, based upon the work of List (Reference List1982) concerning forced plumes in an unstratified environment, Konstantinidou & Papanicolaou (Reference Konstantinidou and Papanicolaou2003) suggested values of $\alpha _p=0.123$, $\alpha _j=0.035$ and $\sigma _c=2$ to fit their experiments. More typical values of $\alpha _p=0.118$, $\alpha _j=0.076$ and $\sigma _c=1$ are also plotted for comparison.

Figure 11. Entrainment coefficient,  $\alpha$, against $\sigma$. The dashed line represents (A2) with the model inputs of Konstantinidou & Papanicolaou (Reference Konstantinidou and Papanicolaou2003). The solid line has inputs of $\alpha _p=0.118$, $\alpha _j=0.076$, $\sigma _c=1$.
A.2. Virtual source
Written explicitly by Hunt & Kaye (Reference Hunt and Kaye2001), the two-step virtual source correction for forced plumes consists of an exact correction,  $z_v$, and an asymptotic correction, $z_{avs}$, which is only appropriate at large distances from the real source. $z_v$ and $z_{avs}$ are defined as
 $$\begin{gather} - \frac{z_v}{L_m}=\left(\frac{100}{16\alpha_p^2{\rm \pi}}\right)^{1/4} \int_{\gamma}^{1} v^3(v^5-\gamma^5)^{{-}1/2} \,\textrm{d}v, \end{gather}$$
 $$\begin{gather}- \frac{z_{avs}}{L_m}=\left(\frac{0.078}{\alpha_p^{2}{\rm \pi}}\right)^{1/4}\gamma^{3/2}, \end{gather}$$
where  $\gamma =(1-\varGamma _0)^5$. Note that both (A3) and (A4) appear in a similar form to the corrections presented in Hunt & Kaye (Reference Hunt and Kaye2001) (see (12a–c)), however, the constant terms differ due to the definition of $L_m$ in this study and the use of top hat rather than Gaussian plume profiles. The asymptotic correction only becomes suitable to include in the correction when $z/L_m>3\alpha ^{-1/2}{\rm \pi} ^{-1/4}\gamma ^{3/2}$. For all experiments, the appropriate value of $z/L_m$ is achieved either above the maximum plume height or in between the spreading and maximum heights. Because of this, only the exact value, $z_v$, is utilised as the virtual source correction in these experiments.


 Open access