


1. Introduction
Recently, transverse flow-induced vibrations (FIVs) have emerged as a promising source to extract mechanical energy from a flowing fluid. The most efficient FIV phenomena for this purpose are vortex-induced vibrations (VIVs) (Bernitsas & Raghawan Reference Bernitsas and Raghawan2008) and transverse galloping (TG) (Barrero-Gil, Alonso & Sanz-Andres Reference Barrero-Gil, Alonso and Sanz-Andres2010). Bernitsas and collaborators proposed in 2006 (see Bernitsas & Raghawan Reference Bernitsas and Raghawan2008) a system of electric power generation from water currents taking advantage of the oscillations induced by vortex shedding in circular cylinders. Later on, the idea of taking advantage of the TG phenomenon was introduced by Barrero-Gil et al. (Reference Barrero-Gil, Alonso and Sanz-Andres2010). Through an analytical model, the role of the different parameters governing the problem was clarified and the potential for a reasonable large energy transfer was proved. Since then, different concepts of energy extraction based either on VIVs or TG have been presented. They focus either on a significant production of electrical energy (Bernitsas & Raghawan Reference Bernitsas and Raghawan2009; Barrero-Gil et al. Reference Barrero-Gil, Velazquez, Arias, Prieto, Vicente-Ludlam and Xu-Xu2015) or on the generation of small amounts of electrical energy, of the order of milliwatts, that could be used to power autonomous sensors and actuators (Wang et al. Reference Wang, Geng, Ding, Zhu and Yurchenko2020).
VIVs and TG are, probably, the two paradigmatic FIV problems for a flow past a bluff body (not streamlined). VIV is caused by a nonlinear resonance phenomenon. For high enough Reynolds number (say, larger than 50), the flow separates from the body surface, generating an unsteady broad wake, where large-scale vortices are shed periodically from the body surface. This leads to an alternating fluid force on the body. The shedding frequency of the vortices is related to the undisturbed flow speed and the size and shape of the body, as shown by Strouhal (Reference Strouhal1878). When the frequency of the vortex shedding is close enough to the natural frequency of oscillation of the elastic body, a close-to-resonance condition is reached. Then, significant crossflow oscillations may appear when the mechanical properties of the body (such as damping) are appropriate (Blevins Reference Blevins1990; Sarpkaya Reference Sarpkaya2004; Paidoussis, Stuart & De Langre Reference Paidoussis, Stuart and De Langre2011).
TG is a motion-induced instability that appears in elastic bluff bodies with certain geometrical shapes (square cross-section, D-section, triangular or H-type) (Naudascher & Rockwell Reference Naudascher and Rockwell1994), when the velocity of the incident flow exceeds a critical value. Then, a small transverse displacement of the body induces an angle of attack relative to the incoming flow and, therefore, an asymmetric pressure distribution on the body surface. Then, a fluid force appears in the direction of the displacement in such a way that energy is transferred from the flow to the body, and a oscillatory motion (transverse to the unperturbed flow) develops. Unlike VIV, which typically occurs in a range of flow velocities and with self-limited amplitude, TG occurs for any value of the flow velocity higher than the critical value, and has a monotonic increase of amplitude along with flow velocity. TG is mainly driven by the instantaneous angle of attack between the body and the incoming flow, and does not necessarily need a synchronisation between the oscillations and vortex formation and shedding.
VIV has been widely investigated experimentally (Williamson & Govardhan Reference Williamson and Govardhan2004) and numerically (Prasanth & Mittal Reference Prasanth and Mittal2008), mainly through the canonical problem of a spring-mounted rigid circular cylinder under the action of a uniform fluid flow. In most studies, the main interest has been the assessment of the effect of different mechanical and fluid parameters on the VIV response: steady-state oscillations (amplitude and frequency), fluid forces on the cylinder or flow patterns in the wake. TG has also received considerable attention from both analytical (Parkinson & Smith Reference Parkinson and Smith1964; Barrero-Gil, Sanz-Andres & Alonso Reference Barrero-Gil, Sanz-Andres and Alonso2009) and experimental research, with an emphasis on the study of the effect of different mechanical and fluid parameters on the body dynamics (Zdero, Turan & Havard Reference Zdero, Turan and Havard1995). The topic related to the energy transfer from the flow to the body via either VIV or TG also requires further research.
One question that remains open is related to the optimal cross-section shape for energy extraction, either in terms of the maximum efficiency achievable or with respect to the range of flow speed at which energy transfer from the flow to the body takes place at a significant level. In fact, contradictory results can be found in the literature, where different optimal cross-section shapes are claimed. The subject of looking for optimal cross-sections to maximise the energy transfer was initially addressed theoretically by quasi-steady analysis in Barrero-Gil et al. (Reference Barrero-Gil, Alonso and Sanz-Andres2010) where square, isosceles triangle and D-section cross-section shapes were considered. Among them, it was found the D-section as the most promising shape, with the highest theoretical value of energy extraction efficiency. Later on, Yang, Zhao & Tang (Reference Yang, Zhao and Tang2013), after a theoretical and numerical analysis of piezoelectric energy harvesting in a cantilevered arrangement, reported the superiority of the square cross-section. In this context, Meseguer, Sanz-Andrés & Alonso (Reference Meseguer, Sanz-Andrés and Alonso2014) claimed that the optimum shape should be the equilateral triangle. Ding et al. (Reference Ding, Zhang, Wu, Mao and Jiang2015) carried out 2D numerical simulations (URANS model, with Reynolds number in the range of  $10^4\unicode{x2013}10^5$) addressing four geometries: equilateral triangle, trapezoidal, circular cylinder with passive turbulence control (cylinder with two strips) and square. They reported that the best cross-section in terms of mechanical energy extraction from the flow was the trapezoid. All this shows that the question is far from being satisfactorily answered, and deserves further research. In this context, a new experimental campaign has been carried out, and the results are presented hereafter. Experiments were performed in a free surface water channel, and several cross-section geometries prone to show either VIV/TG or a combination of both were tested. For all geometries, the mechanical properties (mass, mechanical damping and stiffness) as well as the reduced velocity and Reynolds number regime covered were the same so as to allow a fair comparison.
The rest of the article is organised as follows. In § 2, the experimental set-up is described. In § 3, FIV results for all tested geometries are presented in terms of steady-state amplitude and frequency of oscillations, as well as in terms of efficiency of energy transfer from the flow to the body. An analysis of the wakes by means of particle image velocimetry (PIV) is also carried out for selected cases. In an attempt to understand how cross-section shape influences the amount of energy extracted, two dimensionless parameters have been introduced. They are linked to the centroid position of the semi-cross-section, and to the length of the afterbody, and represent in a condensed way the cross-section shape. The analysis of the dependence of the energy transfer along with these parameters is carried out in § 4. Finally, concluding remarks are presented in § 5.
2. Description of the experimental set-up
The experiments were carried out in the free-surface recirculating water channel of the Thermo-fluid Dynamic Systems and Microsystems Research Group of the Polytechnic University of Madrid (UPM). The water channel width and depth at the test section are 900 and 830 mm, respectively. The inflow conditions at the test section can be controlled in terms of mean speed, uniformity and low turbulence. A rigid prism with a fixed cross-section ( $A$), 20 mm in diameter $D$ was attached vertically to the free end of a double-blade elastic system. The submerged length of the prism was $L=210$ mm (see figure 1). The elastic system, which follows the arrangement described by Assi et al. (Reference Assi, Meneghini, Aranha, Bearman and Casaprima2006), was made up of two parallel rigid aluminium blocks ( $B$), coupled to a pair of thin spring-steel flexor blades ( $C$). This elastic system acts as the prism support and provides a linear restoration response. In this way, the prism is restricted to oscillate in the direction transverse to the flow ( $y$) with low mechanical damping. The experimental set-up is similar to that used in previous research by the authors (see, e.g., Xu-Xu, Barrero-Gil & Velazquez Reference Xu-Xu, Barrero-Gil and Velazquez2016; Vicente-Ludlam, Barrero-Gil & Velazquez Reference Vicente-Ludlam, Barrero-Gil and Velazquez2018). During the experiments, the transverse displacement of the prism was measured by a non-contact laser vibrometer ( $D$) from Aquity AR500-500 (range 500 mm, resolution 0.05 mm) whose DC signal was registered through a Ni-USB 6002 DAQ card from National Instruments. The sampling frequency was 90 Hz. The total mass of the system was controlled by adding masses to the lower block of the elastic system ( $E$). In all experimental tests, the total mass of the system was $m=2.4$ kg, the mechanical damping was $c=0.0842\ {\rm N}\ {\rm s}\ {\rm m}^{-1}$ and the stiffness $k=98\ {\rm N}\ {\rm m}^{-1}$. Mechanical damping and stiffness were measured via free vibration tests in still air. The frequency of oscillation in still air was found to be $f_N=1.01$ Hz. In dimensionless terms, the mass ratio was $m^*=m/\rho D^2 L=28.5$ ( $\rho$ is the water density) and damping ratio $\zeta =0.0028$. The flow speed $U$ was varied between $0.05\ {\rm m}\ {\rm s}^{-1}$ and a maximum of $0.3\ {\rm m}\ {\rm s}^{-1}$ (Reynolds number $Re=UD/\nu$, where $\nu$ is the kinematic viscosity of the water, between 1000 and 6000), as summarised in table 1.

Figure 1. Sketch of the experimental set-up (dimensions are in millimetres). (a) Top and side view of the water channel. (b) Close view photograph of the elastic system. (c) Detail of the elastic system's deformation when a translation in the transverse direction is applied.
Table 1. List of parameters during experiments.

In some experiments, PIV visualisations were performed to characterise the flow field of the prism wake. The flow was seeded with hollow glass spheres having a mean diameter of  $10\ {\mathrm {\mu }}{\rm m}$ (HGS-10). Illumination was provided by a diode-pumped solid-state 532 nm continuous laser ( $F$) from CNI Lasers with a maximum power of 5 W, that produced a 3 mm thick horizontal planar laser sheet. Images were taken using high-speed camera global shutter (model TIS-DMK-37BUX252) with a resolution of $2048\ {\rm pixels}\times 1536\ {\rm pixels}$. The camera was equipped with a 25 mm lens, and was positioned below the bottom side of the water channel $(G)$, which is made of glass, with one of the axis of the sensor of the camera aligned with the flow direction. A magnification of approximately $9.9\ {\rm pixels}\ {\rm mm}^{-1}$ was obtained. The field of view of the camera corresponded to a rectangle of $10.5\ {\rm D}\times 7{\rm D}$ that had physical dimensions of $209\ {\rm mm}\times 139\ {\rm mm}$, and focused on the cylinder near wake. PIV image cross-correlation analysis was carried out with open-source PIVlab software (Thielicke & Stamhuis Reference Thielicke and Stamhuis2014). Each PIV area was divided into smaller sub-interrogation areas of $64\ {\rm pixels}\times 64\ {\rm pixels}$. Through a parallel self-consistent re-computation of the flow field in successive interrogation areas of $32 \ {\rm pixels}\times 32\ {\rm pixels}$ and $16\ {\rm pixels}\times 16\ {\rm pixels}$, with 50 % overlap, spatial resolution was refined (final computations were consistent with the flow fields obtained for larger windows). The final spatial resolution of the flow field for the experimental tests was of the order of 2 mm, which is considered to be sufficient to obtain information of the near-wake vortex shedding structures.
Twelve different polylactic acid (PLA) prisms, with the same length, were manufactured on a 3D printer, and tested in the water channel. As already stated, the submerged length of the prisms was 210 mm, so the aspect ratio  $L/D$ was 10.5. The geometries of the prism's cross-sections were selected accounting for previous studies performed by other researchers in the area of energy harvesting from VIV/TG. Some variations of those standard geometries were also attempted. In all cases, the transverse dimension was the same (20 mm). All cross-sections had a plane of symmetry aligned to the incoming flow (see figure 2).

Figure 2. Photograph of the prisms tested. In all cases, the transverse (normal to flow) dimension is 20 mm. From left to right and upper to bottom: circular cylinder, D-section, C-section, diamond, PTC cylinder, rectangle (10 mm short side), square, cylinder with splitter plate (12.5 mm in length), trapezoid (20 mm along the flow direction and 10 mm short side), equilateral triangle, semi-cylinder plus triangle ( $90^{\circ }$ main vertex) cir-tri and open equilateral triangle.
All the experiments were carried out as follows. First, the incoming water velocity was prescribed at a low value ( $0.05\ {\rm m}\ {\rm s}^{-1}$), and measurements were taken during a time span of 2 min. Then, the instantaneous position of the prism $y(t)$ was measured and registered. After that, the water speed was increased in steps of $0.005\ {\rm m}\ {\rm s}^{-1}$ and the measurement procedure was repeated until either a speed of $0.3\ {\rm m}\ {\rm s}^{-1}$ was achieved, or the prism amplitude was higher than 60 mm (this limit was prescribed to ensure linearity in the elastic response). The following variables were computed for each water velocity: (i) the normalised amplitude of oscillation $A^*=A_{10}/D$, where $A_{10}$ is the average of the of the top 10 % of oscillation amplitude peaks; (ii) the normalised frequency of oscillations $f^*=f/f_N$, where the frequency of oscillations $f$ was computed using the fast Fourier transform of $y(t)$; and (iii) the efficiency of energy transfer from the flow to the body. The latter was computed by dividing the mean power dissipated by damping by the kinetic power of the incident flow across the submerged prism area:
 \begin{equation} \eta=\frac { \dfrac{1}{T}\displaystyle\int_0^T c\dot{y}^2\,{\rm d}t} {\dfrac{1}{2}\rho U^3D L}, \end{equation}
where  $T$ is a time period for averaging and $c$ is the mechanical damping constant. The transverse velocity of oscillations $\dot {y}$ was obtained by numerical differentiation of the transverse position $y$.
$y$.
3. Results
3.1. Circular and square prisms response
For consistency reasons, and to obtain reference data for comparison, the steady-state normalised amplitude of oscillations  $A^*$ dependence along with the reduced velocity $U^*=U/(f_nD)$ for the circular and square prisms are shown in figure 3. For comparison purposes, circular cylinder (Assi et al. Reference Assi, Meneghini, Aranha, Bearman and Casaprima2006) and square cylinder (Zhao et al. Reference Zhao, Leontini, Lo Jacono and Sheridan2014) results are also shown. The overall agreement is good. As could be observed, circular cylinder response presents slight differences, which could be reasonably ascribed to the different experimental conditions. The maximum dimensionless amplitude is close to 0.8 which is consistent with results published in the literature for this value of the mass-damping parameter $m*\zeta$ (0.079) and Reynolds number regime (Govardhan & Williamson Reference Govardhan and Williamson2006). The square response seems to present larger discrepancies, but they are due to the very different values of mass ratio. In fact, in the renormalised scaling proposed by Bouclin (Reference Bouclin1977) $A'=A^*/m^*$ and $U'=U^*/m^*$ it follows that $A'=0.08 U'$ in both cases.

Figure 3. (a) Comparison of experimental results for the circular cylinder in terms of the normalised amplitude variation along with reduced velocity. Circles are from Assi et al. (Reference Assi, Meneghini, Aranha, Bearman and Casaprima2006) ( $m^* = 8.1,\ \zeta = 0.0020$), whereas squares denote for the present results ( $m^* = 28.3,\ \zeta = 0.0028$). (b) Comparison of experimental results for the square prism; circles are from Zhao et al. (Reference Zhao, Leontini, Lo Jacono and Sheridan2014) ( $m^* = 2.6,\ \zeta = 0.0026$), whereas points denote the present results ( $m^*= 28.3,\ \zeta =0.0028$). (c) Time history of circular cylinder displacement at $U^*=4.9$ (a,b) and $U^*=8.3$ (e,f). (d) Time history of the square prism displacement at $U^*=7.3$ (a,b) and $U^*=13.3$ (e,f).
In addition, the transverse to the flow motion evolution with time is presented for the circular cylinder, at  $U^*=4.9$ and $U^*=8.3$. When large oscillations are present, $U^*=4.9$, their amplitude and frequency are nearly constant. For the square prism at $U^*=7.3$, when VIV is combined, presumably, with galloping, the oscillations maintain a sinusoidal shape, but the amplitude presents a slight modulation with time. The same could be observed at a higher reduced velocity, $U^*=13.3$, but to a lesser extent, because galloping is the dominant effect now.
3.2. Dynamics and energy transfer
First, the dynamic response of the different prisms is presented. The response in all cases is very much sinusoidal, and the transverse displacement can be characterised in terms of both amplitude and frequency of oscillations. Figure 4 shows the normalised amplitude of oscillations,  $A^*$, dependence along with the reduced velocity $U^*=U/(f_N D)$ for all the cross-section shapes tested. For the circular cylinder, only VIV takes place and oscillations appear in a limited range of reduced velocities. The maximum dimensionless amplitude of oscillations is 0.8, which is consistent with results published in the literature for this value of the mass-damping parameter $m^*\zeta$ (0.079) and Reynolds number regime (Govardhan & Williamson Reference Govardhan and Williamson2006). PTC cylinder also experiences VIV only, but weaker than in the case of the circular cylinder. For other shapes, the amplitude of oscillations after VIV increases monotonically along with the reduced velocity, which suggests that TG is present. The D-section and the C-section are those with the higher response. In both cases amplitude of oscillation is nearly the same. The amplitude being slightly higher in the D-section for low reduced velocities. The opposite occurs in the range of large reduced velocity. Open and closed equilateral triangles also show strong oscillations, with an abrupt increase in amplitude of oscillations between $U^*=5.4$ and $U^*=5.6$. This may be indicative of an abrupt change in the vortex shedding mode and hysteretic behaviour. This is also observed at the same reduced velocities for the rectangular cross-section. Note that for some geometries the range of reduced velocities tested is smaller than for others, because the limit prescribed to stop the experiment when the amplitude of oscillations is very large.

Figure 4. Normalised amplitude of oscillations,  $A^*$, dependence along with the reduced velocity $U^*$ and geometry: (a) open equilateral triangle (square points), D-section (open circle), equilateral triangle (diamond), c-section (pentagon star), square (point), rectangle (plus sign); (b) circular cylinder (square), PTC cylinder (open circle), diamond (diamond), trapezoid (pentagon star), circular cylinder with plate (point), cir-tri (plus sign).
Figure 5 shows the normalised frequency of oscillations as a function of the reduced velocity. Owing to the large value of the reduced mass, variation of  $f^*$ with $U^*$ is relatively small. The cross-section showing larger departures in $f^*$ is the square.

Figure 5. Normalised frequency of oscillations as a function of the reduced velocity: (a) open equilateral triangle (square), D-section (open circle), equilateral triangle (diamond), C-section (pentagon star), square (point) and rectangle (plus sign); (b) Circular cylinder (square points), PTC cylinder (open circle), diamond (diamond), trapezoid (pentagon star), circular cylinder with plate (point) and cir-tri (plus sign).
The efficiency of energy extraction is shown in figure 6 as a function of the reduced velocity, for all the geometries tested. The behaviour, in all cases, is as follows: from a certain reduced velocity the efficiency initially increases along with the reduced velocity until a peak value is achieved. Then, it diminishes progressively towards zero. A tentative explanation for this behaviour can be given. The efficiency is defined as (see (2.1))
 \begin{equation} \eta=\frac{\dfrac{1}{T}\displaystyle\int_0^T c\dot{y}^2 \,{\rm d}t}{\dfrac{1}{2}\rho U^3 D L}, \end{equation}
so that under quasi-harmonic oscillations  $y\approx =A\sin (2{\rm \pi} f t)$ and $\dot {y}\approx =2{\rm \pi} A f \omega \cos (2{\rm \pi} f t)$, so it follows that
 \begin{equation} \eta\approx\frac{16{\rm \pi}^3 c A^2 f^2}{\rho U^3 D L}=\frac{16{\rm \pi}^3 m^*\zeta A^{*2}f^{*2}}{U^{*3}}.\end{equation}
For those geometries where only VIV takes place, the amplitude of oscillations follows a bell-shaped-type response with the reduced velocity so a peak for efficiency in energy harvesting is expected. For those geometries experiencing also galloping, according to the experimental results the normalised amplitude of oscillations can be approximated crudely by a linear trend  $A^*\approx k_2 U^*-k_1$, where $k_1$ and $k_2$ are two positive constants whose values depend on the geometry of the cross-section because the rest of the parameters were fixed during experiment. Then, from (3.2) it follows that
 \begin{equation} \eta\approx 16{\rm \pi}^3 m^*\zeta\frac{({-}k_1+k_2U^*)^2 f^{*2}}{U^{*3}}, \end{equation}
which is valid for  $U^*>k_1/k_2$ and helps to explain the observed behaviour and why a peak value of efficiency occur at certain value of the reduced velocity (note, for example, how $\eta$ tends to zero as $U^*$ grows).

Figure 6. Efficiency ( $\eta$) dependence with the reduced velocity and geometry: (a) open equilateral triangle (square points), D-section (open circle), equilateral triangle (diamond), c-section (pentagon star), square (point) and rectangle (plus sign); (b) Circular cylinder (square points), PTC cylinder (open circle), diamond (diamond), trapezoid (pentagon star), circular cylinder with plate (point) and cir-tri (plus sign).
D-section appears to be the best cross-section in terms of maximum (peak) efficiency of energy transfer ( $\eta _M=0.43,\ U^*_M=4.9$), followed by the C-section ( $\eta _M=0.4, U^*_M=6.1$), the circular cylinder ( $\eta _M=0.18,\ U^*_M=4.9$), the equilateral triangle ( $\eta _M=0.17,\ U^*_M=7.1$), the open equilateral triangle ( $\eta _M=0.16, U^*_M=9.3$) and the rectangle ( $\eta _M=0.11,\ U^*_M=5.9$). Other shapes have a peak value of efficiency lower than 0.1. Regarding the range of reduced velocity where efficiency is significant, it could be noted that D-section, C-section and triangular shapes (open and closed) present high efficiency in a large range of reduced velocities. For $U^*<6$, the D-section presents higher efficiency, but for larger reduced velocities the C-section presents higher efficiency than the D-section. As a general rule, with the exception of the circular cylinder, it can be said that the more prone to TG the cross-section is, the higher the efficiency.
3.3. Vortex wakes
For a better understanding from a fundamental point of view, PIV visualisations of the near wake are presented here. Non-dimensional vorticity contours,  $\varOmega ^*=\varOmega D/U$, where
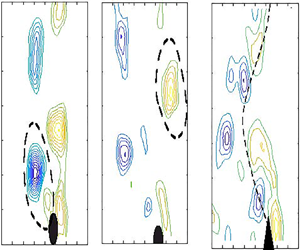
  $\varOmega =\varDelta \times \boldsymbol {v}$ is the rotational of the flow velocity, are given in figure 7 for three cross-section shapes. They are the D-section, circular cylinder and equilateral closed triangle, at the values of the reduced velocity where the peak efficiency is achieved. The non-dimensional vorticity contours have been obtained by using high-order singular value decomposition (HOSVD) of the flow velocity field to retain the higher-level energy modes, and to filter high spatial and temporal frequencies. In the plots, the flow goes upwards and vorticity plots are presented every 1/4 of the oscillation period. The instantaneous position of the prism is represented by its cross-section sketched in black. For completeness, the time history of oscillation is also shown in the upper part of the figure.

Figure 7. Non-dimensional vorticity contours  $\varOmega ^*=\varOmega D/U$ for the circular cylinder (a,d,g,j,m,p), the D-section (b,e,h,k,n,q) and the equilateral triangle (c,f,i,l,o,r). Blue colour indicates clockwise circulation and yellow colour counter-clockwise circulation. For both the cylinder and the D-section the reduced velocity is 4.9, whereas for the equilateral triangle the reduced velocity is 7.1. In the vorticity plots the flow goes from the bottom to the top.
The following can be observed. (i) For both the cylinder and the D-section a synchronisation between the oscillations and the vortex shedding appears, which suggest that the dominant mode of flow-induced instability is VIV. However, there is no clear synchronisation between vortex shedding and oscillation for the equilateral triangle, suggesting that TG takes place in this case. (ii) The vortical structure in the cylinder is  $P_0$, which denotes that two vortices are shed per half-cycle of oscillation where the second is smaller, whereas a 2S-mode type with a single vortex being shed per half-cycle of oscillation is observed for the D-section. In the equilateral triangle the wake structure is more complex and vortex shedding seems to be decoupled to a certain extent from the oscillation. No clear vortex-shedding mode can be identified and the wake pattern resembles a wave such as each vortex is shed independently at different points of the cycle of oscillation. (iii) The vorticity intensity of the shed vortices is found to be larger for the cylinder, and smaller for the equilateral triangle. (iv) Because of the multiples scales of vorticity for the equilateral triangle, the time history of oscillations is a little less sinusoidal than for the D-section or the circular cylinder.
To look for the physical reasons behind the observed differences in terms of efficiency transfer, the flow structure close to the body surface was studied. Figure 8 shows the flow vector field near the body surface along with the instantaneous streamlines for the D-section and the circular cylinder for  $U^*=4.9$, at the instant when the speed of transverse oscillations is maximum $\dot {y}=\dot {y}_{max}$ ( $y=0$) and $\dot {y}=\dot {y}_{max}/2$. The flow near the surface is more asymmetric for the D-section, where the flow is fully attached in one side of the cross-section contour (front side with respect to $\dot {y}$) and fully detached on the other side (rear side). Massive flow separation induces a pressure imbalance between the zone where the flow is attached (lower pressure) and the zone where the flow is separated (higher pressure), so a stronger fluid force appears in the direction of the motion $F_y$ for the D-section and, accordingly, the energy transfer from the flow to the body ( $F_y\dot {y}$).

Figure 8. Flow velocity vectors and streamlines around the circular cylinder when the transverse speed of the cylinder is half of its maximum (a) and at maximum (b). The same for the D-section, half maximum (c) and maximum speed (d).
To reinforce the argument, figure 9 shown the streamlines plot for the D-section at a reduced velocity of 4.9, where  $\eta =0.43$, along with those obtained for a reduced velocity of 4.0, where the efficiency is significantly lower ( $\eta =0.17$). It could be observed that the case with lower efficiency (figure 9b) show less asymmetry in the flow near the surface that the case with high efficiency (figure 9a).

Figure 9. Flow velocity vectors and streamlines around the D-section when the transverse speed is at maximum (motion is from right to left) at  $U^*=4.9$ (a) and $U^*=4.0$ (b).
If asymmetry of the flow in very near wake when the transverse velocity is maximum explains the extent the energy transfer, this allows us to explain why the D-section is able to extract the larger energy from the flow. That is, when the transverse velocity is maximum the instantaneous angle of attack is  $\alpha _M=\tan (-\dot {y}/U)$ and, at such incidence the flow is able to follow one of the sides of the cross-section contour, whereas is detached in the other (see figure 10). Therefore, a cross-section shape is good for energy extraction if at large $\alpha _M$ the flow is able to follow the contour of the front side, and is massively separated at the rear side.

Figure 10. Effect of the transverse body movement on separated shear layers.
4. Maximum efficiency as a function of the geometric center of the cross-section and afterbody length
It is well known that transverse FIV depends both on the size and on the shape of the afterbody (Parkinson Reference Parkinson1989). The afterbody is defined as the part of the cross-section located downstream of points where flow detachment is expected to occur. As only geometries with a symmetry axis along the flow direction are prone to experience strong VIV and TG, the centroid position of the semi-cross-section, having coordinates  $x_c,y_c$ with respect to the stagnation point $S$, see figure 11, is selected here to characterise the shape. The length of the afterbody is given by $x_s$ and the total length by $x_t$. Thus, two dimensionless parameters are introduced, namely $\tau _1=x_c/(x_t+x_{s})$ and $\tau _2=y_c/(x_t+x_s)$. Note that $\tau _1$ provides a measure of the frontsize length versus the afterbody length. As $\tau _1$ increases, the frontbody length dominates over the afterbody length. Here $\tau _2$ is a measure of the bluntness of the cross-section shape. Small values of $\tau _2$ are expected for streamlined shapes and higher values for blunt shapes. Figure 11 shows a contour plot computed with the measured peak efficiencies for all geometries tested as a function of $\tau _1$ and $\tau _2$.

Figure 11. Contour plot of the peak efficiency as a function of  $\tau _1$ and $\tau _2$.
In spite of the limited number of geometries tested, it seems from visual inspection that there appears two different zones with good peak efficiencies  $\eta _M$ around $\tau _1=\tau _2=0.22$ and around $\tau _1=\tau _2=0.28$. The first region corresponds to solid cross-section shapes (e.g. D-section) whereas the second area corresponds to open cross-section shapes (such as C-section).). For the first region, it could be noted that a quasi-linear relationship seems to be present between $\tau _1$ and $\tau _2$ for optimal $\eta _M$. Note that there is a line (see line ${MM}'$ in figure 11) that shows a monotonic trend, from lower to higher $\eta _M$ in the M to ${M}'$ direction. However, we have not been able to find the same type of trend for the second region, so we suggest to consider the line ${MM}'$ as a locus for high efficiency (let us consider it as ‘optimal’). A linear fit of the optimal line ${MM}'$ gives
 \begin{equation} \tau_2^{op} \approx 1/2-(5/4)\tau_1^{op},\end{equation}
where ‘op’ superscript denotes ‘optimal’. From the definitions of  $\tau _1$ and $\tau _2$ it follows that
 \begin{equation} \tau_1=\frac{x_c}{x_t+x_s}=\frac{x_c}{x_t(1+x_s/x_t)}=\frac{x_c}{x_t}\frac{1}{1+\beta}, \quad \tau_2=\frac{y_c}{x_t}\frac{1}{1+\beta}, \end{equation}
where  $\beta =x_s/x_t$ is a dimensionless parameter that relates the length of the afterbody to the total length of the cross-section shape in the flow direction. Substituting (4.2a,b) into (4.1) yields
 \begin{equation} \frac{5}{4}\frac{x_c^{op}}{x_t}+\frac{y_c^{op}}{x_t}=\frac{1+\beta}{2},\end{equation}
that gives the location of the centroid for optimal energy transfer (that is along the line  ${MM}'$ in figure 11) for a fixed $\beta$ value (afterbody length versus total length).
To test the validity of this relationship, the optimal cross-section for the half-elliptical and isosceles triangular families was sought. Considering, first, a half-ellipse of transverse dimension  $D$ and an in-line dimension $a$ (see figure 12 for illustration), the position of the centroid in the semi-cross-section is given as $x_c=4a/(3{\rm \pi} )$ and $y_c=2D/(3{\rm \pi} )$, $x_t=a$ and $x_s=a$ ( $\beta =1$). From (4.3) it follows that for optimal energy transfer $5+2D/a=3{\rm \pi}$ and, therefore, $a=2D/(3{\rm \pi} -5)$. For $D=20$ mm the in-line dimension $a$ has to be of 9.04 mm. Figure 12 shows the normalised amplitude of oscillations and the energy transfer efficiency as a function of the reduced velocity for the half-ellipse with $D=20$ mm and $a=9.04$ mm. A peak efficiency of 0.47 was found, which is larger that the value found for the D-section (which is a half-ellipse with $D=20$ mm and $a=10$ mm). A half-ellipse with a lower aspect ratio $D=20$ mm and $a=8$ mm was also manufactured and tested in order to see whether maximum efficiency is lower than that for the optimal case. As can be seen in figure 12, the maximum efficiency is in this case 0.42, a lower figure than that obtained for the ellipse with $D=20$ mm, and $a=9$ mm (it was 0.47). This result is thus inline with the prediction that for half-ellipses the optimum should be achieved when the aspect ratio is close to 0.45 ( $D=20\ {\rm mm},\ a=9.04\ {\rm mm}$).

Figure 12. Normalised amplitude of oscillations (a) and efficiency  $\eta$ (b) dependence with the reduced velocity for the half-ellipses with in-line dimensions $a=9$ mm and $a=8$ mm.
For isosceles triangular cross-sections of transverse dimension  $D$ and in-line dimension a (see figure 13), $x_c=a/3$ and $y_c=D/6$, $x_t=a$ and $x_s=a$ ( $\beta =1$). Then, from (4.3) it follows $5/12+D/(6a)=3{\rm \pi}$ and, therefore, the optimal triangle would be that with an in-line dimension of $a=2/7 D$. This implies a main vertex of approximately $120^\circ$. Figure 13 shows the normalised amplitude of oscillations and the efficiency as a function of the reduced velocity for the isosceles triangle with main vertex of $120^\circ$. A very high value of efficiency is found with a maximum figure around 1.15 at reduced velocity 8.1 (this maximum value involves some ambiguity because oscillations were so strong that it was decided not to increase flow speed further to avoid nonlinearities in the elastic response). This high efficiency value figure agrees well with the theoretical prediction about optimal shape. In order to test if best isosceles triangle was found, another isosceles triangular cross-section triangle with a main vertex of $90^\circ$ was manufactured and tested. Results are given in figure 13. In terms of efficiency a maximum value $\eta _M$ of 0.39 was measured which, as expected, is lower than that measured for the $120^\circ$ isosceles triangle. These results suggest that taking the position of centroid may be useful to characterise the expected flow energy transfer from the flow to the body, and that the information given by the $\tau _1$– $\tau _2$– $\eta _M$ map describes a correct trend when looking for the optimal cross-section shape.

Figure 13. Normalised amplitude of oscillations (a) and efficiency  $\eta$ (b) dependence with the reduced velocity for the half-ellipse and isosceles triangles ( $120^\circ$ and $90^\circ$ main vertex).
Additional experiments were carried out to further test the validity of the coordinates  $\tau _1$ and $\tau _2$ to link with $\eta _M$. A polygonal cross-section, (see figure 14 for geometric definition) was designed and manufactured for testing purposes. For this geometry $tau_1=0.211$ and $\tau _2=0.214$, that are very close to the ones of the D-section ( $\tau _1=\tau _2=0.212$). Figure 14 shows the results obtained in terms of efficiency. In spite of the geometrical differences between the D-section and the new polygonal cross-section (note the presence of a corner in the afterbody of the polygonal cross-section), $\eta _M$ is quite similar in both cases ( $\eta _M=0.45$ for the new triangle and $\eta _M=0.43$ for the D-section). This reinforces the idea that $tau_1$ and $\tau _2$ are useful coordinates to characterise $\eta _M$.

Figure 14. Power efficiency as a function of the reduced velocity for the D-section and a polygonal cross-section. Modified triangular cross-section presents nearly the same values of  $\tau _1$ and $\tau _2$ than the D-section.
5. Concluding remarks
In a simplified way, a system meant to extract energy from a fluid flow that takes advantage of transverse FIV is made up of three main elements: (i) the geometry of the body immersed in the fluid flow; (ii) the elastic (structure) system that provides the restoring force; and (iii) the transducer, where the oscillatory mechanical power is transformed in electric power. Searching for energy transfer optimisation from the ‘fluid side’, thus avoiding structural and energy optimisation stages, requires to find the body with the optimal cross-section shape. In this context, hydroelastic experiments have been carried out to study the influence of the cross-section geometry in the energy extraction from transverse FIV. For all tested geometries all relevant dimensionless parameters: the mass ratio, the dimensionless damping, the reduced velocity and the Reynolds number remained the same. Because of the low value of the mass damping parameter ( $m^* \zeta =0.079$) all geometries were unstable to transverse FIV in the range of reduced velocities actually covered. By doing this, the role of the cross-section geometry can be isolated, and its influence inferred correctly.
In a first set of experiments, twelve cross-section shapes, commonly considered in the past in the study of transverse FIVs, were tested. It was found that, for this set of geometries, the most unstable shape that extracts energy from the flow more efficiently is the D-section shape (half-cylinder), with a maximum efficiency  $\eta _M$ of 0.44. As a general trend, excluding the circular cross-section, it was found the more prone to TG the shape the higher the efficiency achievable.
To better understand the role of the shape on  $\eta _M$ two dimensionless geometric parameters ( $\tau _1,\tau _2$) were introduced to characterise the cross-section shape. These parameters were linked to the centroid position of the semi-cross-section, and to the length of the afterbody, and they map $\eta _M$ vs $\tau _1$ and $\tau _2$. In spite of the relatively limited number of shapes tested in the study, this bi-parametric map allows the identification of regions where $\eta _M$ is high. A further step was then given noting that there seems to exist a locus in the $\tau _1$ and $\tau _2$ space where maximum efficiency is optimised, which is close to a linear mathematical relationship between $\tau _1$ and $\tau _2$. This optimal relationship between $\tau _1$ and $\tau _2$ allowed to propose ‘in advance’ the best cross-section in the family of isosceles triangles, which resulted to be that with a main vertex of $120^\circ$. Experiments confirmed the expected high values for energy transfer for this case, where a very high figure of maximum efficiency was measured (1.15), and supports the validity of the proposed relationship. Also they supported the idea that the geometric centroid of the semi-cross-section and the afterbody length of the cross-section could be taken as a simple and effective metric to characterise the energy transfer and the magnitude of transverse oscillations. It should be noted that the $\tau _1$– $\tau _2$– $\eta _M$ map is useful not only to look for a promising cross-section shape for energy-harvesting purposes, but, also, to search for ‘safe’ cross-section shapes against FIV (those giving low values of $\eta _M$). For instance, the map could be useful to identify safe FIV regions, which can be useful in the offshore and wind engineering fields.
Finally, it should be observed that the  $\tau _1$– $\tau _2{-}\eta _M$ relationship has been obtained by isolation of the geometry effects, because the other governing parameters of the problem were unchanged during experiments (mass ratio, dimensionless damping, reduced velocity range, aspect ratio and Reynolds number range). Nevertheless, a word of caution is required here because the question as to whether the $\tau_1{-}\tau_2{-}\eta_M$ map trend remains quantitatively valid for other combination of mechanical and flow parameters is still open, and requires further research.
Acknowledgements
A.B.-G. and A.V. have been funded by the Spanish Ministry of Science and Innovation under research contract PID2019-109619GB-C21, and gratefully acknowledge this support. S.S., funded by the Erasmus program, stayed at Universidad Politecnica de Madrid, and gratefully acknowledges this support.
Funding
Part of this research have been funded by the Spanish Ministry of Science and Innovation under research contract PID2019-109619GB-C21.
Declaration of interests
The authors report no conflict of interest.


 Open access