


1. Introduction
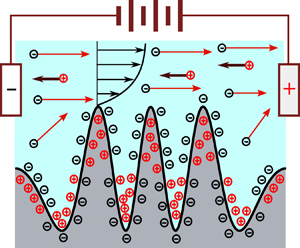
An electric field, when applied tangentially to a charged solid–liquid interface in an overall electrically neutral system, tends to pull the excess ions in the liquid along with itself. The liquid, thus, gets forced to move via viscous interactions along with the excess counterions, resulting in bulk liquid motion relative to the solid boundary, known as electroosmosis or electroosmotic flow (EOF) (Hunter Reference Hunter2013). The resulting flow velocity is known to depend on the electrical permittivity and viscosity of the liquid, the applied electric field and the electrical potential built up at the interface, as commonly expressed in terms of the zeta potential as per the traditions in colloidal electrochemistry. The zeta potential, despite being conceptually straightforward, however, may not necessarily be trivial to ascertain in practice, as attributable to its complex dependence on the substrate composition and the solution chemistry (Kirby & Hasselbrink Reference Kirby and Hasselbrink2004). Irrespective of such evidently complex confluences, nevertheless, their resulting culmination in modulating the consequent interplay of electromechanics and hydrodynamics is commonly described by an elusively simplified albeit highly insightful conceptual depiction via the celebrated Helmholtz–Smoluchowski (HS) model. This model relates the EOF velocity to the zeta potential of the substrate, the permittivity and viscosity of the ionized liquid in contact with the same and the applied electric field. Despite its overwhelming simplicity, this conceptual paradigm constitutes a deep-rooted theoretical foundation for the interpretation of electrokinetic measurements (Hunter Reference Hunter2013) and its applications in areas such as microfluidics and separation science (Dubov, Molotilin & Vinogradova Reference Dubov, Molotilin and Vinogradova2017; Biagioni & Cerbelli Reference Biagioni and Cerbelli2022).
The classical HS theory is built upon two major underlying assumptions, namely, a homogeneously charged interface and a topographically uniform substrate. In practice, however, deviations from such idealized electrokinetic interfaces may not only be the obvious artefacts of real-life materials and manufacturing processes but also be introduced artificially via strategic chemical patterning, embedded electrodes and imposition of deliberate pH and salt concentration gradients (Stroock et al. Reference Stroock, Weck, Chiu, Huck, Kenis, Ismagilov and Whitesides2000; Pirat et al. Reference Pirat, Naso, van der Wouden, Gardeniers, Lohse and van den Berg2008; Cho, Chen & Chen Reference Cho, Chen and Chen2012; Prakash & Conlisk Reference Prakash and Conlisk2016; Ramos, García-Sánchez & Morgan Reference Ramos, García-Sánchez and Morgan2016; Werkhoven et al. Reference Werkhoven, Everts, Samin and van Roij2018; Ault, Shin & Stone Reference Ault, Shin and Stone2019; Paratore et al. Reference Paratore, Bacheva, Kaigala and Bercovici2019a; Startsev & Inglis Reference Startsev and Inglis2019; Al Hossain et al. Reference Al Hossain, Yang, Checco, Doerk and Colosqui2020; Ravnik & Everts Reference Ravnik and Everts2020; Boyko et al. Reference Boyko, Bacheva, Eigenbrod, Paratore, Gat, Hardt and Bercovici2021; Pial et al. Reference Pial, Sachar, Desai and Das2021). In an uncontrolled condition, the incidental spatial variations in the zeta potential may result in unwarranted solute dispersion in capillary electrophoresis and isoelectric focusing (Datta & Ghosal Reference Datta and Ghosal2009). On the other hand, if judiciously designed, such patterned interfaces may serve the purpose of tuneable flow control and mixing by creating vortex patterns that may otherwise be difficult to realize in low-speed hydrodynamics (Lee et al. Reference Lee, Hau, Lee and Zohar2005; Chang & Yang Reference Chang and Yang2006; Huang et al. Reference Huang, Wang, Khoo and Tseng2007; Ghosh & Chakraborty Reference Ghosh and Chakraborty2012; Dehe, Rehm & Hardt Reference Dehe, Rehm and Hardt2021).
With advents in laboratory-standardized micro- and nano-fabrication and surface engineering technologies, a patterned zeta potential, which remained previously as a mere theoretical proposition (Ajdari Reference Ajdari1995; Ghosal Reference Ghosal2002; Datta, Ghosal & Patankar Reference Datta, Ghosal and Patankar2006; Ohshima Reference Ohshima2015; Bolet, Linga & Mathiesen Reference Bolet, Linga and Mathiesen2018; Boyko et al. Reference Boyko, Eshel, Gat and Bercovici2020), could be brought to the experimental realm, focusing the spotlight on applying the same in augmenting micromixing (Stroock & Whitesides Reference Stroock and Whitesides2003; Cho et al. Reference Cho, Chen and Chen2012; Biagioni & Cerbelli Reference Biagioni and Cerbelli2022), cloaking and shielding of objects (Boyko et al. Reference Boyko, Bacheva, Eigenbrod, Paratore, Gat, Hardt and Bercovici2021), and improving other measures for flow control and transport (Dubov et al. Reference Dubov, Molotilin and Vinogradova2017; Dehe et al. Reference Dehe, Rofman, Bercovici and Hardt2020). One central theoretical finding that could thus corroborate several experimental outcomes concerned the consideration of a spatially averaged effective zeta potential for quantifying the net flow over charge-modulated interfaces (Stroock et al. Reference Stroock, Weck, Chiu, Huck, Kenis, Ismagilov and Whitesides2000; Kirby & Hasselbrink Reference Kirby and Hasselbrink2004), which served the purpose of deriving essential theoretical insights except for the situations where non-equilibrium effects such as those arising from non-uniformities in ionic conduction could result in significant deviations in the interfacial electrochemistry (Khair & Squires Reference Khair and Squires2008; Khair & Balu Reference Khair and Balu2020). However, providing insights into highly localized flow control over surface topographical scales remained beyond the purview of these simplified theories, as attributed to a coarse graining of the key interfacial influences.
Dramatic recent advancements in nanotechnology, precision engineering and additive manufacturing fostered the realization of surface topographies with highly intricate features, spatially resolved up to the scale of the electrical double layer (Stroock & Whitesides Reference Stroock and Whitesides2003; Qin, Xia & Whitesides Reference Qin, Xia and Whitesides2010; Lim et al. Reference Lim, Lim, Lam, Taboryski and Wang2017; Liu et al. Reference Liu, Petrosko, Zheng and Mirkin2020; Cheng et al. Reference Cheng, Fan, Zhang and Bandaru2021), ushering new vistas in augmented micromixing (Stroock & Whitesides Reference Stroock and Whitesides2003), electroosmotic pumping with a wide range of control features (Gitlin et al. Reference Gitlin, Stroock, Whitesides and Ajdari2003) and highly efficient separation of solutes (Dubov et al. Reference Dubov, Molotilin and Vinogradova2017; Goyal & Datta Reference Goyal and Datta2022). Gate electrodes have been embedded inside micro-fabricated capillaries with periodically repeating convergent–divergent sections (Kateb, Kolahdouz & Fathipour Reference Kateb, Kolahdouz and Fathipour2018; Kateb, Fathipour & Kolahdouz Reference Kateb, Fathipour and Kolahdouz2020), thus bringing current technology closer to realizing controlled charge modulation over a topography, although these capillaries are yet to be employed in experiments to convey electrolytes.
Despite such progress and the notable early contributions from Ajdari that consider sinusoidal grooves and sinusoidal surface charge patterning decorating the same (Ajdari Reference Ajdari1996) as well as opposite (Ajdari Reference Ajdari1995) walls of a plane channel in the thin Debye layer limit, the role of a simultaneous and possibly independently configurable patterned variation of the zeta potential and the surface topography remained underemphasized. A study formulated to accept, as independent inputs, distinct shape functions for the co-existent topographical and surface-charge modulations on a solid–liquid interface, rather than using predetermined shapes like sines, uniform values, steps and boxcars, is absent in the literature. Summarily, while the theoretical propositions on simple sinusoidal topographies of solid boundaries (Ajdari Reference Ajdari1996; Shu et al. Reference Shu, Chang, Chen and Wang2010; Chang et al. Reference Chang, Jian, Buren and Sun2016; Lei et al. Reference Lei, Chen, Chang and Wang2017; Lei, Chang & Wang Reference Lei, Chang and Wang2019) or their modifications to more complicated forms (Goyal & Datta Reference Goyal and Datta2022) emerged to be insightful, these remained inadequately coupled with the consideration of a realistic variable surface-charge distribution so as to unveil their intricate interplay and the resulting consequences in unexplored avenues of non-trivial flow control.
Intuitively, one may superimpose the effects of the charge and topographical modulations to explain the electroosmosis over interfaces that are simultaneously patterned in terms of their geometries and induced electrical voltages (or local charge densities). However, the resulting electro-fluidic coupling remains far from being well understood, except for electroosmosis in slit microchannels having thicknesses much smaller than the surface waviness length scales so that the lubrication theory may be leveraged to explain the electro-fluidic coupling over the charge-modulated interfaces, irrespective of the surface topography (Ghosal Reference Ghosal2002; Yoshida, Kinjo & Washizu Reference Yoshida, Kinjo and Washizu2016; Qi & Ng Reference Qi and Ng2018). In addition, the reported studies in this regard remained restrictive to sinusoidal and other pre-defined profile variations in the topographies (Ajdari Reference Ajdari1996; Jain & Nandakumar Reference Jain and Nandakumar2013; Masilamani et al. Reference Masilamani, Ganguly, Feichtinger, Bartuschat and Rüde2015; Bera & Bhattacharyya Reference Bera and Bhattacharyya2018), with no particular emphasis on the dynamically coupled electro-fluidic interactions stemming from the patterning waveforms of the surface charge and topography. Reported results on special cases conforming to the applied electric field being aligned parallel to the surface features, thin electrical double layer (EDL) limits and weakly charged surfaces (Messinger & Squires Reference Messinger and Squires2010) also remained somewhat restrictive in extrapolating to more generalized scenarios of an arbitrarily applied electric field interacting with topographically modulated interfaces having arbitrarily distributed periodic charges, which is the central focus of the present work.
Here, we report insights into the coupled effect of surface charge and topographical patterning on electroosmotic transport over surfaces having arbitrary periodic variations. Particular emphasis is laid on exploring the routes to flow accentuation, deflection and reversal in contrast to the previously established notion of trivial suppression of the EOF via surface corrugations (Messinger & Squires Reference Messinger and Squires2010; Goyal & Datta Reference Goyal and Datta2022), so as to strategize more versatile EOF control as compared with what has been realized thus far. With this vision, we first develop a semi-analytical framework based on the boundary perturbation approach, where the patterns of surface charge and topography may be taken as arbitrary, with only one restrictive assumption that the ratio of the characteristic topographic feature size to its wavelength is small, whereas the magnitude of the surface charge remains unconstrained within the physical limits of the chosen EDL model. These considerations are further substantiated by executing fully coupled electromechanics and hydrodynamics simulations. We subsequently put forward illustrative examples where the various parameters may be exploited in tandem to deliberately deflect, reverse, augment and suppress EOF at will, without altering the direction of the applied electric field. These results are also shown to offer new insights into the interpretation of zeta potential measurement that remains a continuously debated topic in electrokinetics (Hunter Reference Hunter2013).
2. Theoretical formulation
We consider an electric field ( $\boldsymbol {E}_{ext}$) driving an incompressible electrolyte of viscosity $\mu$, relative permittivity $\epsilon _r$ and Debye length $1/\kappa$ over the charge-modulated corrugated topography (CMT). Here, $\kappa$ is termed the Debye-Hückel parameter. Figure 1(a) shows a periodically repeating unit of length $L$ of a representative topographical feature, which also has a periodically varying zeta potential. The zeta-potential distribution has the characteristic amplitude $\underline {\zeta }_{scale}$. For example, $\underline {\zeta }_{scale}$ could be half the difference between the maximum and minimum values of the spatially varying zeta potential, as considered for the illustrative scenarios exemplified herein. Here, and in similar instances in the article, the bar below a symbol indicates a dimensional variable, whereas the corresponding dimensionless counterpart is denoted by the same symbol without the underbar.

Figure 1. (a) One periodic cell of a charge-modulated topography (CMT) of length  $L$, and (b) a CMT with grooves oblique to the applied electric field direction $\xi$. The axis $\xi$ is inclined at an angle $\alpha$ to the direction of patterning ( $x$). The resultant far-field ( $\,y\rightarrow \infty$) electroosmotic velocity $\boldsymbol {U}_\infty$ is deflected from $\boldsymbol {E}$ by an angle $\delta$ (here, counter-clockwise).
We consider the characteristic small-scale feature size of the topography to be  $a$. The ratio of the same to the inverse of the wavenumber gives a dimensionless amplitude, ${\epsilon =2{\rm \pi} a/L}$. This parameter will be taken as small for any subsequent asymptotic analysis. If the fundamental (smallest) period of the charge modulation $L_\zeta$ and topography $L_h$ are different, the distance $L$ is to be evaluated as the least common multiple of $L_\zeta$ and $L_h$. Further, the asymptotic analyses will require that $a/L_\zeta =O(\epsilon )$ and $a/L_h=O(\epsilon )$.
Figure 1(b) shows a configuration that generalizes our chosen configuration with oblique grooves. Here,  $\boldsymbol {E}_{ext}$ is directed along $\xi$, and is inclined to the grooves which run along the $z$ direction. This configuration can be reduced through the tensorial mobility concept (Kamrin, Bazant & Stone Reference Kamrin, Bazant and Stone2010) into the solution of two canonical problems, where the electric field far away from the surface is either directed along the grooves (parallel flow) or across the grooves (perpendicular flow). In this section, both problems will be analysed separately after the distribution of charges common to both of them is calculated. The electrostatics within the EDL are analysed assuming the validity of Debye–Hückel linearization of the Poisson–Boltzmann equation, which is justified at electrostatic potentials comparable to or smaller than the thermal voltage (Hunter Reference Hunter2013).
Using the scale  $L/2{\rm \pi}$ for the distance, $\underline {\zeta }_{scale}$ for the equilibrium EDL potential and $E_{ext} L/2{\rm \pi}$ for the externally imposed voltage, the HS reference velocity reads: $U_{HS}=-\epsilon _r\epsilon _0\underline {\zeta }_{scale} E_{ext}/\mu$, where $\epsilon _0$ is the permittivity of the free space and $\epsilon _r$ is the dielectric constant of the solution. Taking $2{\rm \pi} \mu U_{HS}/L$ as a reference scale for the pressure, the equations governing the dimensionless fields of the EDL potential ( $\varphi$), voltage ( $V$) due to the externally applied field, velocity ( $\boldsymbol {U}$) and the pressure $p$ in excess over the equilibrium EDL pressure read (Hunter Reference Hunter2013)
 $$\begin{gather} \nabla^2 \varphi = k^2 \varphi, \end{gather}$$
 $$\begin{gather}\nabla^2 V = 0, \end{gather}$$
 $$\begin{gather}\nabla^2 \boldsymbol{U} = (\boldsymbol{\nabla} p) + (\nabla^{2} \varphi{\boldsymbol{\nabla} V}), \end{gather}$$
 $$\begin{gather}\boldsymbol{\nabla}\boldsymbol{\cdot}\boldsymbol{U}=0. \end{gather}$$
 In (2.1),  $k={\kappa L}/{2{\rm \pi} }$ is a dimensionless number signifying the characteristic EDL thickness to pattern period ratio. The (signed) dimensionless location of the topography measured from the metrological mean plane $y=0$ is expressed as $y=\epsilon h(x)$. The plane $y=0$ is so chosen that $\langle h(x) \rangle =0$. Here, $\langle \cdots \rangle =1/2{\rm \pi} \int _{-{\rm \pi} }^{\rm \pi} \cdots {{\rm d}\kern0.7pt x}$ is the spatial average of any quantity $\cdots$ over a dimensionless period ( $2{\rm \pi}$). The unit normal on any location within the topography is $\hat {n}$ and the local normal coordinate is $n$. Equation (2.1a) governs the electrostatic distribution of ions under the Debye–Hückel approximation and (2.1b) is a form of the principle of conservation of charge at steady state under the assumption of ohmic conduction. Equations (2.1c) and (2.1d) govern the steady incompressible body-force-driven viscous flow with vanishing inertial effects, as typical for microscale problems (Prakash & Conlisk Reference Prakash and Conlisk2016; Paratore et al. Reference Paratore, Boyko, Kaigala and Bercovici2019b).
For the boundary conditions, the quantities  $(\varphi -\zeta (x))$, ${\partial V}/{\partial n}$, $\boldsymbol {U}$ are set to zero on the corrugated surface, implying a prescription of the spatially variable zeta potential, zero current flux for an ohmic electrolyte through insulating walls and no slip as well as no penetration at the solid boundary. The external electric field $\boldsymbol {E}=-\boldsymbol {\nabla } V$ and the other dependent variables are $2{\rm \pi}$ periodic and remain bounded as $y\rightarrow \infty$. The boundary conditions are detailed in Appendices A and B. For the subsequent analysis following the boundary perturbation approach, it is assumed that the corrugated surface makes only small excursions from the mean plane of the topography. This implies that the dimensionless geometric feature size $\epsilon =2{\rm \pi} a/L$ is small. However, no asymptotic approximation is required regarding the nature of the surface charge variation.
In the following, the patterning functions  $h(x)$ and $\zeta (x)$ will be expanded in their respective complex Fourier series with $\zeta _n$ and $h_n$ denoting the complex Fourier coefficients. Note that $h_0=\langle h(x) \rangle =0$ is already ensured by the choice of the plane $y=0$ in figure 1 as the metrological mean plane (Whitehouse Reference Whitehouse2023).
2.1. The charge distribution in the electrolyte
The dimensionless local charge density in the electrolyte is given by  $-k^2\varphi$ under the Debye–Hückel approximation. The potential distribution governed by (2.1a) can be solved using an asymptotic expansion of the form $\varphi =\varphi _0+\epsilon \varphi _1 +O(\epsilon ^2)$, along with a boundary perturbation approach. The solution process is explained in detail in Appendix A. The final expression for $\varphi$, accurate up to first order of $\epsilon$ is
 \begin{equation} \varphi= \sum_n {\zeta_n \exp({-P_n y}) \,{\rm e}^{{\rm i} n x} } + \epsilon \sum_n{\exp{({-}P_n y)}\,{\rm e}^{{\rm i} n x} \sum_m{P_m \zeta_m h_{(n-m)}} }+O(\epsilon^2). \end{equation}
Here,  $P_n=\sqrt {k^2+n^2}$ and ${\rm i}=\sqrt {-1}$. In the preceding equation, and all equations to follow, the indexing variable of any summation ( $\varSigma$) indicated with a letter (here, $m$) below $\varSigma$ runs over integers from $-\infty$ to $\infty$ in steps of one, e.g. $\sum _m=\sum _{m=-\infty }^{\infty }$.
2.2. Parallel flow: the electric and flow fields
When an external electric field is applied along the groove-parallel  $z$-direction ( $\alpha ={\rm \pi} /2$ in figure 1b), the symmetries of the creeping flow problem implicate that the electric field is a constant and the flow is unidirectional. In terms of the dimensionless variables, $\boldsymbol {E}=\hat {k}$ and $\boldsymbol {u}=w(x,y)\hat {k}$, $\hat {k}$ being the unit vector along $z$. The electric body-force-driven Stokes equation (2.1c) for the parallel flow simplifies to $\nabla ^2 w = -\nabla ^2 \varphi$, which can be expressed as follows, using the auxiliary variable $\chi =w+\varphi$:
 \begin{equation} \nabla^2 \chi = 0. \end{equation}
 The wall boundary condition on  $\chi$ is the same as that for $\varphi$ if no slip is enforced on $w$. Far-field ( $\,y\rightarrow \infty$) boundedness is also imposed on $\chi$ in the same way as $\varphi$. This makes the problem for $\chi$ as the $k=0$ case of that for $\varphi$. As $w=\chi -\varphi$, it follows that
 \begin{equation} w ={-}\varphi +\sum_n{\zeta_n \exp{(-|n|y)} \,{\rm e}^{{\rm i} n x}} + \epsilon \sum_n{\exp{(-|n|y)} \,{\rm e}^{{\rm i} n x} \sum_m{|m| \zeta_m h_{n-m}} } +O(\epsilon^2), \end{equation}
where  $\varphi$ is calculated from (2.2).
2.3. Perpendicular flow: the electric field
Unlike in parallel flow, if an external electric field is applied along the  $x$-direction ( $\alpha =0$ in figure 1b), the electric field no longer remains uniform along the flow. Due to surface modulations in the field direction, the electric field lines are denser where the surface slopes upward and sparser where the surface slopes downward. This non-uniform electric field, in turn, affects the body forces on the fluid and the resultant fluid motion.
The potential can be decomposed as  $V=-x+\tilde {V}$ where the first term signifies the linear far-field component of $V$. The near-field part $\tilde {V}$ represented by the second term originates from the effects of the topography. The condition of no current conduction across the insulating surface leads to
 \begin{equation} \epsilon (1-\tilde{V}_x) h_x(x) + \tilde{V}_y = 0. \end{equation}
In (2.5) and subsequent numbered equations, the presence of an independent variable in the subscript indicates differentiation with respect to the variable; e.g.  $\varphi _y$ is the partial derivative of $\varphi (x,y)$ with respect to $y$,
$y$,  $h_x(x)$ is the $x$ derivative of the function $h(x)$ and so on. The following expansion for $V$ is obtained on solving (2.1b) with (2.5) for $\tilde V$
 \begin{equation} V={-}x+\epsilon \left(\sum_n {\mathrm{sgn}(n) {\rm i} h_n \,{\rm e}^{{\rm i} n x} \exp({-|n|y}})\right) + O(\epsilon^2). \end{equation}
Here,  $\mathrm {sgn}$ is the signum function, which is zero for $n=0$ and $n/| n |$ for other integers.
2.4. Perpendicular flow: velocity field
The flow perpendicular to the grooves is two-dimensional. Both the net charge density and the electric field driving the flow are spatially variable. Invoking a streamfunction  $\psi$, the governing equation can be expressed as (Datta & Choudhary Reference Datta and Choudhary2013)
 \begin{equation} \nabla^4 \psi = k^2 (\varphi_y V_x - \varphi_x V_y). \end{equation}
The two-term approximation  $\psi =\psi _0+\epsilon \psi _1+O(\epsilon ^2)$ can be described as follows:
 \begin{align} \psi_0 &= \sum_n {(C_{1n} + yC_{2n}) \exp({-|n|y}) \,{\rm e}^{{\rm i} n x}}+\sum_n {A_n \exp({-P_ny}) \,{\rm e}^{{\rm i} n x}}, \end{align}
 \begin{align} \psi_1 &= \sum_n {(D_{1n} + yD_{2n}) \exp({-|n|y}) \,{\rm e}^{{\rm i} n x}}+\sum_n {A_{1n} \exp({-P_ny}) \,{\rm e}^{{\rm i} n x}} \nonumber\\ &\quad + \sum_n {{\rm e}^{{\rm i} n x} \sum_m {A_{2nm} \exp({-(P_m+|n-m|)y})}}. \end{align}
The constants  $C_{1n}$, $C_{2n}$, $D_{1n}$, $D_{2n}$, $A_n$, $A_{1n}$ and $A_{2nm}$ are the coefficients given in Appendix B.
The first-order accurate formula for the streamwise velocity is given by
 \begin{equation} u = \psi_y = \psi_{0y} +\epsilon \psi_{1y} +O(\epsilon^2). \end{equation}
Henceforth, for conciseness, the order symbols will be dropped with the understanding that the subsequent analytical findings are  $O(\epsilon )$ accurate.
2.5. Bulk electroosmosis
Equations (2.4) and (2.10) provide the distribution of velocity in parallel and perpendicular flow, respectively. Notably, the  $y$-independent mode $n=0$ of either of these two equations furnishes a non-zero $O(\epsilon )$ correction to the far-field velocity, whereas all other modes decay exponentially with $y$. For flow parallel to the grooves, the far-field velocity can be found by setting $n=0$ in (2.4). With the observation that, for a real-valued topography function, $h_{(-m)}=h^{*}_{m}$, the far-field velocity for parallel flow is given by
 $$\begin{gather} w_\infty=\lim_{y\rightarrow \infty} {w} = \zeta_0+ \underbrace{\epsilon S_1}_{drift}, \end{gather}$$
 $$\begin{gather}S_1=\sum_m {|m| \zeta_m h^*_m}. \end{gather}$$
Here, and henceforth, the asterisk indicates complex conjugation. The meaning of ‘drift’ in the EOF outside the EDL, as interpreted in the current study, is concisely indicated in (2.11) through the brace placed under the corresponding (dimensionless) term that solely contributes to this phenomenon.
For flow perpendicular to the grooves, setting  $n=0$ in (2.10) evaluated using (2.8), and (2.9), the expression for $u_{\infty }$ becomes, after routine algebraic simplifications,
 $$\begin{gather} u_\infty=\lim_{y\rightarrow\infty} u=\zeta_0+ \underbrace{\epsilon (3S_1-S_2)}_{drift}=w_\infty +\epsilon(2 S_1-S_2), \end{gather}$$
 $$\begin{gather}S_2= 4 \sum_m \frac{ m^2 }{P_m+|m|}h_m \zeta_m^*. \end{gather}$$
Equations (2.11) and (2.12) are the generalized HS equations (in dimensionless form) that the current article set out to derive. It follows from (2.12a) that the ratio  $| u_\infty /w_\infty |$ of perpendicular-to-parallel-flow speed may be either larger or smaller than unity.
An alternative, albeit more compact way to express (2.11) and (2.12) is
 $$\begin{gather} \lim_{\epsilon\rightarrow 0}\frac{\partial (w_\infty/u_\infty)}{\partial\epsilon}=S \end{gather}$$
 $$\begin{gather}S=\sum_{m={-}\infty}^\infty K(| m |,k) h_m \zeta_m^*=2\sum_{m=1}^{\infty} K(| m |, k ){\rm Re}{(\zeta_m h_m^*)} \end{gather}$$
 \begin{gather} K(| m |,k) = \left\{\begin{array}{@{}lr} | m | & :|| \mbox{flow},\\ 3| m |-\dfrac{4 m^2}{\sqrt{m^2+k^2}+| m | } & :\perp \mbox{flow}. \end{array}\right. \end{gather}
 The terms with braces under them in (2.11) and (2.12) signify the electroosmotic ‘drift’ effect and are labelled accordingly. A positive value for either of these terms is termed ‘forward drift’, which will reinforce the electroosmosis over a net positive charged surface ( $\langle \zeta \rangle >0$). Similarly, a negative value for either of these terms is termed ‘reverse drift’, which will attenuate the electroosmosis over a net positive charged surface.
In (2.13), the symbols  $||$ and $\perp$ stand for parallel ( $w_\infty$) and perpendicular flow ( $u_\infty$), respectively, and ${\rm Re}$ denotes the real part of a complex number. Appendix C provides a derivation of the second equality in (2.13b). The leading $\epsilon$-independent term of (2.11) and (2.12) indicates that, if the surface is planar, the far-field effect of any periodic zeta-potential distribution $\zeta (x)$ is equivalent to that of its arithmetic mean $\zeta _0=({1}/{2{\rm \pi} })\int _{-{\rm \pi} }^{{\rm \pi} } \zeta (x) \,{{\rm d}\kern0.7pt x}$. The second term symbolizes the additional effect of the non-planar surface topography $\epsilon h(x)$ on the far field. Note that, as $h_0=0$, $\zeta _0=\langle \zeta (x)\rangle$ does not appear in the second term of either (2.11) or (2.12). Essentially, the spectral modes of the zeta-potential defect function $(\zeta (x)-\langle \zeta (x)\rangle )$ and the topographical pattern interplay to produce the additional drift symbolized by the second term. Note that this is an effect of the topography that persists outside the screening charge cloud or the EDL (when appreciable modulation in surface charge exists). This fact is emphasized by the use of the term ‘far field’ in the current article. Another term with similar import to the context at hand could be ‘long range’.
In case the coefficients  $h_m$ and $\zeta _m$ are such that the sum(s) in (2.13b) are divergent (Dewangan & Datta Reference Dewangan and Datta2020), the current perturbative analysis fails. One situation where this may happen is when both the charge and surface profiles have jump discontinuities, which leads to $O(1/n)$ decay of spectral coefficients (Canuto et al. Reference Canuto, Hussaini, Quarteroni and Thomas2012). Such a situation is symptomatic of a need for a different set of gauge functions than powers of $\epsilon$ (Asmolov et al. Reference Asmolov, Zhou, Schmid and Vinogradova2013).
Interestingly, in parallel flow (2.11) the far-field velocity has no explicit Debye-length dependence, which is not the case in perpendicular flow (2.12), due to the  $k$-dependence of $S_2$. It follows from the limiting form of (2.11b) and (2.12b) at small $k$ that $S_2$ approaches $2 S_1$. On the other hand, for large $k$,
$k$,  $S_2$ approaches $0$. The above results can be summarized as
 $$\begin{gather} u_{k\infty}\equiv\lim_{k\rightarrow \infty} u_\infty=\zeta_0+ 3\epsilon S_1=w_\infty +2\epsilon S_1 \quad \mbox{Thin\ EDL} \end{gather}$$
 $$\begin{gather}u_{k0}\equiv\lim_{k\rightarrow 0} u_\infty=\zeta_0+ \epsilon S_1=w_{\infty} \quad \mbox{Thick EDL}, \end{gather}$$
where the symbol  $\equiv$ stands for ‘is defined as’. Thus, only in perpendicular flow can the Debye length be used to veil at small $k$ (thick EDL) and unveil at large $k$ (thin EDL) the electroosmotic-motion-intensifying effects of the non-uniform external field calculated in § 2.3, while the electric field is uniform in parallel flow. The above $k$-dependent behaviour has an important consequence for the response of patterns aligned obliquely to the electric field (figure 1b), as discussed in § 3.3 later.
Comparing (2.11) with (2.14a), we obtain the strikingly universal finding that, for sufficiently thin EDLs, the change in the EOF due to surface topography is three times stronger in perpendicular flow than in parallel flow, regardless of the specific shape of the surface topography and the surface charge pattern.
Ajdari (Reference Ajdari1996), in its Section V, provides a rare theoretical analysis of the situation where charge variation and corrugation coexist on a channel wall. However, the pattern shapes in this study are restricted to  $2{\rm \pi} /q$-wavelength cosine waves (with the corrugation leading the charge modulation by a phase angle $\varPhi$). The patterning occurs on one wall of a plane channel of mean width $2 h$, the other wall of which is uncharged. The analysis of Ajdari (Reference Ajdari1996) is based on the thin EDL approximation, thus corresponding to the $k\rightarrow \infty$ limit of the current semi-infinite-electrolyte but finite-Debye-layer analysis, provided $q h$ is chosen to be large enough in Ajdari (Reference Ajdari1996) for the two walls to act independently. Reassuringly, the large $q h$ limits of the right-hand sides of the flow rate expressions (66) for parallel flow and (59) for perpendicular flow from Ajdari (Reference Ajdari1996), when divided by $h$ (as appropriate for the shear flow prevailing over most of the channel except small $O(1/q)$ recirculatory zones), give expressions identical to the dimensional counterparts of (2.11) and (2.14a), when the small parameter $\alpha$ of Ajdari (Reference Ajdari1996) is related to $\epsilon$ through $\epsilon =\alpha q h$, and the sum $S_1$ in (2.11b) is evaluated using the special values $\zeta _{n\neq 1}=h_{n\neq 1}=0$, $\zeta _1=\zeta _{-1}=1/2$, $h_1=h_{-1}=1/2\exp ({\rm i} \varPhi )$. A more elaborate discussion on this comparison is provided in Appendix F.
3. Results and discussion
Formally, the asymptotic predictions of § 2 are applicable to ‘sufficiently’ small values of  $\epsilon$, where the limiting smallness ensuring this condition remains to be numerically assessed. We assess this implication through numerical comparisons with an approach that is not formally restricted to small $\epsilon$. For such comparisons, the functions $\zeta (x)$ and $h(x)$ need to be given specific forms. These issues are addressed in § 3.1. As a by-product of this analysis, we obtain new closed-form analytical predictions for specific shape functions of the spatial modulation of charge and topography. Finally, §§ 3.2–3.5 discuss certain non-intuitive consequences of the interplay between topography and charge modulation, along with their possible practical significance.
3.1. Test problems: asymptotic theory vs numerical simulations
Due to their formal restriction to small values of  $\epsilon$, the analytical predictions of § 2 are assessed here against the numerical simulations not using this assumption. Towards this end, finite-element-method-based solutions of (2.1)) were obtained using the commercial software COMSOL Multiphysics ${\circledR}$. The methodological details of the simulations are discussed in Appendix D.
A CMT is defined through a combination of zeta potential and surface height distributions. Four different CMTs are used for the numerical comparisons. Except for the first (CMT I:  $\zeta (x)=h(x)=\cos (x)$), the remaining topography charge pattern combinations are shown in the left panels of figure 5 of Appendix E. The key findings on each topography are tabulated in table 1. Crucially, the third and fourth columns of the table report the analytically calculated rate of change of the far-field electroosmotic velocity with the dimensionless amplitude in transverse and longitudinal flow, respectively, as evident from (2.11), (2.12) and (2.13a). The $\zeta$-profile in each model profile has zero average ( $\zeta _0=\langle \zeta \rangle =0$), to enable convenient isolation of the effects of the interplay. Smooth surface and charge profiles, as well as non-smooth profiles with ‘jumps’ and ‘corners’, are chosen to impart generality into the analysis.
Table 1. The four CMTs for numerical comparisons with corresponding spectral-asymptotic results for evaluating (2.11) in parallel flow, and (2.12) in perpendicular flow. In the second and third rows,  $G=0.91596\cdots$ is the Catalan constant (OEIS 2021).

The first CMT (labelled CMT I) shows the continuous function  $\cos (x)$ for the surface and charge variation profile as an example of a continuously varying profile. In the second and third model problems (CMTs II and III), the charge is shown to vary discontinuously, assuming only two values $+1$ and $-1$. In CMT II, the surface has a triangular profile, whereas in CMT III the surface has trapezoidal variations. In the fourth model problem (CMT IV), the surface variation is taken as a sawtooth-shaped profile exhibiting a jump with a ‘cornered’ triangular charge profile (with odd symmetry) over it. Both profiles in CMT IV have odd symmetry, while all other CMTs have profiles with even symmetry.
The second and third columns of table 1 show the spectral coefficients required by (2.11) and (2.12) for the four CMTs. The third and fourth columns headers  $\lim _{\epsilon \rightarrow 0}({\partial w_\infty }/{\partial \epsilon })$ and $\lim _{\epsilon \rightarrow 0}({\partial u_\infty }/{\partial \epsilon })$ represent an alternative way to summarize the analytical prediction of (2.11) and (2.12) (see also (2.13)). Closed-form analytical predictions for the parallel flow problem based on (2.11) and the thin-Debye-layer limit transverse flow problem based on (2.14a) are consolidated in the third column utilizing a known mathematical constant (OEIS 2021) for the series sum $S_1$ for all except for the third model problem. For the third problem, the required series are summed numerically up to five decimal place accuracy. The effect of finite EDL thickness is shown graphically in the right-hand side panels of figure 5 (except for the cosine profile where an analytical result is reported in table 1. The curves in figure 5 utilize numerical series sums of the $k$-dependent series $S_2$.
Next, we make graphical comparisons between the numerical and asymptotic approaches. To understand the limit of applicability of the developed asymptotic theory, the largest  $\epsilon$ value is shown on all the twelve panels of figures 2 to 4 to correspond to approximately $5\,\%$ relative error between the numerical and analytically predicted values.

Figure 2. Comparison between analytical and numerical predictions on the amplitude dependence of the period-averaged electrostatic potential ( $\langle \varphi \rangle$) at $y=\epsilon$ for the four types of CMT shown in table 1 and the insets. Symbols are numerical data and the lines are theoretical predictions using (2.2). In the insets, the topography shape $h(x)$ is shown using blue solid lines and the zeta-potential distribution $\zeta (x)$ is shown using red dashed lines; (a) CMT I, (b) CMT II, (c) CMT III, (d) CMT IV.
The equilibrium electrostatic distribution of the ions is governed by the potential  $\varphi$, regardless of the orientation of the applied electric field with respect to the stripes. Figure 2 shows the arithmetic mean $\langle \varphi \rangle$ of the EDL electrostatic potential $\varphi$ at the level $y=\epsilon$ of the peaks. The $\langle \varphi \rangle$ values are calculated using (2.2) for $k=1$. The presence of topography makes a net uncharged surface (CMTs I–IV) appear charged (non-zero $\langle \varphi \rangle$) at the peak level ( $\,y=\epsilon$). This effect is encoded by the second term of (2.2); the pattern shapes interplay into it through the sum $S_\varphi =\sum _m P_m\zeta _m h^*_m$. Interestingly, for the topography and charge distribution with broadly coincident flat zones (CMT III), the asymptotic results are exceptionally accurate ( ${<}5\,\%$ accuracy up to $\epsilon \simeq 0.75$). Unlike the bulk electroosmotic velocities to be discussed in the remainder of the current subsection (§ 3.1), the period average $\langle \varphi \rangle$ on the plane touching the tips of the topography is a quantity calculated inside the EDL. Moreover, $\langle \varphi \rangle$ depends nonlinearly on $\epsilon$, unlike the far-field velocity corrections.
Figures 3 to 4 pertain to the electroosmotic drift effect. These figures compare the far-field electroosmotic velocity from the fully resolved finite element simulations with the asymptotic predictions based on the third and fourth columns of table 1 (2.11) and (2.12) for parallel and transverse flows, respectively. Each panel of figure 4 reveals that, in the thin-EDL limit ( $k\rightarrow \infty$), where the EDL adheres to the topography, the bulk fluid motion is stronger than when the EDL is thick ( $k=1$). This observation is consistent with the last column of table 1 and the right-hand side panels of figure 5.

Figure 3. Comparison between analytical and numerical predictions on the amplitude dependence of the magnitude of the far-field electroosmotic velocity  $w_\infty$ in parallel flow configuration for the four types of CMT shown in table 1 and the insets. Symbols correspond to the numerical data, and the lines are theoretical predictions using (2.11). In the insets, the topography shape $h(x)$ is shown using blue solid lines, and the zeta-potential distribution $\zeta (x)$ is shown using red dashed lines; (a) CMT I, (b) CMT II, (c) CMT III, (d) CMT IV.

Figure 4. Comparison between analytical and numerical predictions on the amplitude dependence of the far-field electroosmotic velocity  $u_\infty$ for $k= \infty$ and $k = 1$ in perpendicular flow configuration for the four types of CMT shown in table 1 and the insets. Symbols are numerical data and the lines are theoretical predictions using (2.12). In the insets, the topography shape $h(x)$ is shown using blue solid lines and the zeta-potential distribution $\zeta (x)$ is shown using red dashed lines; (a) CMT I, (b) CMT II, (c) CMT III, (d) CMT IV.

Figure 5. Dependence of topographical correction ( ${\partial u_\infty }/{\partial \epsilon }$) to the far-field electro-osmosis on the dimensionless Debye–Hückel parameter $k$ table 1. In all three left-hand side panels, dotted lines indicate the surface charge profiles (a) CMT II sketch, (b) CMT II $k$ dependence, (c) CMT III sketch, (d) CMT III $k$ dependence, (e) CMT IV sketch, (f) CMT IV $k$ dependence.
The comparison between numerical and asymptotic predictions in figures 3 to 4 suggests that analytical predictions remain accurate up to larger  $\epsilon$ values (a) for parallel flow compared with perpendicular flow, (b) in perpendicular flow, for thick (small $k$, e.g. $k=1$) compared with thin EDLs (e.g. $k=\infty$). Finally, it can be noticed that (c) the analytical predictions remain accurate up to larger $\epsilon$ values for a CMT where the jumps/corners of one profile (say $\zeta (x)$) are substantially staggered from regions of appreciable spatial variations in the other profile (say $h(x)$), in comparison with a CMT where the jumps/corners are closer to each other (CMTs II and IV).
3.2. Interplay of the patterning functions
Careful observation of the spectral coefficients in (2.11), (2.12) and (2.13) allows us to draw several inferences on the interplaying influence of the charge patterning and topography shape functions and even formulate design principles on them. The following subsection describes a few important characteristics of the interplay and the relevant design of the patterns. Some of the inferences below, especially those employing the phase of the spectral coefficients, are more directly evident from (C6) derived in Appendix C.
3.2.1. Counter-intuitive electrokinetic motion
It is well accepted for mechanically (shear/pressure) driven flows over wetted (Kamrin et al. Reference Kamrin, Bazant and Stone2010; Dewangan & Datta Reference Dewangan and Datta2020) and superhydrophobic substrates (Asmolov et al. Reference Asmolov, Zhou, Schmid and Vinogradova2013; Song, Daniello & Rothstein Reference Song, Daniello and Rothstein2014; Yariv Reference Yariv2023) and constant surface-charge EOFs (Messinger & Squires Reference Messinger and Squires2010; Goyal & Datta Reference Goyal and Datta2022) that the flow along groove-shaped topographic undulation is faster when directed along rather than across the undulation. However, (2.11) and (2.12) suggest that the engineered or incidental presence of surface charge variations would render the above assertion invalid. Depending on the shapes of the distributions  $h(x)$ and $\zeta (x)$, the second term of (2.11) and (2.12) may be additive or subtractive. Essentially, it is the sign of charges on the peaks of the topographies rather than the sign of the average charge that is instrumental in choosing the direction of the bulk electroosmotic correction (second) terms in (2.11) and (2.12). On a net positively charged CMT ( $\zeta _0>0$), locating negative charges preferentially near the peaks would tend to make electro-osmosis due to an electric field aligned parallel ( $\alpha ={\rm \pi} /2$ in figure 1b) to the corrugations faster than that due to an electric field aligned perpendicular ( $\alpha =0$) to the corrugations, while positively charged peak regions would have the opposite effect. If $h(x)$ and $\zeta (x)$ could be appropriately engineered, the ‘fast direction’ can, in principle, be chosen to cater to contrasting needs of deflecting the bulk EOF either toward (counter-clockwise from the $\xi$ axis in figure 1b) or away from (clockwise) the patterning direction $x$.
$x$.
Because of this freedom to choose the fast direction, as discussed later in § 3.3, the flow can be deflected either toward the patterning direction  $x$ in figure 1(b) or away from $x$, relative to an electric field oriented obliquely to the pattern, e.g. in microfluidic chamber configuration (Boyko et al. Reference Boyko, Rubin, Gat and Bercovici2015). This provides an unprecedented ability to steer microfluidic flows, which may be valuable for applications such as pumping, cloaking (Boyko et al. Reference Boyko, Bacheva, Eigenbrod, Paratore, Gat, Hardt and Bercovici2021), separation and mixing.
A related counter-intuitive situation may arise when the effect described by the second term in (2.11)/(2.12) becomes comparable to or even larger than the net electroosmosis due to the mean charge described by the corresponding first term. Then, flow may occur from the positive electrode to the negative one even over a net positively charged surface, in exception to the anticipation based on the electrokinetic theory over flat interfaces. Extending the above to the conjugate electrokinetic phenomenon of electrophoresis of a heterogeneously charged (Bianchi et al. Reference Bianchi, Capone, Coluzza, Rovigatti and van Oostrum2017) particle which is nearly flat on the scale of the size and pitch of the topographic undulations (Hunter Reference Hunter2013), a carefully charge-patterned negatively charged particle may be counter-intuitively attracted toward the negative electrode.
3.2.2. Embossed replica vs its master nanostructure
If  $h(x)$ is flipped with a possible vertical shift, which may be implemented in practice by embossing a pattern through soft lithography (Qin et al. Reference Qin, Xia and Whitesides2010; Faustino et al. Reference Faustino, Catarino, Lima and Minas2016), the far-field electroosmotic drift (signified by the expression after the second equality in (2.13b)) will change its sign, since the spectral coefficients $h_m$ ( $m\neq 1$) also change sign through the embossing operation.
3.2.3. Odd–even symmetry
If  $h(x)$ and $\zeta (x)$ are functions of opposite parity (odd/even), no far-field electroosmotic drift occurs. As an odd pattern has purely imaginary complex Fourier coefficients, this conclusion follows from (2.13b). Choosing both patterns as even or both as odd gives the drift of maximum magnitude. This conclusion can be based on (C6).
3.2.4. Differential principles for the design of patterns
If one of the two patterning functions is shaped as (a linear combination of) odd-order (first, third, etc.) derivatives of the other, no bulk electroosmotic drift occurs. Conversely, if one of the two patterning functions is shaped as (a linear combination of) the function and its even derivatives, the electroosmotic drift magnitude is at its maximum. The finding does not depend on the odd–even parity of the function and essentially arises from the Fourier coefficient of the first derivative of a function being  $i=\sqrt {-1}$ times the original Fourier coefficients and so on.
3.2.5. Phase-shifted patterns
If  $h(x)$ is phase shifted by an angle $\theta$, considering patterning functions that are related by an affine transformation given by $\zeta (x)-\zeta _0=A h(x+\theta )$ with $A>0$, the argument of the sum in (2.13b) becomes $2 | h_m|^2\cos {(n\theta )}/A$ and it follows that:
(i) the maximum forward electroosmosis results when there is no phase-mismatch ( $\theta =0$);
(ii) with the additional restriction of anti-periodic or half-wave symmetric waveforms, which satisfy
$h(x)=-h(x+{\rm \pi} )$ by definition (Stade Reference Stade2011), in-phase patterns($\theta =0$) maximize forward electroosmotic drift, anti-phase ($\theta ={\rm \pi}$) patterns maximize the reverse electroosmotic drift and a phase shift of ${\rm \pi} /2$ results in zero electroosmotic drift. The anti-periodicity restriction ensures only the odd Fourier harmonics contribute to the shape of $h(x)$.


A phase shift can be related to the (mis-)alignment of patterns during fabrication (Feuillebois, Bazant & Vinogradova Reference Feuillebois, Bazant and Vinogradova2010).
3.2.6. Using the phase spectrum of $h(x)$ and $\zeta (x)$


A more general set of inferences that does not involve the restriction  $\zeta (x)-\zeta _0=A h(x+\theta )$ used in § 3.2.5 can be drawn from (C6) from Appendix C. If the pattern shapes are not restricted to be geometrically similar, designing patterns with identical phase spectra (Canuto et al. Reference Canuto, Hussaini, Quarteroni and Thomas2012) ( $\angle h_n=\angle \zeta _n$, where $\angle$ denotes the principal value of the argument of the corresponding complex Fourier coefficient), would result in the maximum forward electroosmotic drift. In real variables, pattern waveforms with identical phase spectra mean $\theta _n=\phi _n$ in $\zeta (x)=\sum _{n\ge 0} P_n\cos (n x+\theta _n)$ and $h(x)=\sum _{n\ge 0} Q_n\cos (n x+\phi _n)$, where $P_n$ and $Q_n$ are real numbers, and $\theta _n$ and $\phi _n$ can be restricted to $(-{\rm \pi},{\rm \pi} ]$. So, for maximum forward electroosmosis, distortions arising from phase mismatch of waveforms should be avoided. On the other hand, $\theta _n$ differing from $\phi _n$ by $-3{\rm \pi} /2,-{\rm \pi} /2,{\rm \pi} /2$ and $3{\rm \pi} /2$ will lead to the absence of electroosmotic drift. The maximum reverse drift is obtained from $\theta _n=\phi _n\pm {\rm \pi}$. Thus, appropriate design of the phases of the two types of surface topographic patterns can cause ‘constructive’ and ‘destructive’ (no-drift) interferences in analogy with optical (and acoustic) interferometry. As a generalization of a more restrictive finding discussed in § C, (C6) can also be used to infer that a change in the physical alignment of either $\zeta (x)$ or $h(x)$ by half a wavelength (shifting $x$ by ${\rm \pi}$) will reverse the direction of the far-field electro-osmotic drift, provided one of the two patterns is synthesized from odd harmonics.
Before moving in the next section (§ 3.3) to oblique stripes from aligned stripes, we re-emphasize a few characteristics of the charge–topography interplay. The identities of  $h(x)$ and $\zeta (x)$ have no bearing on the above six observations because of the symmetry of the sums $S_1$ and $S_2$ in (2.11) and (2.12). Further, it can be expected that the direction of electroosmosis when a weak (or zero) net charge resides on a mildly corrugated surface may even be opposite to that apparent from its weak net charge since the second term of (2.12) can admit a reverse electroosmotic drift, as discussed above. In a similar vein, during electrophoresis, a positive but weakly charged particle can drift opposite to the electric field, provided that it has a radius that is large compared with both the Debye length and the pattern pitch. The last two restrictions are needed to ensure that electroosmosis and electrophoresis are truly conjugate effects (Hunter Reference Hunter2013).
Messinger and Squires (Messinger & Squires Reference Messinger and Squires2010) reported that, at large Dukhin numbers where surface conduction by ions in the Debye and Stern layer is predominant, the bulk electroosmosis is suppressed by the roughness on a constant-charge surface, while this effect disappears as the Dukhin number is lowered. Electroosmotic-flow suppression on a uniformly charged surface by roughness elements was also reported (Lei et al. Reference Lei, Chen, Chang and Wang2017; Goyal & Datta Reference Goyal and Datta2022) in the small-Dukhin-number regime. Here, it is shown that, in the small-Dukhin-number regime, if an appropriate charge modulation is present on the rough surface, the bulk EOF may also be augmented on purpose. Although left out of the scope of the current study, it can be speculated that these two effects may compete when moderate values of Dukhin numbers are considered.
3.3. Anisotropic response of oblique grooves
If the external field is oblique to the groove direction, the electroosmosis in the far field ( $\,y\rightarrow \infty$) will be anisotropic and a tensorial formalism for the mobility (Bahga, Vinogradova & Bazant Reference Bahga, Vinogradova and Bazant2010; Feuillebois et al. Reference Feuillebois, Bazant and Vinogradova2010; Kamrin et al. Reference Kamrin, Bazant and Stone2010; Fan & Bandaru Reference Fan and Bandaru2019) may be used. Let $\mathcal {A}=u_\infty /w_\infty$ be the ratio of the far-field transverse and longitudinal flow velocity. In what follows, we consider only positive values of $\mathcal {A}$ to be of plausible physical interest, though (2.11) and (2.12) do not prohibit the situation of $\mathcal {A}<0$ wherein the mobilities along and across the grooves are oppositely directed. Referring to the geometry of figure 1(b), for an electric field applied along the oblique axis $O\hat {\xi }$, the flow outside the EDL is deflected by an angle $\delta$ from $O\hat {\xi }$. It can be inferred through a rotation of co-ordinates (Bahga et al. Reference Bahga, Vinogradova and Bazant2010; Feuillebois et al. Reference Feuillebois, Bazant and Vinogradova2010; Kamrin et al. Reference Kamrin, Bazant and Stone2010), that, (a) the deflection is given by $\delta =\tan ^{-1}{[{(1-\mathcal {A})\sin \alpha \cos \alpha }/{(\sin ^2\alpha +\mathcal {A}\cos ^2\alpha )}]}$, and (b) that (Feuillebois et al. Reference Feuillebois, Bazant and Vinogradova2010) the maximum deflection $\delta _{max}=\tan ^{-1}\frac {1}{2}(\sqrt {\mathcal {A}}-{1}/{\sqrt {\mathcal {A}}})$ will be observed, when the grooves are inclined at $\alpha =\mbox {tan}^{-1} ({1}/{\sqrt {\mathcal {A}}})$.
Importantly, the ratio  $\mathcal {A}$ can either be greater (faster mobility along the grooves) or less than unity (faster mobility across the grooves), depending on the sign of $(2S_1-S_2)$, as evident from the last equality in (2.12). Then, it follows from the relations given in the previous paragraph that both clockwise ( $\delta <0$) and anti-clockwise ( $\delta >0$ as depicted in figure 1b) deflections are possible. Similar flow situations over topographies reported in the literature would afford only a one-sided deflection toward the ‘fast direction’ (along the grooves), as previously exemplified over superhydrophobic surfaces (Feuillebois et al. Reference Feuillebois, Bazant and Vinogradova2010), wetted (Wenzel-state) (Dewangan & Datta Reference Dewangan and Datta2020) and constant-charge electroosmosis supporting topographies (Goyal & Datta Reference Goyal and Datta2022).
Since  $\mathcal {A}$ is $k$-dependent, the ionic strength ( $I$) of the solution offers one more modality to control the deflection $\delta$. This is because $k \propto 1/\lambda _D\propto \sqrt {I}$. The ionic strength ( $I$) is altered by increasing or decreasing the concentration of salt(s) dissolved in the aqueous electrolyte. For example, from (2.14), it can be inferred that the grooves behave isotropically ( $\delta =0$) at infinite dilution ( $k\rightarrow 0$), whereas for the higher salt content, the electroosmotic flow gets more deflected from the electric field direction.
In the situation of a surface patterned to have zero average zeta potential ( $\zeta _0=0$) and with a thin EDL over the same, it can be concluded from (2.11) and (2.12), that $1=\mathcal {\mathcal {A}}(0)<\mathcal {A}(k)<3=\mathcal {A}(\infty )$. In this case, the optimum angle between the grooves and the external field is $\theta ={\rm \pi} /6=30^\circ$, which would result in a $30^\circ$ flow deflection. Aside from intentional patterning, the zero (or weak) average zeta potential could be reminiscent of an incidentally non-uniform application of electroosmotic-flow suppressive coating (Bahga et al. Reference Bahga, Vinogradova and Bazant2010).
The anisotropic and Debye-length-dependent flow response may be potentially leveraged for mixing, flow control (Stroock & Whitesides Reference Stroock and Whitesides2003), portable electroosmotic pumping (Gitlin et al. Reference Gitlin, Stroock, Whitesides and Ajdari2003) and separations (Asmolov et al. Reference Asmolov, Dubov, Nizkaya, Kuehne and Vinogradova2015; Dubov et al. Reference Dubov, Molotilin and Vinogradova2017; Goyal & Datta Reference Goyal and Datta2022). It can be mentioned here that reported experimental demonstrations involving the use of flow (pressure-driven/electroosmotic) over a topography alone to augment microfluidic mixing and pumping (Gitlin et al. Reference Gitlin, Stroock, Whitesides and Ajdari2003; Stroock & Whitesides Reference Stroock and Whitesides2003; Jain & Nandakumar Reference Jain and Nandakumar2013) exploit an effect that is less sensitive to the pattern amplitude (being  $O(\epsilon ^2)$) than the $O(\epsilon )$ effect discussed herein. The $O(\epsilon )$ scaling can therefore be considered an attractive feature to approach the practical need if other constraints of realizing CMTs can be overcome.
3.4. Tuneable electrokinetics
The discussion in §§ 3.2 and 3.3 clearly provides us with four important handles to intentionally control the direction and magnitude of EOF through topography, namely the shapes of the topography  $h(x)$ and charge modulation $\zeta (x)$, the angle $\alpha$ between the grooves and the electric field (figure 1b) and the ionic composition of the solution through the ionic strength $I$. For example, independent control on the functions $h(x)$ and $\zeta (x)$ (surface topography and surface patterning) with grooves oriented either along or across the external electric field should be capable of achieving design objectives such as bulk flow reversal, augmentation and reduction, perhaps even creating counter-intuitive scenarios. In addition, the feature size and pitch of the topographical features (affecting $k$ and $\epsilon$) are more obvious control parameters.
Deflecting flows, and therefore particle trajectories for separation applications (Asmolov et al. Reference Asmolov, Dubov, Nizkaya, Kuehne and Vinogradova2015), requires the grooves to be oblique to the electric field ( $\alpha \neq 0/{\rm \pi} /2$). As discussed in § 3.3, the flow may be deflected by choosing the parameter $\mathcal {A}$ through the two patterning functions and the pattern-averaged value of the zeta potential. Uniquely, the flow can be steered either toward the patterning direction $x$ (
$x$ ( $\delta >0$ as depicted in figure 1b) or away ( $\delta <0$) from $x$ in the $x$–
$x$– $z$ plane of figure 1(b), depending on whether the fastest or slowest electroosmosis occurs when $\alpha ={\rm \pi} /2$ or $\alpha =0$. The deflection is further tuneable using the ionic strength $I$ of the solution. It is possible to realize these effects for the conjugate electrokinetic phenomenon of electrophoresis as well.
3.5. Interpreting the zeta-potential estimations
Measurement of the zeta potential ( $\underline {\zeta }_{meas}$) is among the most important electrochemical characterizations of a substrate in microfluidics, separation science, geochemistry and allied areas. Several common zeta-potential estimation methods are based on a direct/indirect measurement of the far-field flow velocity and corroborating the same with the traditional HS ‘slip velocity formula’. These experimental approaches include the current monitoring method and methods based on the transit time of a neutral tracer moving with the flow (Kirby & Hasselbrink Reference Kirby and Hasselbrink2004; Hartkamp et al. Reference Hartkamp, Biance, Fu, Dufrêche, Bonhomme and Joly2018). The inferred zeta potential from the HS equation is given by $\underline {\zeta }_{meas}=-({\mu U_{HS}}/{\epsilon _r\epsilon _0 E_{ext}})$, where $U_{HS}$ is flow speed outside the EDL as inferred from the measurements when the electrolyte is subject to an electric field strength $E_{ext}$. When the surface is topographically flat, $\underline {\zeta }_{meas}$ corresponds to its period ( $L$)-averaged value (Anderson & Idol Reference Anderson and Idol1985; Kirby & Hasselbrink Reference Kirby and Hasselbrink2004). This period-averaged value is the dimensional counterpart of $\langle \zeta \rangle$, which, for example, appears as the first term in (2.12) for transverse flow.
The analysis of § 2 suggests that  $\underline {\zeta }_{meas}$ may become extraneously influenced by the inevitable unevenness of the surface topography, as represented by the second $\epsilon$-dependent terms of (2.11) and (2.12). Therefore, on topographically uneven surfaces, $\underline {\zeta }_{meas}$ may not represent an intrinsic electrochemical characterization. For example, if the grooves are oriented transverse to the applied electric field, the prediction for $\underline {\zeta }_{meas}$ should rather be based on (2.12) and not by following the classical HS equation. Following the normalization scheme followed in our work, this prediction reads: $\underline {\zeta }_{meas}={u}_\infty \underline {\zeta }_{scale}$, where $u_\infty$ is given by (2.12). For flow along the grooves, $w_\infty$ calculated by using (2.11) should replace $u_\infty$. If the stripes are oblique, a corresponding tensorial equation will follow from § 3.3.
To elucidate the quantitative implications of the above consideration, we consider one representative illustrative example. Consider CMT II (square-wave zeta potential on a triangular wave topography or vice versa), as shown in figure 4(b) for perpendicular flow and infinitely thin Debye layers ( $k\rightarrow \infty$), to describe the distribution of the zeta-potential defect function ( $\zeta -\langle \zeta \rangle$) and the topography. The only difference from figure 4(b) in this example is a possibly non-zero pitch average for the zeta-potential distribution. Let the range of local spatial variations in zeta potential be $20\,\mbox {mV}$, so that its scale becomes $\underline {\zeta }_{scale}=10\,\mbox {mV}$. Then, from (2.14a) and table 1, an excess zeta potential can be predicted: $48\underline {\zeta }_{scale}/{\rm \pi} ^2(a/L)G$, where $G$ is the Catalan constant. This measure is in excess of the period-averaged dimensionless zeta potential $\langle \underline {\zeta }\rangle$ of the surface. On a periodic topography of amplitude $a=1\,\mathrm {\mu } \mathrm {m}$ and pitch $L=18\,\mathrm {\mu }\mathrm {m}$, $\epsilon =2{\rm \pi} a/L=0.35$. Thus, the charge–topography interplay results in an elevation in the effective zeta potential to the tune of $0.5\underline {\zeta }_{scale}=5\,\mathrm {mV}$ over and above the period-averaged value expected on a flat surface (Anderson & Idol Reference Anderson and Idol1985; Kirby & Hasselbrink Reference Kirby and Hasselbrink2004). The value $48\underline {\zeta }_{scale}/{\rm \pi} ^2(a/L)G\sim 0.5$ can also be read out from figure 4(b).
Therefore, it is not far fetched to hypothesize that the interplay of incidental variations in surface topography and surface charge remains an unacknowledged contaminating factor in the experimental estimations (Kirby & Hasselbrink Reference Kirby and Hasselbrink2004; Hartkamp et al. Reference Hartkamp, Biance, Fu, Dufrêche, Bonhomme and Joly2018) of the zeta potential. Similar inferences can be drawn on the streaming potential and streaming current measurements (Kirby & Hasselbrink Reference Kirby and Hasselbrink2004), necessitating appropriate corrections to their estimations.
The example of CMT II can also be used to demonstrate the numerical implications of the special forms of  $\zeta (x)$ and $h(x)$, as discussed in § 3.2. For example, an embossed replica of the topography will register a reduction of $5\,\mathrm {mV}$ in its zeta-potential estimation. Also, misalignment between the two waveforms in the half-wave symmetric (anti-periodic) CMT II can result in 5 mV fluctuation in $\underline {\zeta }_{mess}$ on either side of $\langle \underline {\zeta }\rangle$.
4. Conclusions
We showed how the bulk EOF over a charged interface may be selectively manipulated by the interplay of a patterned unevenness of the surface charge and surface topography. To resolve the effect analytically, we adopted the boundary perturbation approach with spectral representation of the spatial shapes. While the amplitude of the surface roughness was considered to be small as compared with its pattern wavelength, the theory required no restrictions on the surface-charge limits. We showed that the resulting electrostatic–hydrodynamic interactions may result in selective augmentation, attenuation, complete suppression of the bulk electroosmosis and even its direction reversal altogether. These findings are distinct from the previous reports on electroosmosis over corrugated surfaces that predicted a trivial suppression of the flow due to the roughness effects alone (Messinger & Squires Reference Messinger and Squires2010; Lei et al. Reference Lei, Chen, Chang and Wang2017; Goyal & Datta Reference Goyal and Datta2022). When the ratio of the characteristic EDL thickness and the surface profile waviness is small, we found that a threefold augmentation of EOF results from the application of an electric field perpendicular to the topographic features compared with parallel to them, universally across all plausible surface topography variations in a periodic pattern.
In addition to the obvious roles of the feature size and wavelength of the surface topography, our analytical results further brought out the role of four distinct design parameters, namely, the shape of the surface topography, the shape of the charge modulation function, the obliqueness of the stripes with respect to the electric field and the concentration(s) of the salts in the electrolyte, which could potentially be leveraged in tandem to preferentially steer, augment, reverse and suppress the bulk EOF. As a particular scenario, the electroosmotic drift with respect to the base flow could be completely nullified if one of the patterns featured a different odd/even parity with respect to the other. Also, among surface-charge and topographic modulation functions synthesizable from the odd harmonics, anti-phase and in-phase patterns were shown to produce the largest (but oppositely signed) alterations to bulk electroosmosis, whereas phase lag/lead by right angle could make the electroosmotic drift completely disappear. Our analyses revealed that non-uniformly charged topographies in EOF, unlike their mechanically driven (Kamrin et al. Reference Kamrin, Bazant and Stone2010; Yariv Reference Yariv2023) and uniformly charged counterparts (Goyal & Datta Reference Goyal and Datta2022), do not possess any geometrically pre-determined direction for faster viscous permeation; rather, the patterning functions can be engineered appropriately to select the ‘fast direction’.
We confronted the central outcomes from our semi-analytical theory with full-scale numerical predictions and confirmed that these results agreed well for small grooves except for minor variations when the regions of strong charge variation (such as jumps and corners) are located close to the corners of the topography. Generalizing further forward, these results should also apply to the electrophoresis of particles whose radii are large compared to the EDL thickness and the pattern wavelength of the surface topography. Further, when the surface modulations are not externally imposed but rather inevitable practical artefacts, our results could offer explanations for the possible contamination of the currently available experimental data on zeta potentials by appealing to the specific contribution stemming from the interplay between topographic and surface charge inhomogeneities. Although left out of the scope of the current work, it will be of additional interest to probe how the other important length scales of a microfluidic device, such as the microchannel depth, interplay with the electrokinetic problems addressed in our work, which may be considered in future investigations.
Funding
This work was supported by CSIR-HRDG (S.D., grant no. CSIR-HRDG 22 (0854)/20/EMR-II) and J.C. Bose National Fellowship, SERB, Ministry of Science and Technology, Government of India (S.C.).
Declaration of interests
The authors report no conflict of interest.
Appendix A. Boundary conditions and solution for $\varphi$

The potential at the wall ( $\,y=\epsilon h(x)$) is given by zeta potential $( \zeta (x)=\sum {\zeta _n \exp {( {\rm i} n x )} })$. First, the boundary condition is expanded using its Taylor series about $(\kern0.7pt y=0)$ as shown below
 \begin{equation} \varphi(x,0+\epsilon h(x)) = \varphi(x,0)+\epsilon h \varphi_y(x,0) +O(\epsilon^2). \end{equation}
Substituting the above expansion and collecting terms with the same power of  $\epsilon$, the boundary conditions for $\varphi _0$ and $\varphi _1$ are obtained. At the leading order, the boundary condition at $y=0$ will be
 \begin{equation} \varphi_0(x,0)=\zeta(x) .\end{equation}
The boundary condition for the first-order correction  $\varphi _1$ at $y=0$ is
 \begin{equation} \varphi_1 (x,0)+h(x)\varphi_{0,y}(x,0)=0 ,\end{equation}
and, at infinity, the gradient of the potential will approach zero. In this paper, the solution for the potential and other variables is obtained only up to the first order of  $\epsilon$, and terms beyond the first order are neglected.
Leading-order solution ( $O( \epsilon ^0 )$): the leading-order problem corresponds to one of charge varying over a flat plate, for which governing equation can be written as
 \begin{equation} \varphi_{0xx}+\varphi_{0yy}=k^2\varphi_0. \end{equation}
In the above equation and hereafter, differentiations with respect to  $x$ and $y$ are indicated through appropriate subscripts. The above equation subject to boundedness at infinity and the boundary condition (A2) has the solution
 \begin{equation} \varphi_0= \sum_{n={-}\infty}^{n=\infty}{\zeta_n \exp({-P_ny})\,{\rm e}^{{\rm i} n x}} ,\end{equation}
with  $P_n=\sqrt {n^2+k^2}$
First-order solution ( $O( \epsilon ^1)$): the governing equation for the first-order problem can be obtained as
 \begin{equation} \varphi_{1xx}+\varphi_{1yy}=k^2\varphi_1 .\end{equation}
The application of the boundary condition (A3) proceeds as follows:
 \begin{align} & \left.\left(\sum_{n={-}\infty}^{n=\infty}{C_{1n} \exp({-P_ny})\,{\rm e}^{{\rm i} n x}}\right)\right|_{y=0}\nonumber\\ &\quad +\sum_{n={-}\infty}^{n=\infty}{(h_n \,{\rm e}^{{\rm i} n x})} \left.\left(\sum_{n={-}\infty}^{n=\infty}{-P_n \zeta_n \exp({-P_ny})\,{\rm e}^{{\rm i} n x}}\right)\right|_{y=0}=0 .\end{align}
The product of infinite sums appearing in the second term can be replaced by their convolution (Cauchy product). It can be noted that the inner summation over  $m$ must be convergent for physically meaningful results from convolution
 \begin{equation} \sum_{n={-}\infty}^{n=\infty}{C_{1n} \,{\rm e}^{{\rm i} n x}} + \sum_{n={-}\infty}^{n=\infty}{{\rm e}^{{\rm i} n x} \sum_{m={-}\infty}^{m=\infty}{-P_m \zeta_m h_{(n-m)}} }=0. \end{equation}
On comparing coefficients in the above equation,  $C_{1n}$ will be obtained as $\sum _{m=-\infty }^{m=\infty }{P_m \zeta _m h_{n-m}}$, which, on substituting, gives the solution for $\varphi _1$ as
 \begin{equation} \varphi_1= \sum_{n={-}\infty}^{n=\infty}{\exp{({-}P_n y)}\,{\rm e}^{{\rm i} n x} \sum_{m={-}\infty}^{m=\infty}{P_m \zeta_m h_{(n-m)}}} .\end{equation}
 \begin{equation} \varphi= \sum_n {\zeta_n \exp({-P_n y})\,{\rm e}^{{\rm i} n x}} + \epsilon \sum_{n={-}\infty}^{n=\infty}{\exp({-P_n y})\,{\rm e}^{{\rm i} n x} \sum_{m={-}\infty}^{m=\infty}{P_m \zeta_m h_{(n-m)}} }+O(\epsilon^2) .\end{equation}
Appendix B. Perpendicular flow: boundary conditions and solution
B.1. Governing equations and boundary conditions for $\psi _0$ and $\psi _1$


The governing equation for fluid flow in the perpendicular direction is given by (2.7), with the boundary condition being a diminishing velocity gradient at infinity and no-slip boundary condition at the wall. Moreover, being a solid boundary, the wall is a streamline, therefore  $\psi =0$ can be used on the wall. The boundary condition on the wall can be represented as
 $$\begin{gather} \psi |_{y=\epsilon h(x)} =0 \quad (\text{Streamfunction value at wall}) \end{gather}$$
 $$\begin{gather}\psi_y|_{y=\epsilon h(x)} =0 \quad (\text{No-slip condition}) . \end{gather}$$
Substituting  $\varphi$ and $V$ from (2.2) and (2.6) in above equation and expanding $\psi$ in the form of an asymptotic perturbation series up to the first order of $\epsilon$, the equation can be rewritten for various orders of controlling parameter $\epsilon$ as
 \begin{gather} \nabla^4 \psi_0 = k^2 \sum_{n={-}\infty}^{n=\infty} {P_n \zeta _ n \,{\rm e}^{{\rm i}nx} \exp({-P_ny})} ,\end{gather}
 \begin{gather}\begin{aligned} \nabla^4 \psi_1 &= k^2 \left[\sum_n {{\rm e}^{{\rm i}nx}{\sum_m {P_m \zeta _m (n-m)^2 h_{(n-m)} \exp({-(P_m+|n-m|)y})}}} \right.\nonumber\\ &\quad + \sum_n {P_n C_{n,1} \,{\rm e}^{{\rm i}nx} \exp({-P_ny})} \nonumber\\ &\quad \left. -\sum_n {{\rm e}^{{\rm i}nx}{\sum_m {m \zeta _m (n-m) h_{(n-m)} \exp({-(P_m+|n-m|)y})}}}\right] .\end{aligned}\nonumber\\\\\nonumber \end{gather}
Expanding the boundary condition (B1) and (B2), using Taylor's series expansion at  $(\kern0.7pt y=0+\epsilon h(x))$, the following is obtained:
 $$\begin{gather} \psi(x,(0+\epsilon h))=\psi(x,0)+\epsilon h(x) \psi_y(x,0)+ O(\epsilon^2) \end{gather}$$
 $$\begin{gather}\psi_y(x,(0+\epsilon h))=\psi_y(x,0)+\epsilon h(x) \psi_{yy}(x,0)+ O(\epsilon^2). \end{gather}$$
Substituting the asymptotic expansion for the streamfunction in the above equation and collecting coefficients with the same power of  $\epsilon$, the boundary condition will be obtained for various orders of perturbation parameter $\epsilon$ as given by
 $$\begin{gather} \psi_0|_{y=0} =0 \end{gather}$$
 $$\begin{gather}\psi_{0y}|_{y=0} =0 \end{gather}$$
 $$\begin{gather}\psi_1 + h(x) \psi_{0y}=0 \end{gather}$$
 $$\begin{gather}\psi_{1y} + h(x) \psi_{0yy}=0 . \end{gather}$$
B.2. Solution for the streamfunction
Leading-order solution ( $O(1)$): a solution of the form $\sum {C_n F_{0n} \exp {({\rm i}nx)}}$ satisfies the solution for $\psi _0$, where $F_{0n}$ is a function of $y$ for $\psi _0$ and submission index $n$ goes from $(-\infty )$ to $+\infty$. The governing equation at the leading order (B3), is a non-homogeneous equation, so the complementary function and the particular integral both exist. The complementary function satisfies $F_{0nyyyy} - ( 2n^2 F_{0nyy} ) +( F_{0n} n^4 )=0$ and is of the form $F_{0n}=(C_{1n}+y C_{2n}) \exp {(-|n| y)}$ as a consequence of the boundedness at large $y$, where the coefficients $\{C_{1n},C_{2n}\}$ will be obtained from the wall boundary condition, before which a particular integral of the solution is needed.
A solution of the form  $(\sum {A_n \exp {({\rm i}nx)}\exp {(-P_n y)}})$ qualifies as a particular integral of (B3), which on substituting in (B3) gives coefficient $A_n$ as given in (B10). Substituting the boundary conditions (B6) and (B7) in the full solution (sum of the complementary function and particular integral) of $\psi _0$, the coefficients $(C_{1n})$ and $(C_{2n})$ will be obtained, which are also given in (B10)
 $$\begin{gather} A_n = \frac{k^2 P_n \zeta_n}{(P_n^2-n^2)^2} \end{gather}$$
 $$\begin{gather}C_{1n}={-}A_n \end{gather}$$
 $$\begin{gather}C_{2n}=A_n (P_n-|n|). \end{gather}$$
 The first-order correction ( $O(\epsilon )$): the first-order governing equation (B4), has a similar form as the leading-order equation. A complementary function and a particular integral also exist for the solution of this equation. Analogous to the leading order, a solution of the form $(\sum {D_n F_{1n} \exp {(inx)}})$ satisfies the governing equation. Substituting this in the governing equation, the complementary function bounded at large $y$ will be obtained as $F_{1n}= D_{1n} \exp {(-|n| y)}+y D_{2n}) \exp {(-|n| y)}$. The order-one equation (B4) has two different functions on the right-hand side, so two different forms of particular integrals satisfying (B4) have to be added to the complementary function, which are $\sum _n{A_{1n} \exp ({-P_n y}) \,{\rm e}^{{\rm i} n x}}$ for $\sum _n P_n C_{1n} \,{\rm e}^{{\rm i} n x} \exp ({-P_n y})$, and $\sum _{n} {\rm e}^{{\rm i} n x} \sum _m A_{2nm} \exp ({-(P_m+|m-n|) y})$ for the remaining part on the right-hand side of (B4). After solving, coefficients $A_{1n}$ and $A_{2nm}$ are obtained, and on substituting boundary conditions (B7) and (B9), the coefficients $D_{1nm}$ and $D_{2n}$ will be obtained. The expressions for these coefficients are given in (B11)
 $$\begin{gather} A_{1n} = \frac{k^2 P_n \sum_m {P_m \zeta_m h_{n-m}}}{(P_n^2-n^2)^2} \end{gather}$$
 $$\begin{gather}A_{2nm}=\frac{k^2 \zeta_m h_{(n-m)} (P_m |n-m|-m(n-m))}{((P_m+|n-m|)^2-n^2)^2} \end{gather}$$
 $$\begin{gather}D_{1n}={-} \left(A_{1n}+\sum_m A_{2nm}\right), \end{gather}$$
 $$\begin{gather}\begin{aligned} D_{2n} &= A_{1n}(P_n-|n|)+ \sum_m {(P_m+|n-m|-|n|)A_{2nm}} \nonumber\\ &\quad -\sum_m {h_{(n-m)}A_m (P_m - |m|)^2} .\end{aligned}\nonumber\\\\\nonumber\end{gather}$$
Appendix C. Deriving the second equality in (2.13b) and effect of phase spectra of patterns
The electroosmotic drift is given by  $\epsilon S$, as per (2.11), (2.12) and (2.13). Here, $S$ is expressed in a form convenient for understanding the interactions between $h(x)$ and $\zeta (x)$
 \begin{align} S &= \sum_{n={-}\infty}^{\infty} K(| m |, k) \zeta_m h_m^* \end{align}
 \begin{align} &= \sum_{m={-}\infty}^{1} K(| m |, k) \zeta_m h_m^*+\sum_{m=1}^{\infty} K(| m |, k) \zeta_m h_m^*\quad [\because\quad h_0=0] \end{align}
 \begin{align} &= \sum_{m=1}^{\infty} K(| m |, k) \zeta_{{-}m}^* h_{{-}m}+\sum_{m=1}^{\infty} K(| m |, k) \zeta_m h_m^* \quad [\text{Changing index:}\quad m\rightarrow -m] \end{align}
 \begin{align} &= \sum_{m=1}^{\infty} K(| m |, k) (\zeta_m h_m^*+\zeta_m^* h_m)\quad [h_{{-}m}=h_m^*,\ \zeta^*_{{-}m}=\zeta_m\quad \text{for real values}] \end{align}
 \begin{align} &= 2\sum_{m=1}^{\infty} K(| m |, k){\rm Re}{(\zeta_m h_m^*)} \end{align}
 \begin{align} &= 2\sum_{m=1}^{\infty} K(| m |, k)| \zeta_m || h_m |\cos{(\angle \zeta_n-\angle h_n)}\quad \mbox{Using polar forms}. \end{align}
Here,  $|\cdots |$ denotes magnitude, ${\rm Re}$ stands for the real part of a complex number. In (C6), $\angle$ is used to denote the principal argument of a complex number. Note that (C5) is the equality sought (the second equality of (2.13b)).
Insights into the phase spectrum are provided by both (C5) and (C6). In (C5), the summand  $K(| m |, k )| \zeta _m | | h_m |$ can assume only positive values for any topographic feature. Therefore, it follows that $S$ lies between the extremal value $-2\sum _{m=1}^{\infty } K(| m |, k)| \zeta _m || h_m |$ causing maximum reverse drift, and the extremal value $2\sum _{m=1}^{\infty } K(| m |, k)| \zeta _m || h_m |$ causing maximum forward drift. No drift results if the spectral phases differ by ${\rm \pi} /2$ or $3{\rm \pi} /2$. Maximum forward drift results if the spectral coefficients are in phase (same phase, or a $2{\rm \pi}$ difference). Maximum reverse drift results if the spectral coefficients differ by ${\rm \pi}$.
Appendix D. Numerical methods
The numerical solution of the governing equation system (2.1) is obtained through finite-element-method-based simulations in the COMSOL Multiphysics ${\circledR}$ software. Quadratic basis functions were chosen for discretizing the weak forms of (2.1) for all dependent variables with the exception of pressure, which was discretized with a linear basis function. The mesh consisted of non-uniform triangular elements. For obtaining results for parallel flow, the ‘Coefficient Form PDE’ interface was used to solve equations (2.1a) and (2.3). For perpendicular flow, the problem was solved using the ‘Electrostatics’ module, ‘Coefficient Form PDE’ interface and ‘Creeping Flow’ module. The ‘Electrostatics’ module solved for the variation in $\varphi$. The PDE module was used for solving the equation for $\tilde {V}$, and the creeping flow module was used to solve the flow equations in a steady-state primitive variable formulation employing damped Newton iterations. The boundary conditions for the electrostatics module were periodic conditions for the left and right walls and zero charge gradient on the far-field boundary. On the wall, a specified zeta potential was applied. Similarly, for the creeping flow module, periodic boundary conditions were applied on the left and right walls while a no-stress condition was applied on the far-field boundary. On the topographically modulated wall, the no-slip boundary condition was applied.
The grid generated for the system consisted of triangular elements with numbers in the range  $3\unicode{x2013}5\times 10^5$, depending on $\epsilon$ value and surface geometry. Studies for grid independence and independence of the numerical results from the mean distance of the top wall from the bottom corrugated wall were conducted. The grid size and the height of the top wall of the numerical domain were chosen such that the electroosmotic velocity at the top wall and mean electrostatic potential on the plane connecting topography crests remained unchanged up to four decimal places, when subjected to both twofold grid refinement and twofold height enlargement. As discussed in Goyal & Datta (Reference Goyal and Datta2022), the numerical model, when specialized to flat surfaces, also compares favourably with the experimental data of Lim et al. (Reference Lim, Lim, Lam, Taboryski and Wang2017).
Appendix E. Debye-length dependence of charge–topography interplay
Figure 5 shows the dependence of the transverse-flow correction to bulk electro-osmosis on the dimensionless inverse Debye length in terms of a ‘roughness sensitivity’ parameter  ${\partial u_\infty }/{\partial \epsilon }$ (see also (2.13)). The last column of table 1 of the main text refers to this figure. The right panels confirm that the thin-Debye-layer limit correction is three times larger than the thick-Debye-layer limit correction. The transition to the thick-Debye-layer limit ( $k\rightarrow 0$) lower bound of far-field effects is sharper than the more gradual transition to the thin-Debye-layer limit ( $k\rightarrow \infty$). The fastest variation in roughness sensitivity occurs at small to intermediate values of $k$ (roughly in the $k=1\unicode{x2013}3$ regime), and, in fact, each dependence has a point of inflection. The largest correction to bulk flow in the topographies investigated occurs for CMT III, where the charge variation and surface geometry have flat and roughly coincident peak regions. On the other hand, the smallest far-field effect is observed for CMT IV, where the topographic and charge-patterning peaks are mismatched and each localized to corners.
Appendix F. Comparison with Ajdari (Reference Ajdari1996)
Ajdari (Reference Ajdari1996), in its Section V, formulates a perturbation theory where topographical and surface charge patterns can coexist. However, the theory differs from the current formulation in the following aspects:
(i) In Ajdari (Reference Ajdari1996), both the charge and corrugation patterns have the specific shape of
$2{\rm \pi} /q$-wavelength cosine waves, with the corrugation leading the charge modulation by a phase angle $\varPhi$. Further, the period-averaged surface charge is zero, resulting in the surface being net neutral. In contrast, the analysis in the current work uses arbitrary and, in general, dissimilar shapes for the charge-variation and corrugation patterns, where phase-shifted patterns arise as a special case (§ 3.2.5).(ii) The theory for corrugated-wall and charge-modulated channels (Ajdari Reference Ajdari1996) (but not for flat-walled channels) is based on the thin-Debye-layer assumption. This assumption, following the notation of Ajdari (Reference Ajdari1996), means that the dimensionless parameters
$\kappa h$ and $\kappa q$ (but not necessarily $q h$) are both large, where $\kappa ^{-1}$ is the Debye length and $h$ is the mean half-width of a plane channel. On the other hand, the current study develops a finite-Debye-layer theory by avoiding any assumption on the order of magnitude of $q\kappa$. Any comparison with Ajdari (Reference Ajdari1996) would, at least, require the limit $k=q\kappa \rightarrow \infty$ of the current findings. For example, this limit process reduces (2.13) to (2.14).(iii) Being formulated for internal flows, the perturbation procedure in Ajdari (Reference Ajdari1996) uses the relative roughness parameter notated as
$\alpha$, which is the ratio of the amplitude of corrugation to the channel mean half-width as the perturbation parameter. The pattern-specific small parameter $\epsilon$ used here can be related to $\alpha$ through $\epsilon =\alpha q\ h$.(iv) The theory of Ajdari (Reference Ajdari1996) applies to a planar channel of mean half-width
$h$, which also has an uncharged planar top wall (pictured in figure 5 of Ajdari Reference Ajdari1996), in addition to the bottom patterned wall. The current formulation is developed for an unbounded electrolyte overlying a single patterned surface. Therefore, the current study has no equivalent to the parameter $q h$ of Ajdari (Reference Ajdari1996). Further, the top unpatterned wall adds a linear shear flow over circulatory flow patterns in Ajdari (Reference Ajdari1996) in place of the uniform flow added in the current study. However, as discussed in Ajdari (Reference Ajdari1996), certain results from its Section V would signify each channel wall acting independently of the other when considered in the limit $q h\rightarrow \infty$. Under this condition, a comparison with our findings can be made, as discussed below.


Referring to figure 5 of Ajdari (Reference Ajdari1996), when  $q h \rightarrow \infty$, the net effect of the bottom charge-modulated and shape-modulated wall is to provide a near wall slip velocity $U_s$, which must, however, linearly decay to the value zero on the top uncharged wall. In (59) for perpendicular flow and (66) for parallel flows of Ajdari (Reference Ajdari1996), the flow rate (termed ‘flux’) arising from the shear flow $U_s (2h)/2=U_s h$ is reported. Therefore, the corresponding $U_s$ can be inferred simply by dividing the large $q h$ limits of the right-hand sides of (59)/(66) by $h$, as appropriate for shear flow. The inputs, notational interconversions and limit processes required for validating (2.11)/(2.14a) of the current study against (59)/(66) of Ajdari (Reference Ajdari1996) are specified in the main text. The end result is a mutual agreement between the two equation sets.
The right-hand side of the vector valued (67) from Ajdari (Reference Ajdari1996) can be interpreted as a cross-sectionally averaged velocity of the above-discussed shear flow with the flow rate given by (59) in perpendicular flow and (66) in parallel flow, when the direction of patterning makes an angle  $\theta$ with the applied field direction. The special case of patterns ( $\theta =0$) perpendicular to the electric field in (67) is precisely $3$ times of the special case $\theta =90^\circ$, which corresponds to patterns aligned with the electric field. The same ratio emerges from the right-hand sides of (2.14a) and (2.11), thus generalizing this finding from Ajdari (Reference Ajdari1996) to arbitrary periodic patterns. However, Ajdari's interpretation of the left-hand side of (67) as a slip velocity appears to be off by a dividing factor of 2 when compared with the slip velocities calculated from (59) and (66) of the same work (and also from (2.11)/(2.14a) of the current work). This could be an (arguably minor) analytical or typographic oversight. Further, the use of sufficiently small values for $\epsilon$ in our numerical simulations using CMT I, which happens to be the $\varPhi =0$ case of the corrugation-charge profiles in Ajdari (Reference Ajdari1996), produces predictions in close agreement with (59) and (66) of Ajdari (Reference Ajdari1996) and (2.11) and (2.11b) of the current work, rather than with (67) of Ajdari (Reference Ajdari1996).


 Open access