


1. Introduction
The evolution of a droplet deposited on the surface of an immiscible liquid (sketched in figure 1a) is a conceptually simple problem with far-reaching societal impact, ranging from the everyday mixing of salad dressings to engineering applications, such as the cleaning of deep-sea oil spills (Fay Reference Fay1969; Di Pietro, Huh & Cox Reference Di Pietro, Huh and Cox1978; Foda & Cox Reference Foda and Cox1980; Kleidienst, Paul & Joye Reference Kleidienst, Paul and Joye2015) and pharmaceutical manufacture (Yeo, Basaran & Park Reference Yeo, Basaran and Park2003). The apparent simplicity of the problem is misleading, since the interfacial dynamics is governed by a complex interplay between viscous, gravitational and capillary forces acting at disparate length scales. For small (sub-millimetric) droplets, gravitational forces are generally neglected, with interfacial tensions  $\gamma$ between droplet, substrate and air phases playing the dominant role. The fate of the system then depends on how readily each liquid will wet and therefore spread upon the other; in particular, we may refer to the spreading coefficients
 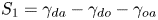 $S_1=\gamma _{da}-\gamma _{do}-\gamma _{oa}$ and
 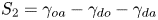 $S_2=\gamma _{oa}-\gamma _{do}-\gamma _{da}$, which respectively quantify how readily the substrate phase spreads on the droplet surface in the presence of air (subscripts
  $o$,
$o$,  $d$ and
  $a$; later in the paper oil is used as the substrate) and vice versa. Broadly speaking, there are three possibilities at equilibrium (Berthier & Brakke Reference Berthier and Brakke2012), as shown in figure 1(b). Perhaps the most commonly encountered situation is partial wetting between the droplet and the substrate (requiring both
  $S_1<0$ and
  $S_2<0$), as occurs for olive oil on water. In this case, the droplet will adopt a lens-shaped configuration at the surface of the substrate. The exact shape of the lens is determined by the balance of surface tensions at the contact line between the three phases, the Neumann construction (Buff & Saltsburg Reference Buff and Saltsburg1957), which is only possible if both spreading coefficients are negative. Alternatively, if
  $S_2>0$ the droplet will wet the substrate perfectly (e.g. mineral oil on water), in which case a Neumann construction is excluded and the droplet spreads to cover the substrate entirely since it is energetically favourable to do so (Langmuir Reference Langmuir1933; Bergeron & Langevin Reference Bergeron and Langevin1996). The third possibility, which is the focus of this paper, is that the substrate wets the droplet perfectly (
 $S_1>0$; e.g. water on mineral oil). The substrate liquid then spreads to cover the droplet, engulfing it in the process (Berthier & Brakke Reference Berthier and Brakke2012; Anand et al. Reference Anand, Rykaczewski, Subramanyam, Beysens and Varanasi2015; Sanjay et al. Reference Sanjay, Jain, Jalaal, van der Meer and Lohse2019). Which of these three scenarios applies is not determined solely by the combination of liquids; the presence of surfactants, found ubiquitously in natural (and scientific) settings, is sufficient to alter the wetting properties of the phases, inhibiting spreading (Karapetsas, Craster & Matar Reference Karapetsas, Craster and Matar2011) or modifying the stability of liquid lenses (Phan et al. Reference Phan, Allen, Peters, Le and Tade2014). Hence, a thorough understanding of each scenario is required, and yet engulfment has been largely overlooked in previous research. In this paper, we therefore offer an in-depth study of the dynamics of droplet engulfment.
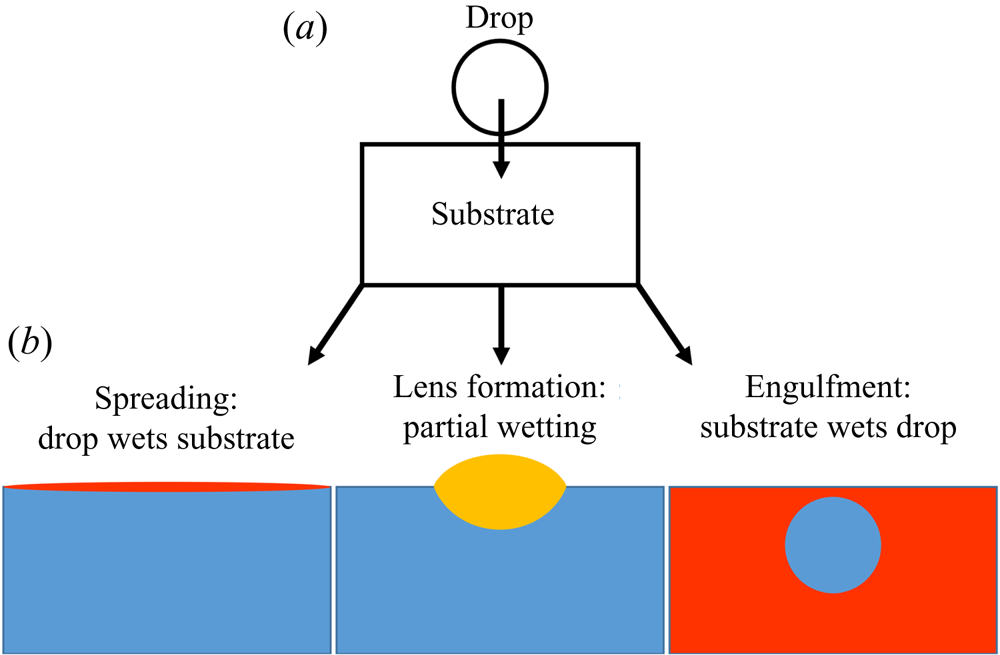
Figure 1. Schematic illustration of the possible equilibrium states of a droplet on an immiscible liquid substrate. (a) The droplet is deposited on the substrate. (b) Depending on wetting conditions, there are three general equilibrium states possible, neglecting gravity.
Gravitational effects are always present if there is any difference in density  $\varDelta \rho$ between the two liquid phases. Generally, gravitational effects are considered significant compared to capillarity for droplets larger than the capillary length
 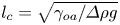 $l_c=\sqrt {\gamma _{oa}/\varDelta \rho g}$ (Vella Reference Vella2015), typically a few mm, where g is the acceleration of gravity. For a partially wetting drop denser than the substrate phase, for example, the liquid lens configuration is only stable up to a critical droplet volume of order
  $l_c^3$ (with the exact value dependent on the Neumann construction) beyond which sinking is inevitable (Phan et al. Reference Phan, Allen, Peters, Le and Tade2012). By contrast, we find that for the engulfment of drops on perfectly wetting liquids, gravitational effects play a key role for even microscopic droplets.
Droplets or particles adhered or adsorbed to a liquid interface tend to deform the interface. This is generally due to a combination of gravitational effects – weight and buoyancy – as well as purely geometric constraints, as in the case of an interface meeting an adsorbed rigid particle at a fixed contact angle (Kralchevsky & Nagayama Reference Kralchevsky and Nagayama2000; Vella & Mahadevan Reference Vella and Mahadevan2005; Galatola & Fournier Reference Galatola and Fournier2014; Carrasco-Fadanelli & Castillo Reference Carrasco-Fadanelli and Castillo2019; Napoli & Goriely Reference Napoli and Goriely2020). Away from equilibrium these deformations can drive capillary flows in the substrate phase as the interface evolves towards a minimal surface configuration, balancing hydrostatic pressures and curvature-induced capillary stresses. Such flows can generate interactions between droplets or particles at the interface, resulting in self-assembly and complex emergent behaviour (McGorty et al. Reference McGorty, Fung, Kaz and Manoharan2010). For example, particle rafts of hydrophobic polymer beads on an air–water interface may collectively wrinkle like elastic solid sheets (Vella, Aussillous & Mahadevan Reference Vella, Aussillous and Mahadevan2004), while stainless steel beads aggregate to form structures too heavy to float at an air–oil interface, despite the individual beads being supported by capillarity (Protière et al. Reference Protière, Josserand, Aristoff, Stone and Abkarian2017). Similarly, interfacial colloidal suspensions may form ‘soft crystals’, organising themselves into a regular lattice structure (Park & Furst Reference Park and Furst2010).
The dynamics of liquid–liquid wetting, or spreading, has been studied in a number of geometries for perfectly wetting immiscible liquids. Oil reservoirs are brought into contact with air–water surfaces and allowed to spread within channels or circular baths (Camp & Berg Reference Camp and Berg1987; Bergeron & Langevin Reference Bergeron and Langevin1996). More recently, droplet-on-droplet spreading has been studied due to applications in medicine and pharmaceuticals (Yeo et al. Reference Yeo, Basaran and Park2003). In all cases, the general features of spreading are similar, with the bulk of the spreading phase preceded by a molecularly thin precursor layer of the same fluid ((Bonn et al. Reference Bonn, Eggers, Indekeu, Meunier and Rolley2009), see figure 2). Precursor layers spread rapidly over pristine surfaces, drawn out by a gradient in surface tension along the length of the film – a Marangoni flow (Fay Reference Fay1969; Di Pietro et al. Reference Di Pietro, Huh and Cox1978; Foda & Cox Reference Foda and Cox1980). Here, the disjoining pressure, arising from repulsive Van der Waals and other intermolecular interactions between the film surfaces, plays a role, modifying the free surface energy within the film (Harkins Reference Harkins1941; Brochard-Wyart et al. Reference Brochard-Wyart, Di Meglio, Quere and De Gennes1991; Bergeron & Langevin Reference Bergeron and Langevin1996). The advancing film is resisted by viscous dissipation.
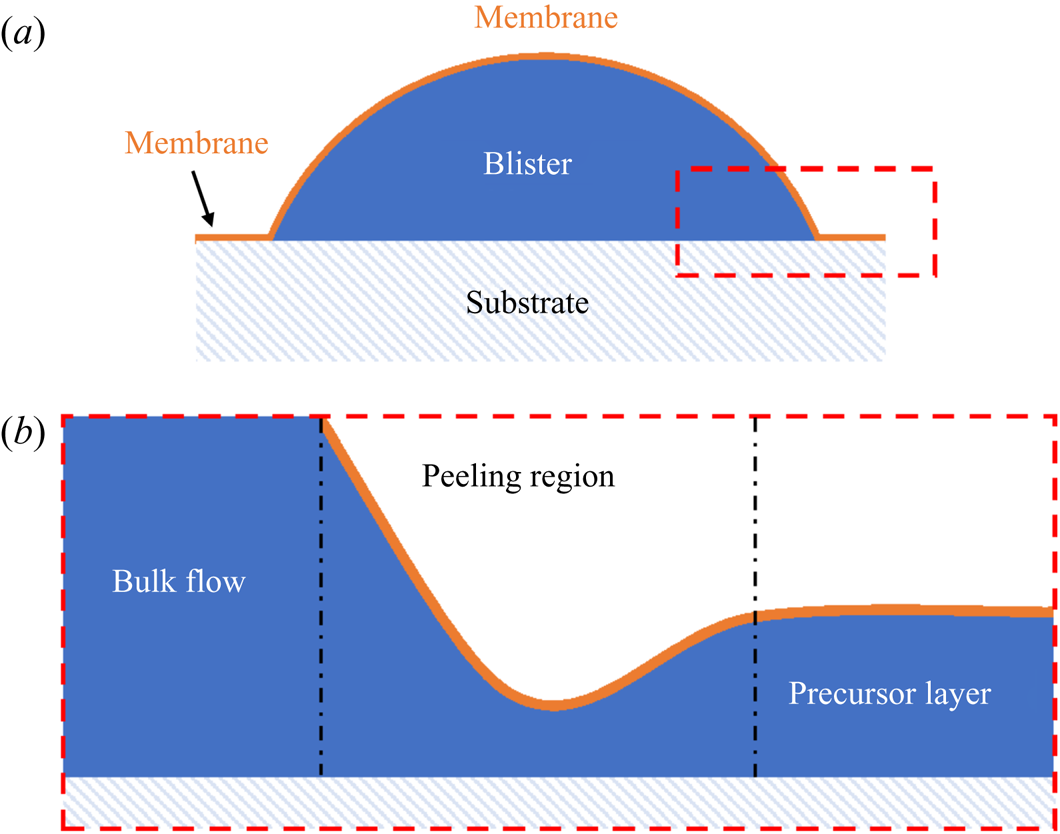
Figure 2. (a) Schematic diagram of a peeling flow for a blister of fluid under a membrane. (b) Close up of the boxed region in (a). The ‘peeling region’ around the edge of the blister separates the static precursor layer from the advancing bulk of the liquid phase.
The spreading of the bulk of the liquid once a precursor layer is established is a much slower process analogous to peeling dynamics, as illustrated in figure 2 (Lister, Peng & Neufeld Reference Lister, Peng and Neufeld2013; Juel, Pihler-Puzović & Heil Reference Juel, Pihler-Puzović and Heil2018). Just as a blister of fluid injected under a membrane grows by peeling the membrane away from the underlying substrate (figure 2a), a perfectly wetting droplet spreads by effectively peeling the two surfaces of the precursor film apart. Such peeling flows are dominated by stresses within a narrow peeling region which coincides with the apparent contact line at the rim of the spreading droplet (see figure 2b). Specifically, the dynamics of the flow is determined by a balance between capillary and viscous stresses which are focussed within the peeling region. In principle, the droplet should continue to spread into a ‘pancake’ shape of uniform thickness (i.e. a minimal surface), although in practice perfectly wetting droplets may exist as meta-stable lenses (pseudo-partial wetting) under the influence of the precursor layer (Kellay, Meunier & Binks Reference Kellay, Meunier and Binks1992; Bergeron & Langevin Reference Bergeron and Langevin1996).
For a droplet of water, say, deposited on a layer of perfectly wetting oil, one may expect a comparable two-stage process by which the droplet is completely engulfed in oil (the equivalent of spreading). Indeed, analogous to the formation of precursor layers, a recent study (Sanjay et al. Reference Sanjay, Jain, Jalaal, van der Meer and Lohse2019) has shown that in this scenario the substrate phase will rapidly spread to cover the droplet surface entirely, establishing a thin ‘cloaking’ layer of oil. However, the majority of related studies have focussed on the deposition of aqueous droplets on liquid infused surfaces (LISs) – porous rigid substrates suffused with lubricant (generally oil), which demonstrate remarkably low friction and contact angle hysteresis (Sett et al. Reference Sett, Yan, Barac, Bolton and Miljković2017; Solomon et al. Reference Solomon, Subramanyam, Farnham, Khalil, Anand and Varanasi2017; McHale et al. Reference McHale, Orme, Wells and Ledesma-Aguilar2019). Since the depth of lubricant is generally much less than the size of the droplet, total engulfment (that is, spreading) is not observed. Instead the droplet's weight is supported by the substrate, resting either on a stable film of lubricant or on the solid substrate itself, depending on the relative wetting properties of each phase (Smith et al. Reference Smith, Dhiman, Anand, Reza-Garduno, Cohen, McKinley and Varanasi2013), with the surrounding oil layer adopting a minimal surface configuration. At equilibrium, the surface of the cloaking layer must conform to the curvature of the droplet, subjecting the fluid within the cloak to a Laplace pressure. The equilibrium thickness of the cloak (typically tens of nm) is determined by balancing Laplace pressure in the fluid with disjoining pressure between the two surfaces, the latter being repulsive for perfectly wetting films (Anand et al. Reference Anand, Rykaczewski, Subramanyam, Beysens and Varanasi2015; Schellenberger et al. Reference Schellenberger, Xie, Encinas, Hardy, Klapper, Papadopoulos, Butt and Vollmer2015). Previous studies of cloaked droplets have therefore focussed predominantly on steady states of the system.
In this paper, we present an experimental study of an aqueous droplet engulfed by a deep layer of perfectly wetting, viscous oil on which the droplet is deposited. This scenario contrasts with droplets deposited on LISs; because the weight of the droplet cannot be supported by a solid surface, total engulfment may take place – this type of unsteady dynamics has not been previously reported. We are primarily concerned with the spreading of the substrate phase (oil) over the droplet surface, and so will hereafter refer to a single spreading coefficient 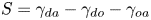 $S=\gamma _{da}-\gamma _{do}-\gamma _{oa}$, which was previously referred to as
  $S_1$.
The process by which the droplet is engulfed comprises four stages, as illustrated in figure 3. Stage 1 starts when the droplet impacts the oil layer, entraining a cushion of air upon which the droplet temporarily rests. The weight of the droplet (transferred via the air cushion) deforms the oil surface and drives air out of the cushion, bringing the oil and droplet surfaces closer together. As the separation between the two surfaces reaches a critical value of around  $\sim$100 nm, the attractive Van der Waals forces between the surfaces become dominant, rupturing the air cushion (Couder et al. Reference Couder, Fort, Gautier and Boudaoud2005; Thoroddsen et al. Reference Thoroddsen, Thoraval, Takehara and Etoh2012). We define the instant
  $t=0$ at which oil first contacts the droplet as the start of stage 2 (figure 3b). Oil is then drawn upwards, spreading over the surface of the droplet (since
  $S>0$); related studies suggest that the droplet is fully covered in a cloaking layer of oil early in stage 2 (Sanjay et al. Reference Sanjay, Jain, Jalaal, van der Meer and Lohse2019). As the droplet sinks, the local deformation of the oil layer around the droplet transitions from being deflected upwards (pulling the drop down) to being deflected downwards (resisting the downwards motion of the drop); the start of stage 3 is defined by the instant at which the oil surface around the droplet is undeflected. By contrast with droplets on LISs, during stage 3 the weight of the droplet acts to pull down on the oil surface, excluding a minimal surface configuration and driving continuous flows in the peeling region close to the apparent contact line. The cloaking layer of oil is thus gradually peeled away from the droplet surface, until the instant
  $t=t_0$ at which the droplet detaches from the oil surface. Detachment marks the start of stage 4, during which the droplet sinks into the slightly less dense oil. This final stage is sedimentation and is well characterised: the droplet sinks under its own weight, resisted by buoyancy and viscous drag, predominantly within the oil phase (Hadamard Reference Hadamard1911; Rybcznski Reference Rybcznski1911; Brenner Reference Brenner1962; Taylor & Acrivos Reference Taylor and Acrivos1964).
Figure 3. Overview of droplet engulfment. (a) Schematic diagram illustrating the four stages of engulfment. The red dot is the droplet's centroid.  $R_f$ is the droplet's in-flight radius. (b) Illustration of the dynamical process of engulfment, tracking the height
  $h_c$ of the droplet centroid relative to the oil surface. Time is defined relative to the instant the air cushion ruptures (
 $t=0$; start of stage 2) and
  $t=t_0$ is the instant when the droplet detaches from the oil surface (end of stage 3). The oscillations during stage 1 correspond to bouncing of the droplet after impact.
Since both impact (stage 1) and sedimentation (stage 4) are well understood (e.g. Brenner Reference Brenner1962; Thoroddsen et al. Reference Thoroddsen, Thoraval, Takehara and Etoh2012), the focus of our study is the dynamics of engulfment during stages 2 and 3. Stage 3 is of particular interest as it dominates the dynamics, lasting for  $\sim$99 % of the experimental duration
  $t_0$. In § 2 we describe our experimental methods. We present our results in § 3. By varying droplet size and substrate viscosity, we show in § 3.1 that the dynamics of early engulfment (stage 2) is determined by a competition between viscous and capillary effects. We also show evidence that a cloaking layer of oil covers the droplet early in stage 2. In § 3.2, we examine the evolution of gravitational and capillary forces acting on the droplet during late-time engulfment (stage 3). We find that viscous forces acting on the droplet are approximately equal to capillary forces exerted by the deformed oil surface throughout stage 3. Furthermore, we show that gravity plays a central role for even microscopic droplets. We discuss the slow spreading of oil over the droplet surface in terms of peeling dynamics, mediated by the oil cloak which acts as a precursor layer. The coupling between peeling dynamics and evolving gravitational and capillary forces yields the unexpected result that the time scale
  $t_0$ of engulfment varies non-monotonically with the size of the droplet, with droplets of intermediate size taking the longest time to detach from the oil surface. Experiments are also performed for droplets of fixed size on oils of different kinematic viscosity
  $\nu$. We find that
  $t_0$ varies nonlinearly with
  $\nu$, with a power law dependence which appears to be independent of droplet size. While the fate of our droplets is all but guaranteed (they must all sink eventually), our results reveal an unexpectedly rich dynamics leading to equilibrium.
2. Experimental methods
2.1. Set-up and procedure
The experimental set-up, shown schematically in figure 4(a), consists of an oil bath, onto which aqueous droplets were deposited. The oil phase was contained in bespoke open-topped cubic Perspex boxes of internal dimension  $L=40$ mm. Droplets of various sizes were used, quantified by their in-flight radius
 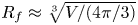 $R_f\approx \sqrt [3]{V/({4\pi }/{3})}$, where
  $V$ is the droplet volume. The smallest droplets (microdroplets) had in-flight radii of tens of
  $\mathrm {\mu }$m, while the radii of the larger macrodroplets were in the range
  $1 < R_f < 3$ mm. In all experiments, the droplet was deposited directly in the centre of the bath so as to maximise the distance between the droplet and the vessel walls. The size of the boxes was chosen to be much greater than that of the droplets (
 $L/R_f>10$) in order to ensure that the vertical level of the oil surface was not increased significantly due to oil displaced by the droplet (the level rose by
  $2\,\%$ of
  $R_f$ for the largest droplets studied). The reference level of the oil was measured after each experiment to account for any slight changes. In addition, since the droplets deformed a region of the oil surface of radius
  ${\sim }R_f$ around the droplet, the size of the box was sufficient to ensure that meniscus effects at the rigid walls were negligible. During stage 4 (sedimentation), we monitored the descent of the droplet away from the interface over a vertical distance of around one
  $R_f$. All droplets sedimented away from the oil surface without any clear evidence that a constant terminal velocity had been reached. The maximum measured Reynolds number during stage 4 was
 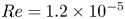 $Re=1.2\times 10^{-5}$, recorded for a drop with
  $R_f=1.07$ mm deposited on oil with kinematic viscosity 100 cSt, and so we may assume Stokes’ flow for all drops during stage 4. The drops sedimented consistently more slowly than would be expected for a free droplet (Hadamard Reference Hadamard1911; Rybcznski Reference Rybcznski1911) due to the increased drag resulting from long range interactions with the air–oil free surface as well as the vessel walls, with the magnitude of the additional drag force inversely proportional to the proximity of the boundary (Brenner Reference Brenner1962). While we can therefore not discount the drag due to vessel walls entirely, we expect the effect of the air–oil free surface to dominate due to the much greater proximity between the droplet and the surface.
Figure 4. (a) Schematic diagram of the experimental set-up. The region of interest (ROI) is indicated. (b) Close-up schematic representation of the ROI during an experiment, showing the cap of the droplet visible above the oil bath surface. Panels (c) and (d) show typical experimental images in side and top views, respectively, during stage 3 of the experiment. Panel (d) shows the results of an image analysis routine which detects the edge of the droplet cap (left image; blue points): the image is distorted by the oblique viewing angle of the top view; a transformation procedure described in § 2.2 reconstructs the axisymmetric perimeter of the cap (right image; blue points), which is well approximated by a circle (red line), so that the radius  $r_c$ of the cap can be measured.
Producing micro- and macrodroplets of reproducible sizes required two different deposition methods. Macrodroplets were deposited on the oil surface by dripping water from a deposition needle fed by a glass syringe acting as a reservoir, which was held above the oil bath. To generate a droplet, the plunger of the syringe was lightly tapped to initiate the formation of a pendant drop, which gradually grew due to a hydrostatic pressure-driven flow along the inclined needle. At a critical volume, the droplet detached from the needle, producing a droplet of reproducible volume. Capillary pressure at the outlet of the needle prevented any further drops from forming. We varied the in-flight radius of the macrodroplets by using deposition needles of different gauges. Droplets of size  $R_f=1.07\pm 0.03$,
  $1.77\pm 0.02$ and
  $2.17\pm 0.05$ mm were produced using 30 gauge flat-tipped, and 21 and 17 gauge hypodermic needles, respectively. The largest drops used (
 $R_f=2.82\pm 0.03$ mm) were produced by feeding water via a 30 gauge needle along the outer surface of a 17 mm diameter inclined cylindrical glass rod, allowing the water to drip from the lower edge of the rod. Microdroplets of
  $R_f=38.6\pm 0.4$
  $\mathrm {\mu }$m were produced using a piezoelectric drop-on-demand glass capillary printhead with a 120
  $\mathrm {\mu }$m diameter aperture (MJ-ABL-01-120-8MX; MicroFab Technologies Inc., USA). The printhead was powered with a waveform signal generated using a NI-DAQ (6251; National Instruments), amplified by a voltage amplifier (PZD 350A; Trek Inc., USA). The printhead could only produce water droplets of a particular volume, while the size of droplets which can be generated by dripping is limited by the capillary length (around 1 mm for water in air); hence, we were unable to investigate droplets with
  $39\ \mathrm {\mu }\textrm {m} < R_f < 1\ \textrm {mm}$. For macrodroplets (
 $R_f>1$ mm), the needle (or rod) was positioned at a height
  $2R_f+3$ mm above the oil surface such that the drops fell a distance
  $3\pm 1$ mm before impact, resulting in an impact velocity of
  $24\pm 4$ cm s
 $^{-1}$. The precise impact velocity did not affect the reproducibility of results (see Appendix A). For microdroplets, the printhead was positioned
  $11\pm 1$ mm above the oil surface, impacting at
  $3\pm 0.4$ m s
 $^{-1}$. Immediately after droplet deposition, the bath was covered with glass slides to protect the experiment from air currents and drifting dust particles within the laboratory.
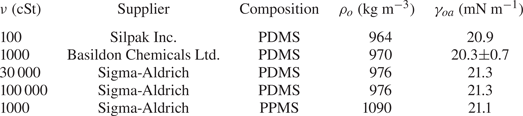
We filled the bath with silicone oils of kinematic viscosity  $10^2\le \nu \le 10^5$ cSt. The decision to study this high-viscosity regime was based on preliminary results detailed in Appendix B. The physical properties of the oils are given in table 1. The majority of the oils used were polydimethylsiloxane (PDMS)-based fluids, all with densities
  $\rho$ slightly lower than that of water. We also performed experiments with a 1000 cSt polyphenylmethylsiloxane (PPMS)-based oil with a density slightly greater than that of water. For oils of
  $\nu \le 1000$ cSt, the baths were degassed under vacuum to remove any visible bubbles. For
  $\nu >1000$ cSt, meanwhile, the rupture of bubbles during degassing would leave films of oil which trapped more air as they settled, making degassing impractical. Instead, careful pouring was sufficient to ensure no air bubbles were trapped in such high-viscosity oils. The baths were covered and left to settle for 1 hour prior to experiments to ensure a level surface. Thorough cleaning of the Perspex boxes was required to ensure the oil surface was pristine. Prior to experiments, each box was cleaned with iso-propanol and then rinsed several times with deionised water before it was dried in a vacuum chamber. A similar cleaning procedure was followed for all components which came into direct contact with any liquid, e.g. syringes, printhead etc. Preliminary tests were performed with either water droplets doped with surfactant (washing-up liquid) beyond the critical micelle concentration, or Perspex boxes rubbed with paper towels to induce an electrostatic charge, both of which were sufficient to significantly alter experimental results. Both of these tests are too extreme to give any indication of the extent to which experiments were affected by surfactant or electrostatic effects. However, the reproducibility of our results (see § 3) suggests that our cleaning procedure at least resulted in consistent levels of any such perturbations.
Table 1. Physical properties of the silicone oils used in experiments. All quantities are quoted from suppliers, with the exception of the surface tension  $\gamma _{oa}$ of the 1000 cSt PDMS oil, which was measured using the pendant drop method. The value is in reasonable agreement with the supplier-quoted value of 21.1 mN m
 $^{-1}$. The density
  $\rho _{o}$ and kinematic viscosity
  $\nu$ of each oil is also listed, along with the chemical composition. PDMS and PPMS refer to polydimethylsiloxane and polyphenylmethylsiloxane, respectively.
We used three different fluids for the droplets: deionised water (Millipore 18.2 M $\Omega$, Milli-Q), a proprietary PEDOT:PSS ink used in POLED printing (Cambridge Design Technology Ltd.) and a perfluorinated fluid (Galden HT270, Solvay), the physical properties of which are listed in table 2. Although PEDOT:PSS is a complex fluid, it is Newtonian at the low shear rates present in our experiments (Kant et al. Reference Kant, Hazel, Dowling, Thompson and Juel2017). The air–liquid and silicone oil–liquid interfacial tensions,
  $\gamma _{da}$ and
  $\gamma _{do}$, were measured for each liquid in table 2 using the pendant drop method (Daerr & Mogne Reference Daerr and Mogne2016). The 1000 cSt PDMS oil was used for measurements of
  $\gamma _{do}$. For practical reasons, measurements for viscosities
  $\nu >1000$ cSt were not taken. However, the oils used are chemically similar, being PDMS or PPMS based, so that
  $\gamma _{do}$ is approximately constant when varying
  $\nu$, and values of
  $\gamma$ and
  $S$ measured using 1000 cSt PDMS oil are representative of all other oils used.
Table 2. Physical properties of the liquids used to form the droplets in experiments. Densities  $\rho _{d}$ and kinematic viscosities
  $\nu$ are supplier-quoted or standard values. The droplet–air and droplet–oil surface tensions (
 $\gamma _{do}$ and
  $\gamma _{da}$) were measured using pendant drop analysis. These values along with the oil–air surface tension
  $\gamma _{oa}$ allow us to calculate the spreading coefficient
  $S=\gamma _{da}-\gamma _{do}-\gamma _{oa}$. Measurements of
  $\gamma _{do}$ and
  $\gamma _{oa}$ were taken using 1000 cSt PDMS oil.
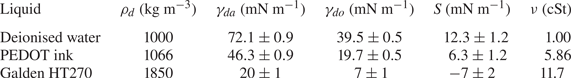
Table 2 also lists the substrate-on-droplet spreading coefficients  $S$ and densities
  $\rho _{d}$ of the droplet liquids tested. Galden HT270 is the only one of the three liquids which is partially wetting on silicone oil, having
  $S<0$. It is also considerably more dense than all of the oils used. Consistent with the discussion of § 1, we observed droplets of Galden HT270 deposited on 1000 cSt PDMS oil to form stable lenses up to
  $R_f\approx 1$ mm, around the capillary length
  $l_c=1.6$ mm. Stable lenses were still present at the surface after
  $>$48 h. By contrast, for liquids with
  $S>0$ (water; PEDOT ink) stable lens states were not observed, as oil naturally spread to cover the droplets completely (see § 3). Provided
  $\rho _{o}<\rho _{d}$, such a droplet should always eventually be engulfed and sink. This was the case for all our water droplets, including the microdroplets which all sank within a few minutes. See Appendix C for a discussion of the case when
  $\rho _{o}>\rho _{d}$.
2.2. Visualisation
Due to the disparate time scales involved, capturing the dynamics of each stage of engulfment (see figure 3) required a number of different imaging methods. During stage 2, around  $90\,\%$ of the droplet's volume was submerged over
  $\sim$1 % of the total experiment duration
  $t_0$. The rapid vertical droplet motion was best imaged in side view (see figure 4a). Side view images were taken using a fast camera (Photron Fastcam Mini AX,
  $1024\times 1024$ pixels, 1000–22 500 frames per second (f.p.s.) depending on oil viscosity) fitted with long-distance magnifying optics (Navitar) and a 50 mm f/1.4 lens for macrodroplets, or a 10
 $\times$ microscope objective (Mitutoyo) for microdroplets. To avoid imaging through the oil meniscus, the side view camera was inclined upwards relative to the horizontal at an angle of
  $2^{\circ }$, which is small enough to not distort the image significantly. To capture the droplet impact dynamics in stage 1, a similar method was employed with the camera inclined downwards to image above the oil surface.
During stage 3, the droplet remained suspended beneath the oil surface, as shown schematically in figure 4(b), sinking slowly whilst oil spread to cover the droplet over  $\sim$99 % of
  $t_0$. Stage 3 was imaged simultaneously in side view (fast camera set-up described for stage 2, recording at 50 f.p.s.), as well as in top view, looking down onto the upper surfaces of the droplet and surrounding oil. Figure 4(c) shows a typical experimental side view image for a macrodroplet (
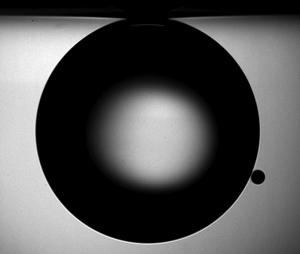
 $R_f=1.07$ mm); the small air bubble visible on the underside of the droplet is a remnant of the air entrained by the drop upon impact (Thoroddsen et al. Reference Thoroddsen, Thoraval, Takehara and Etoh2012; Tran et al. Reference Tran, de Maleprade, Sun and Lohse2013). The oil surface curves down towards the droplet, appearing to meet the droplet at a sharp angle. When viewed from above, this gave the impression of a ‘cap’-like region of the droplet protruding above the oil surface with a well-defined perimeter. Figure 4(d) shows a typical image of this cap, recorded by the top view camera. Top view images were taken via a charge-coupled device camera (Pixelink,
  $1280\times 1024$ pixels, 5–50 f.p.s.), fitted with a long-distance assembly along with either a 5
 $\times$ or 10
 $\times$ microscope objective (Mitutoyo) for macro- and microdroplets, respectively. The droplet was back lit in both directions using LED lamps diffused through opalescent acrylic. Side view recordings for stage 3 also captured part of stage 4 (sedimentation).
In all experiments, the deposition device used (needle, glass rod or printhead) obscured the view directly above the droplet. Imaging from below, through the Perspex box, oil and droplet, produced refractive distortions of the image, hindering quantitative image analysis. We therefore imaged from above at an oblique angle, via an inclined mirror (figure 4a). This produced significantly distorted images, as shown in figure 4(d), where the circular cap of the drop protruding from the oil bath appears ‘egg shaped’. To correct for this distortion, we imaged a precision linear micro-scale (1 mm; 200  $\mathrm {\mu }$m bars at 100
  $\mathrm {\mu }$m intervals) in top view prior to each experiment. We then took a set of points
  $(x',y')$ from the distorted image of the micro-scale, corresponding to a set of points
  $(x,y)$ of known relative dimensions in the physical plane. The points
  $(x',y')$ could then be transformed into
  $(x,y)$ via rotation, shear and rescaling transformations. The same set of transformations could then be applied to reconstruct any top view image in the physical plane. The right image of figure 4(d) shows the result of this procedure applied to an experimental image; a circular cap perimeter has been recovered, with accurate dimensional units allowing us to measure the radius
  $r_c$ of the cap in each frame. To validate the procedure, we applied the method to top view images of printed text or specks of dust on microscope slides. We compared the reconstructed images to undistorted images of the same object recorded directly from below. Angles and lengths were recovered to within
  $1\,^{\circ }$ and
  $1\,\%$ of the true values, respectively. This imaging procedure was only used during the later stage 3 of engulfment, over which the droplet descends by around
  $0.1R_f$; hence, the contact line only moves very slightly relative to the imaging plane of reference and the quality of reconstruction is not significantly affected.
2.3. Evaporation
The evaporation of water droplets was monitored throughout experiments by estimating the droplets’ instantaneous volume from side view (macrodroplets) or top view (microdroplets) images. This was done by fitting a circular profile to a droplet's perimeter and comparing the instantaneous radius  $R(t)$ to the in-flight radius
  $R_f$. For macrodroplets, the maximum recorded evaporative volume loss (defined as
  $1-(R(t_0)/R_f)^3$) was
  $3\,\%$, in the case of a 1.07 mm drop deposited on
  $10^5$ cSt oil (
 $t_0\approx 1$ h). All macrodroplet experiments were conducted in ambient laboratory conditions of
  $21\pm 1\,^{\circ }\textrm {C}$ at a relative humidity of
  $30\,\%<\phi <50\,\%$, as read from a digital thermo-hygrometer beside the apparatus. Repeat trials on different days suggested variations in humidity over this range did not significantly affect the results. For microdroplets, however, significant (or complete) evaporation was observed over experimental times in ambient conditions, and so experiments were instead performed in a sealed humidity chamber: a modified fume hood housing the experimental apparatus, in which the relative humidity was maintained in the range
  $80\,\%<\phi <90\,\%$. Figure 5(a) shows the time evolution of normalised droplet volume
  $(R(t)/R_f)^3$ for droplets with
  $R_f=38.6$
  $\mathrm {\mu }$m over the full range of
  $\nu$ tested. Times have been normalised by the total experimental duration
  $t_0$ (see § 2.2). At early times (
 $t<0.1t_0$) the shape of the droplet is distorted both physically and optically due to being compressed vertically by capillary stresses, as well as the deformed oil surface acting as a concave lens. Consequently, the measured radius
  $R(t)$ is initially
  ${>}R_f$. This effect subsides, and at later times the droplet volume can be seen to decrease approximately linearly with time in all cases. A linear fit to these data indicates that the evaporation rate is approximately constant at around
  $-0.2\times 10^{-12}$ l s
 $^{-1}$ for all
  $\nu$ (figure 5b). (We note that the point at 100 cSt is unreliable due to the relatively short experimental time
  $t_0<1$ s.) The
  $10^5$ cSt case had by far the longest experimental duration of
  $t_0\approx 160$ s, and therefore the greatest absolute evaporation (
 $\sim$10 % of the initial volume). In § 3 the majority of the discussion focusses on droplets deposited on 1000 cSt oil, for which evaporative losses were around
  $0.3\,\%$ and
  $1\,\%$ for macro- and microdrops, respectively.
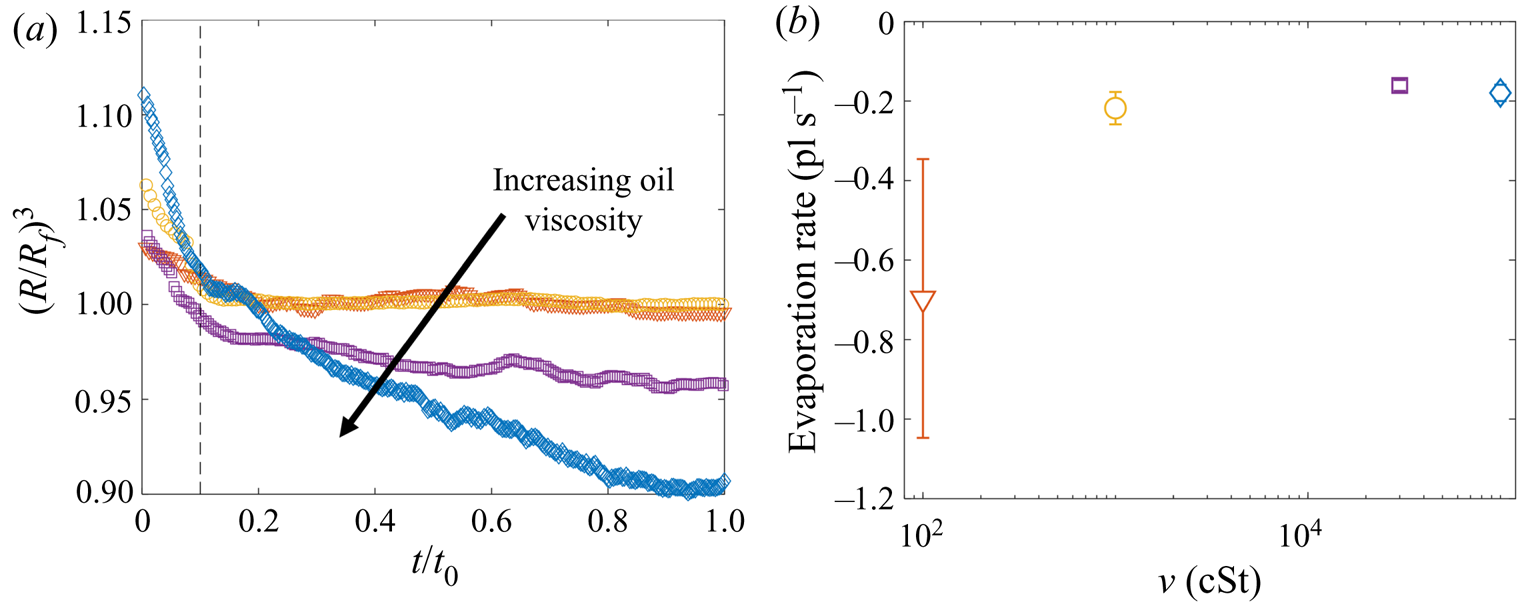
Figure 5. Evaporation of microdroplets. (a) Volume loss quantified by the measured radius  $(R/R_f)^3$, where
  $R$ is the measured radius at time
  $t$ and
  $R_f=38.6\pm 0.4$
  $\mathrm {\mu }$m is the in-flight radius. Engulfment occurred over times
  $t_0$ ranging from 0.7 s for drops on 100 cSt oil to 160 s on
  $10^5$ cSt oil. (b) The evaporation rate is calculated by taking a linear fit to the data in (a) for times
  $t/t_0>0.1$ (dashed line in (a) ).
We note that in ambient conditions, one would expect the rate of evaporation to be proportional to the surface area of the droplet, and therefore to vary in time. The fact that we observe a roughly constant rate of evaporation throughout our experiments may reflect the fact that the decrease in droplet volume over any experiment is small ( $<$10 %); the surface area of each droplet is therefore roughly constant, yielding a fixed rate of evaporation. In addition, as droplets are engulfed and submerged, their ‘ambient surroundings’ (i.e. the oil and air phases) are continuously evolving, which may also affect the rate of evaporation.
3. Results
3.1. Early-time engulfment
During early-time engulfment, or stage 2, the droplet is rapidly submerged beneath the oil layer. We begin in § 3.1.1 by identifying the onset of engulfment (the start of stage 2) by studying impact. We also identify the transition from stage 2 to stage 3 in terms of the evolving oil surface configuration around the droplet. In § 3.1.2 we then investigate the effect of varying droplet size and substrate viscosity on the dynamics of early-time engulfment. Our results suggest the droplet is cloaked in a thin layer of oil early in stage 2, which we discuss further in § 3.1.3.
3.1.1. Start and end of early-time engulfment
Figure 6(a) shows a sequence of side view images of a droplet with  $R_f=1.07$ mm during stages 1 (
 $t<0$) and 2 (
 $0 < t \lesssim 1$ s) of an experiment on oil of viscosity
  $\nu =1000$ cSt. This droplet impacted at a speed
  $U_f=50$ cm s
 $^{-1}$ (although we note that the dynamics of stages 2 and 3 was independent of
  $U_f$ over the range studied; see Appendix A). The dynamics is shown in figure 6(b) in terms of the maximum height
  $H_a$ of the droplet relative to the far-field oil surface (labelled in figure 6a). Stage 1 begins with the impact of the droplet at
  $t=-1.63$ s. Immediately after (
 $t=-1.62$ s), the droplet bounces and is compressed as it again impacts the oil (
 $t=-1.58$ s). These bounces are visible as a scatter of data points at
  $t<-1.5$ s in figure 6(b), which are plotted at timesteps similar to the duration of individual bounces. The basic mechanism for droplet bouncing is similar to that identified for droplets impacting superhydrophobic micro-column surfaces (Richard & Quéré Reference Richard and Quéré2000); an air film trapped beneath the droplet prevents wetting, and hence the kinetic energy of impact is transferred predominantly into droplet surface energy, allowing the droplet to spring back into shape and bounce. In our experiments, the substrate may also deform, resulting in a recoil in the oil surface which likely modifies bouncing. During this early stage, surface capillary waves generated upon each impact deform the droplet, producing the light-bulb shapes visible at
  $t\le -1.58$ s in figure 6(a). The kinetic energy of the droplet is dissipated by bulk viscous stresses within the droplet and oil phases, which oppose the displacement flows driven by the deformations of each surface. After a few (
 $<$3) bounces, the droplet comes to rest on a cushion of air entrained beneath the droplet during the final impact. Small oscillations persist on the droplet's surface, visible for around 0.1 s, after which the droplet appears static while the air cushion drains. The dark band visible at the base of the droplet (
 $t<0$ in figure 6a) is the shadow cast within a crater in the oil surface in which the droplet sits (hence,
  $H_a/2R_f<1$).
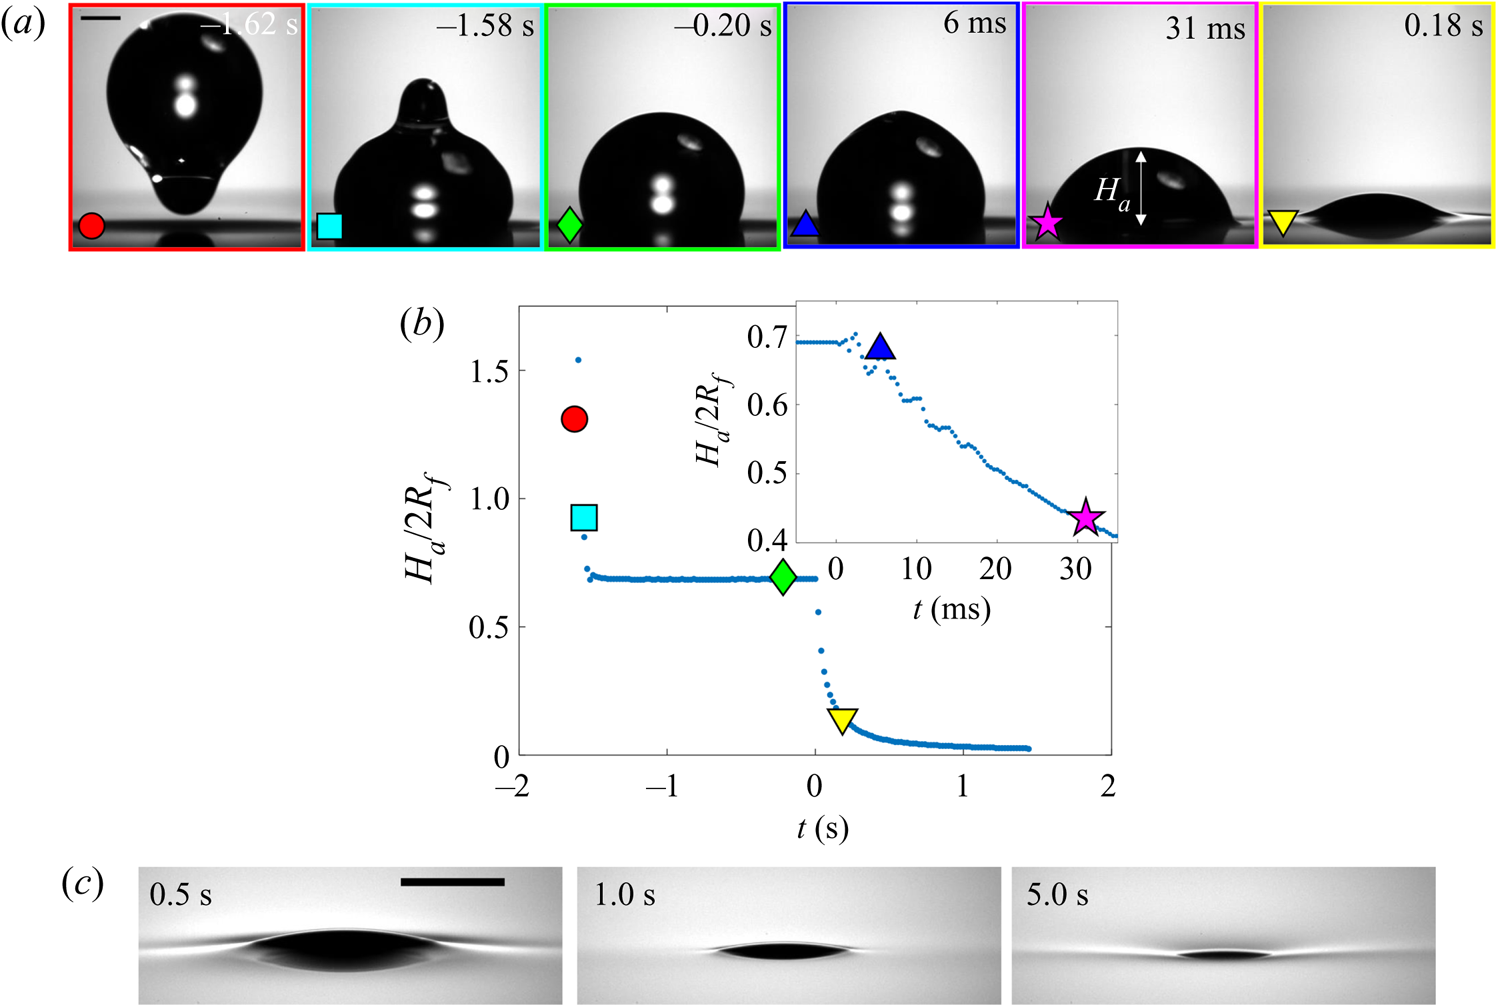
Figure 6. Early-time engulfment dynamics. (a) Time sequence of experimental images depicting stages 1 and 2 of engulfment for a droplet with  $R_f=1.07$ mm deposited onto 1000 cSt PDMS oil. Immediately before impact, the droplet was travelling at speed
  $U_f=50$ cm s
 $^{-1}$. Times are measured relative to the instant at which the air cushion beneath the drop ruptures. The scale bar is 0.5 mm. The maximum height
  $H_a$ of the droplet above the far-field oil level is labelled. The first image (
 $t=-1.62$ s) was taken as the droplet bounced immediately after impact. (b) Time evolution of the normalised height
  $H_a/2R_f$ of the droplet cap above the oil surface (defined in (a) ). Inset: close-up of the data, showing the onset of capillary waves at
  $t=0$; the precision of the measurement of
  $t=0$ is limited by the frame rate, in this case 2400 f.p.s. Large markers correspond to the images shown in (a), with consistent colours used for markers and image borders. (c) Images of a droplet from late in stage 2 (
 $t=0.5$ s) until early in stage 3 (
 $t=5.0$ s). These images were taken during a repeat of the experiment shown in (a), imaged at greater magnification to enhance spatial resolution. Deformation to the oil surface is visible as grey streaks either side of the dark droplet cap. The scale bar is 0.5 mm.
Stage 2 begins at the instant  $t=0$, which we identify by the sudden onset of surface capillary waves (distinct from those observed immediately after impact), driven by the spreading of oil films over the droplet after the air cushion ruptures. The effect of these waves on the height
  $H_a$ of the droplet cap is visible as a series of peaks in the inset of figure 6(b), which shows the data at reduced timesteps close to
  $t=0$. Converging capillary waves meeting at the apex of the droplet produce the unusual peaked shape visible in figure 6(a) at
  $t=6$ ms. Similar deformations are observed for water droplets gently brought into contact with thin films of PDMS oil (Carlson et al. Reference Carlson, Kim, Amberg and Stone2013). By
  $t=31$ ms, the oil surface local to the droplet has inverted: the crater (dark band) has evolved to an upward-inflected skirt of oil. This inversion signals a reversal in the direction of the capillary forces acting on the droplet due to the deformed oil surface: in stage 1, the droplet's weight is supported, while in stage 2 the droplet is pulled down. As the droplet sinks, the oil surface flattens around the droplet (e.g. figure 6a,
  $t=0.18$ s). The vertical component of the capillary forces acting on the droplet therefore reduces and the droplet's descent continually slows. At around
  $t=1.0$ s, the oil surface is almost level around the droplet, as shown in the magnified images of figure 6(c). By
  $t=5.0$ s, however, the oil layer is again deformed, although the surface now curves downwards towards the drop, rather than inflecting upwards. Once again, this inversion of the oil surface corresponds to a reversal in the direction of capillary forces, with the oil surface tension now acting to resist the downwards motion of the droplet. We define this transition, occurring around
  $t=1.0$ s for the drops in figure 6, as the start of stage 3 (see § 3.2).
3.1.2. Effect of droplet size and oil viscosity on early-time engulfment
Figures 7(a) and 7(b) show stage 2 for macro- and microdroplets, respectively, imaged from just below the oil surface. Stage 1 ( $t<0$) was studied for macrodroplets only, because for microdroplets stage 2 initiated immediately upon impact, to within our experimental time resolution of
  $5\times 10^{-5}$ s. We attribute this to rapid drainage of the air cushion, which occurs over shorter time scales for smaller droplets (Couder et al. Reference Couder, Fort, Gautier and Boudaoud2005). Hence, no image is shown in figure 7(b) at
  $t<0$ for microdroplets. In stage 2, a qualitatively similar dynamics is observed for both droplets. They each entrain a (relatively) small air bubble (a remnant of the air cushion), and both are squeezed vertically by viscous resistance in the displaced oil phase. Note that for the macrodroplet at
  $t=0.01$ s, the oil surface curves in towards the droplet (see inset of figure 7a), consistent with oil spreading upwards over the droplet early in stage 2.
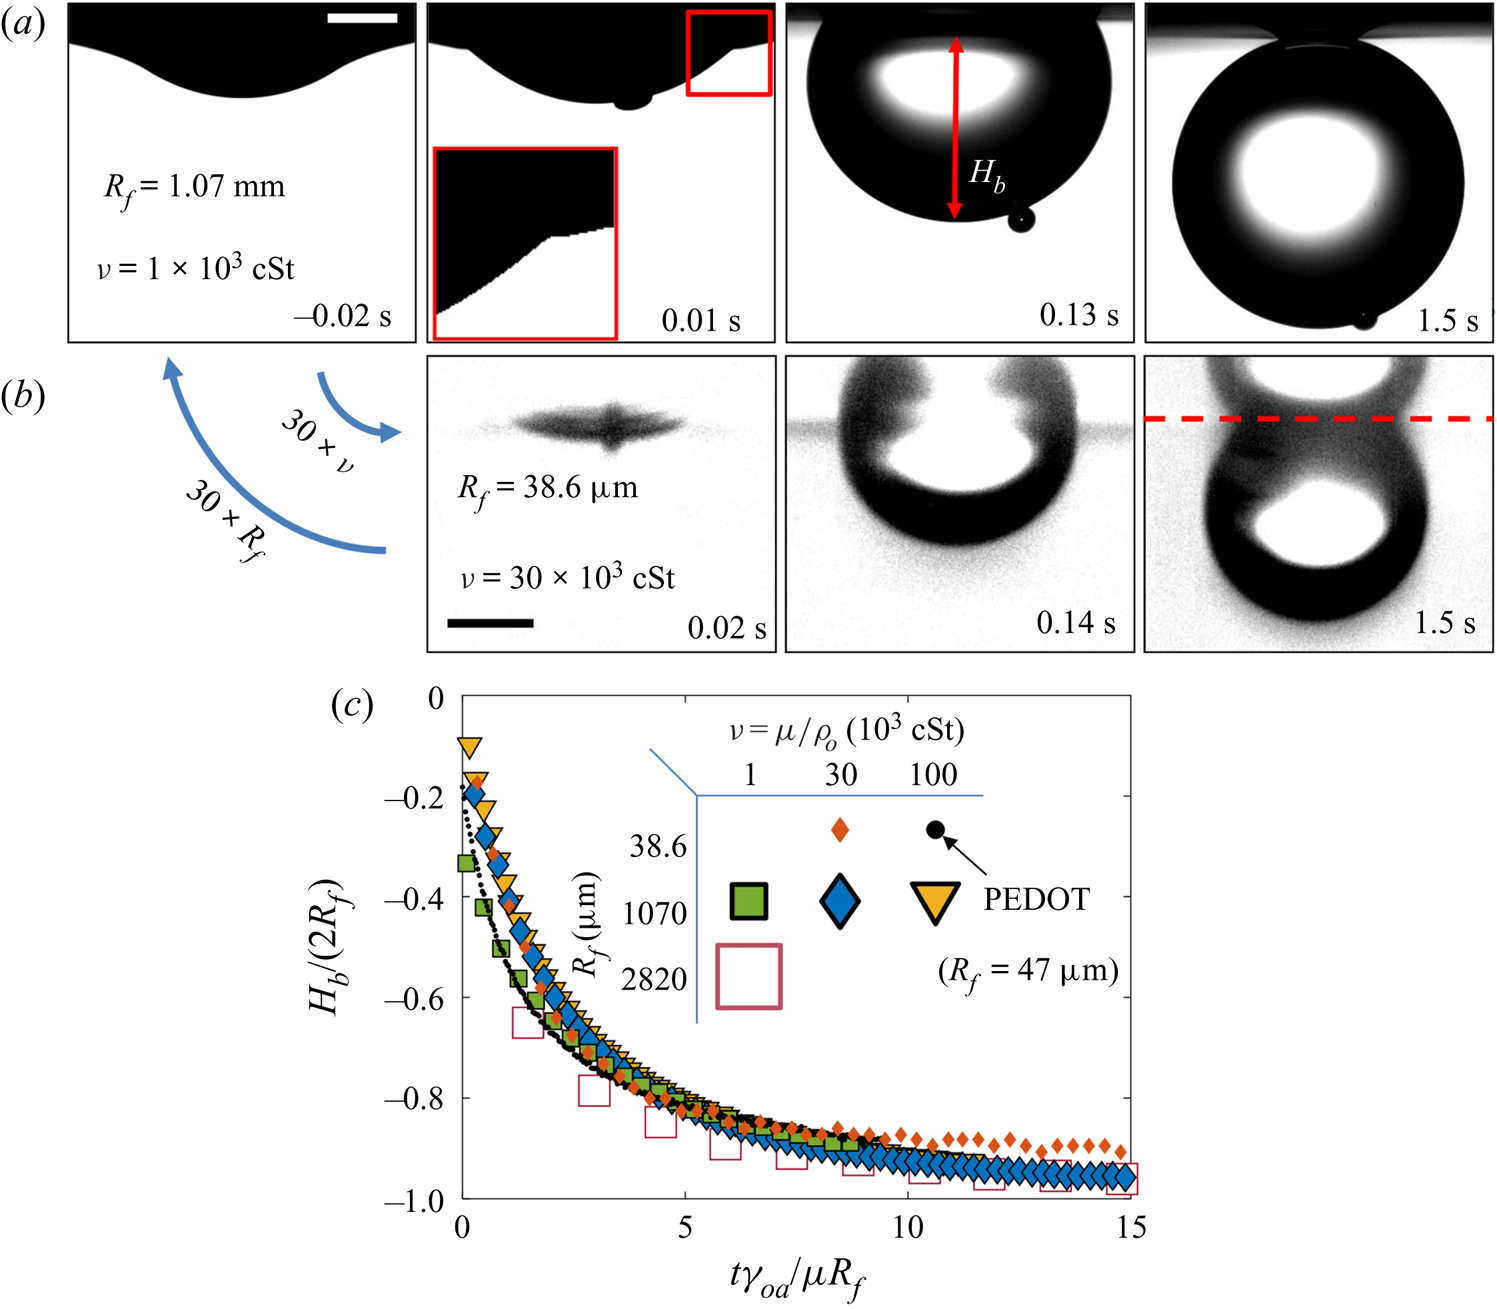
Figure 7. Effect of oil viscosity and drop size on early-time engulfment. (a,b) Experimental images for (a) a macrodroplet with  $R_f=1.07$ mm sinking into 1000 cSt oil and (b) a microdroplet with
  $R_f=38.6$
  $\mathrm {\mu }$m sinking into 30 000 cSt oil. The depth
  $H_b$ of the drop below the initial oil–air surface is labelled. The far-field oil level is indicated by dashed lines in images at
  $t=0.13\text {--}0.14$ s; in (b) the droplet's reflection is visible in the oil surface. The small air bubbles visible are left by the rupture of the air cushion at
  $t=0$. The minimum height
  $H_b$ of the droplet relative to the far-field oil level is labelled in (a). Times are measured relative to the rupture of the air cushion. Inset: a binarised enlarged image of the region indicated by the red box in (a). (c) The rescaled depth
  $H_b/2R_f$ during early engulfment, as a function of rescaled time
  $t/\tau _\gamma$ for drops of various sizes over a range of oil viscosities. The visco-capillary time scale is
  $\tau _{\gamma }=\mu R_f/\gamma _{oa}$;
  $\mu = \nu \rho_o$ and
  $\gamma _{oa}$ are, respectively, the dynamic viscosity and liquid-vapour surface tension of the oil phase. The legend indicates the droplet in-flight radius and oil viscosity for each data set. The black dots are data for a PEDOT ink microdroplet (
 $R_f=47$
  $\mathrm {\mu }$m).
Both droplets in figure 7(a,b) sink over similar time scales, as can be seen from the timestamps on each image. We note also that the macrodroplet has an in-flight radius,  $R_f$, 30 times larger than that of the microdroplet, while the microdroplet sinks into oil which is 30 times more viscous. This evidence suggests a visco-capillary time scale for stage 2,
 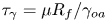 $\tau _{\gamma }=\mu R_f/\gamma _{oa}$, where
  $\mu =\rho _{o}\nu$ is the dynamic viscosity of the oil. (Note that
  $\gamma _{oa}$ and
  $\rho _{o}$ are approximately constant for all PDMS oils; see table 1.) Figure 7(c) shows the dynamics of stage 2, in terms of the minimum height
  $H_b$ of the droplet relative to the oil far-field level (see figure 7a), for viscosities and droplet radii in the ranges 1000 cSt
  $\le \nu \le 10^5 \ {\rm cSt}$, and
  $38.6\ \mathrm {\mu } \textrm {m}\le R_f\le 2.82\ \textrm {mm}$. By rescaling
  $t$ by
  $\tau _{\gamma }$ and
  $H_b$ by
  $2R_f$, we are able to achieve a good collapse of these data. Physically, this suggests that sinking in stage 2 is driven by capillary stresses
  ${\sim }\gamma _{oa}/R_f$ and opposed by bulk viscous stresses resisting the displacement of oil. Moreover, the data for a microdroplet (
 $R_f=47$
  $\mathrm {\mu }$m) of PEDOT on
  $10^5$ cSt oil (black dots) also collapse reasonably well onto the same curve. This suggests early-time engulfment is largely independent of the oil-droplet spreading coefficient
  $S$, which is roughly twice as large for water compared with PEDOT (table 2), being governed instead by the oil properties and droplet size.
3.1.3. Cloaking of the aqueous droplet on oil
In a related study of water droplets brought into contact with thin layers of silicone oil, Carlson et al. (Reference Carlson, Kim, Amberg and Stone2013) note that the droplets should be entirely covered in a thin cloaking layer of oil (since  $S>0$). Furthermore, Carlson et al. (Reference Carlson, Kim, Amberg and Stone2013) suggest that the cloak should form over a time scale
  $\tau _{\gamma }$, the same time scale observed for stage 2 in our experiments (
 ${\sim }20\tau _{\gamma }$). Indeed, Sanjay et al. (Reference Sanjay, Jain, Jalaal, van der Meer and Lohse2019) recently found, in experiments similar to our own, that water macrodroplets on 20 and 200 cSt PDMS oils are completely cloaked within the first 10 ms of stage 2. Given these results, it is reasonable to conclude that our droplets are likely cloaked early in stage 2. This is consistent with the observation that the early-time dynamic scaling in § 3.1.2 is independent of
  $S$; once the cloaking layer has covered the entire droplet surface, the exact differences in surface tension components (i.e. the value of
  $S$) become inconsequential. In the following sections, we extend the discussion of cloaking layers, examining their influence on the dynamics of late-time engulfment.
3.2. Late-time engulfment
3.2.1. Physical description
At the start of stage 3, the droplet hangs beneath the oil surface, as sketched in figure 8(a). The weight of the droplet pulls down on the oil surface, which is adhered to the droplet surface via the thin cloaking layer of oil (see Appendix D for further experimental evidence of adhesive stresses in cloaking layers). Because the droplet is only slightly more dense than the oil, the majority of the droplet's weight is matched by the opposing buoyant force, equal to the weight of the displaced oil. Deformations in the oil surface generate capillary stresses, which pull upwards on the drop; in addition, gradients in curvature along the deformed surface drive a flow which peels the cloak from the droplet surface. Significant viscous stresses are then present within the peeling region coinciding with the apparent contact line (see inset of figure 8a), as with related peeling flows.
Figure 8. (a) Schematic illustration of the system during stage 3. The oil and droplet surfaces meet at an apparent contact line, a height  $h_*$ below the far-field oil level, which encircles a cap-like region of radius
  $r_c$. Inset: viscous resistance is concentrated in a small peeling region close to the apparent contact line. (b) Top: close-up side view image in the region close to the apparent contact line for a droplet with
  $R_f=2.17$ mm on 1000 cSt PDMS oil, taken at
  $t=0.78t_0=54.5$ s. Bottom: profiles of each surface extracted from the boxed region of the image. The apparent inclinations
  $\phi _a$ and
  $\phi _b$ of each surface relative to the horizontal are labelled; respectively,
  $\phi _a$ and
  $\phi _b$ are measured at the points of maximum and minimum gradient along fifth-order polynomials fitted to data points from each surface. Sub-pixel precision was achieved by fitting hyperbolic tangent intensity profiles along each column of pixels; error bars are the corresponding parameter uncertainties from the nonlinear fitting routine.
Since the droplets descend a distance  ${\sim }0.1R_f$ over roughly
  $t_0$ during stage 3, we estimate the characteristic Reynolds number as
 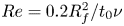 $Re=0.2R_f^2/t_0\nu$ (again taking the in-flight droplet diameter
  $2R_f$ as the length scale). For all experiments
 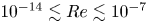 $10^{-14}\lesssim Re\lesssim 10^{-7}$ during stage 3, and we are therefore in the Stokes flow regime. As such, the flows associated with engulfment – that is, the peeling of the cloak and the sinking of the droplet – are driven by the net effect of non-viscous stresses (gravity and capillarity). Viscous stresses then act to oppose any resultant flows and ensure a net force balance at all points.
In the rest of § 3, we examine the effects of gravity, capillarity, and viscosity on the slow engulfment dynamics of stage 3. Our results point to two distinct features which complicate the dynamics of engulfment. First, we find that both gravitational and capillary forces, which drive engulfment in stage 3, evolve continuously over time. Therefore, their relative importance cannot be described by experimental parameters alone, for instance by referring to the Bond number  $Bo=(\rho _{d}-\rho _{o})gR_f^2/\gamma _{oa}$; we must also consider the evolving geometry. Secondly, viscous stresses act not only to oppose the sinking of the droplet, but also determine the peeling dynamics at the apparent contact line, and their effect on the engulfment dynamics is therefore non-trivial. As such, no obvious rescaling of the kind applied to the dynamics of stage 2 (see figure 7) emerges for stage 3. We therefore present and interpret the following results without reference to simplified models which we believe are inappropriate for a system of such complexity.
3.2.2. Effect of droplet size
The time evolution of stage 3 of engulfment is shown in figures 9(a) and 9(b), for drops of all in-flight radii  $R_f$ studied, in terms of the depth
  $H_b$ of the droplet relative to the far-field oil level and the radius
  $r_c$ of the cloaked droplet cap (see figure 8a). These experiments were conducted using
  $1000$ cSt PDMS oil. During stage 3, the rate at which a droplet is engulfed varies continuously, both in terms of
  $H_b(t)$ and
  $r_c(t)$. For all droplets, we observe an initial decrease in the rate of engulfment. For macrodrops, this slowing persists for around half of the experimental duration
  $t_0$, reaching an inflection where the gradients of
  $r_c(t)$ and
  $H_b(t)$ take minimum values, before the rate of engulfment begins to increase up to the instant of detachment from the oil surface,
  $t_0$. For the microdroplet, however, there is no clear evidence of a final increase in the rate of engulfment, with engulfment appearing to slow continually throughout stage 3. We note, however, that for microdroplets (
 $R_f=38.6$
  $\mathrm {\mu }$m), measurements of the cap radius
  $r_c$ could only be taken before it reduced to around 1
  $\mathrm {\mu }$m. Beyond this point, the perimeter of the cap became too faint to distinguish visually, disappearing entirely at around
  $t\approx t_0/2$, and becoming once again visible as a small bright spot from
  $t\approx 3t_0/4$. The instant of detachment
  $t_0$ (large symbol in inset of figure 9b) was identified by the sudden fading of this bright spot, which was verified to coincide with detachment through observations of side view images.
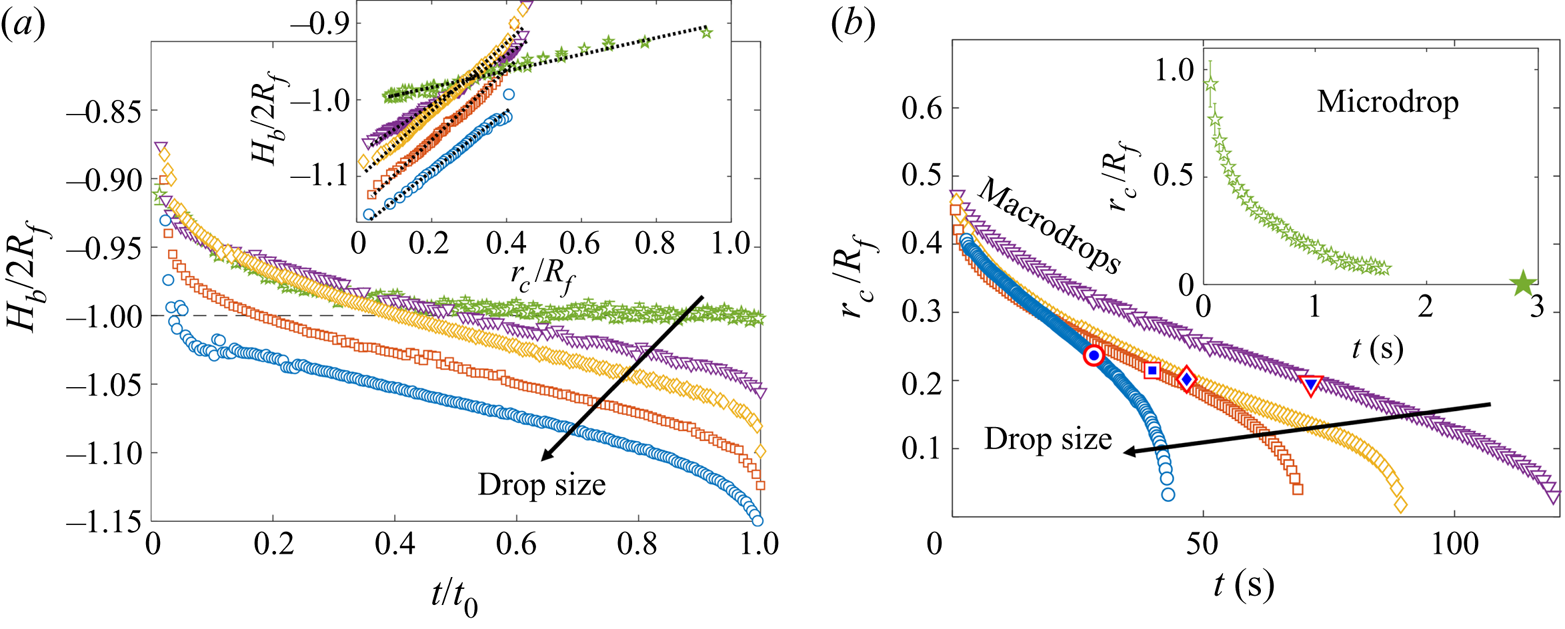
Figure 9. (a,b) Sinking and spreading dynamics for drops of various in-flight radii  $R_f$, on 1000 cSt PDMS oil. Each experiment was repeated at least three times, with the total engulfment time
  $t_0$ reproducible to within
  $\pm$6 %. Due to the increasing spread of data late in stage 3 (
 $t>0.5t_0$), we show a single experimental set for each size of macrodrop, rather than the mean over three repetitions of the experiment, as shown for microdrops. Arrows indicate increasing
  $R_f$. (a) Time evolution of the normalised droplet depth
  $H_b/2R_f$ for drops of
  $R_f=38.6$
  $\mathrm {\mu }$m and 1.07, 1.77, 2.17, 2.82 mm. Time is normalised by the total experimental duration
  $t_0$. Inset: comparison between
  $r_c$ and
  $H_b$ for each drop. Dotted lines are least-square fits of a linear function. (b) Time evolution of normalised cap radius
  $r_c$ for macrodrops (
 $R_f>1$ mm) and (inset) a microdroplet (
 $R_f=38.6$
  $\mathrm {\mu }$m). The large star on the horizontal axis of the inset figure indicates
  $t_0$ for the microdroplet. Target symbols on the macrodrop data correspond to
  $t=t_m$, the time at which the measured buoyant force is a maximum (see figure 10a).
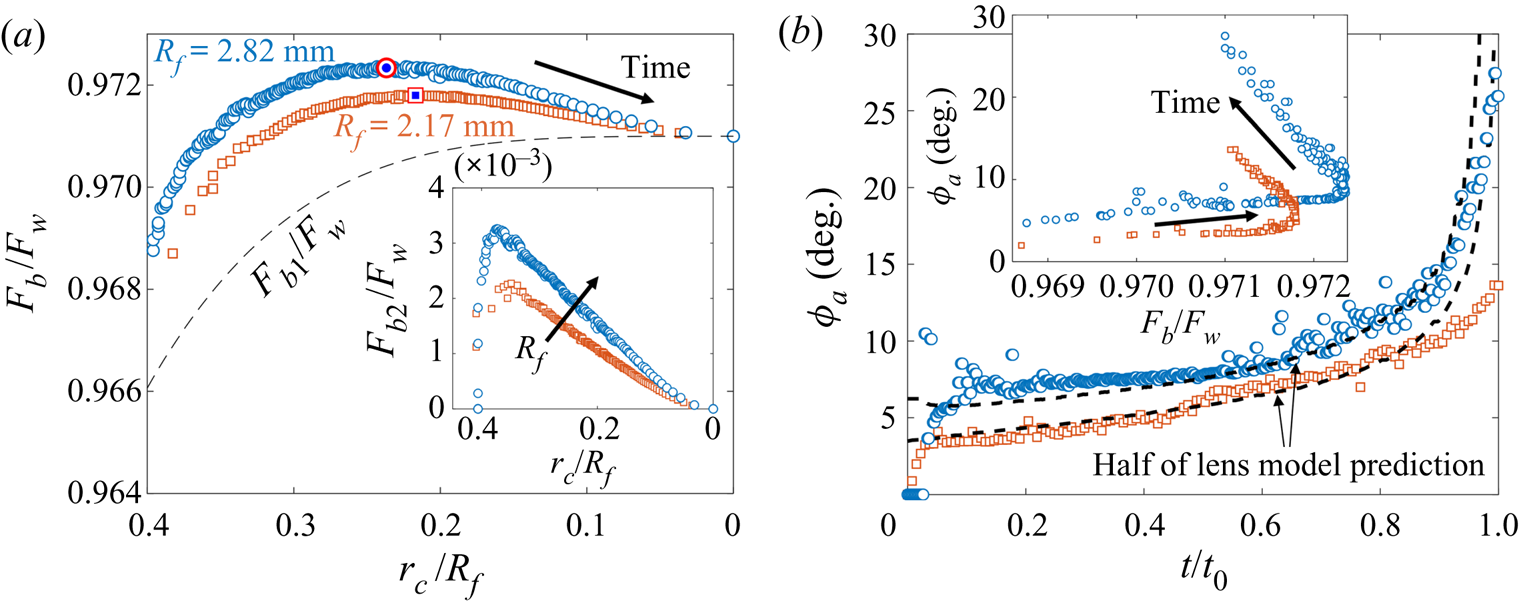
Figure 10. (a) Total buoyant force  $F_b=F_{b1}+F_{b2}$ as a function of
  $r_c/R_f$ for droplets of in-flight radii
  $R_f=2.17$ mm (squares) and 2.82 mm (circles) on
  $1000$ cSt PDMS oil. Symbols are consistent with (b). Forces are normalised by the droplet weight
  $F_w$. The dashed line is
  $F_{b1}$, the contribution due to the oil displaced in volume
  $V_1$, which is shown in figure 8(a). The maximum values of
  $F_b$, determined from a fifth-order polynomial fit to the data, are indicated by target symbols. The arrow indicates increasing time. Inset: the contribution
  $F_{b2}$ due to
  $V_2$ as a function of
  $r_c/R_f$. The arrow indicates increasing
  $R_f$. (b) Time evolution of the oil surface inclination
  $\phi _a$ for the same data as shown in (a). Dashed lines are half the value
  $\phi _a^{lens}$ predicted for a liquid lens. Inset: comparing the evolution of
  $\phi _a$ and
  $F_b/F_w$ for the same two drops.
The inset of figure 9(a) shows  $r_c/R_f$ plotted against
  $H_b/2R_f$ for each of the droplets; least-square fits of the form
  $H_b/2R_f=Ar_c/R_f+B$, shown as dotted lines, suggest
  $H_b$ is linearly related to
  $r_c$ at all times. Therefore, while we cannot directly image the apparent contact line for the microdroplet for
  $t\gtrsim t_0/2$, the continuous slowing of sinking up to
  $t_0$ (figure 9a) suggests a continuous slowing of spreading dynamics (figure 9b) as well. We note that as
  $R_f$ is increased, the gradient (
 $A$) increases from around 1/10 for microdroplets to an almost constant value of
  $\sim$1/2 for the largest macrodroplets studied.
Reducing the drop size, or  $R_f$, reduces the Bond number
  $Bo=(\rho _{d}-\rho _{o})gR_f^2/\gamma _{oa}$, a commonly used measure of the relative strength of gravitational versus capillary stresses. This is reflected in the sinking dynamics shown in figure 9(a); an increase in
  $R_f$ results in an overall downward shift in the normalised depth
  $H_b/2R_f$. Physically, this corresponds to larger droplets hanging further below the far-field oil level, an indication that the droplets’ weight pulls down on the oil surface. In turn, the surface deforms in response to the net effect of the droplet weight and buoyancy, generating an opposing capillary force. For droplets with
  $R_f\le 1.77$ mm (the top three curves in figure 9a), the curves overlap at
  $t\lesssim 0.4t_0$; the difference between droplet weights is therefore not strongly reflected in the relative deformation of the oil surface at the start of stage 3, a consequence of the dominant capillary stresses for small
  $R_f$ (and
  $Bo$). However, the difference in
  $R_f$ for the smallest droplets becomes apparent later in stage 3, visible as a divergence of the top three curves in figure 9(a). This is due to capillary forces diminishing as oil spreads over the drop, reducing the radius
  $r_c$ of the apparent contact line, about which the capillary stresses are localised. The relative dominance of capillary and gravitational stresses is therefore dependent not only upon the size of the droplet (or
  $Bo$), but also on the extent of engulfment, due to the diminishing size of the contact line.
3.2.3. Evolution of gravitational and capillary forces
The total force with which the droplet pulls on the oil surface is determined by the net effect of the droplet weight  $F_w=4/3\pi R_f^3\rho _{d}g$ plus the buoyant force
  $F_b$ due to displaced oil, which act in opposite directions to one another. Consistent with previous studies of droplets suspended at interfaces (Phan et al. Reference Phan, Allen, Peters, Le and Tade2012, Reference Phan, Allen, Peters, Le and Tade2014), we estimate the instantaneous value of
  $F_b$ by assuming it is equal to the weight of oil displaced within the regions
  $V_1$ and
  $V_2$ sketched in figure 8(a), such that
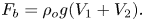 \begin{equation} F_b=\rho_{o} g(V_1+V_2). \end{equation}
The lower volume  $V_1$ occupied by the droplet below the apparent contact line is closely approximated by a spherical cap of radius
  $R_f$ and base radius
  $r_c$ (see § 3.2.4), while the upper volume
  $V_2$ between the apparent contact line and the far-field oil level is a cylinder of height
  $h_*$ and radius
  $r_c$. The weight of oil displaced in the meniscus outside the apparent contact line is then equivalent to the total capillary force acting at the apparent contact line (Keller Reference Keller1998). Through side view images, we were able to measure
  $h_*$, the height at which the oil surface meets the droplet, and top view images provide measurements of
  $r_c$, which yield
  $F_b/F_w$ through (3.1). We plot the quantity as a function of
  $r_c/R_f$ in figure 10(a) for the two largest droplets studied (
 $R_f=2.17$ and 2.82 mm). Since
  $r_c$ decreases monotonically in time, this representation is equivalent to the time evolution of
  $F_b/F_w$. We consistently observe a non-monotonic variation in
  $F_b/F_w$ over each experiment, with
  $F_b/F_w$ reaching a maximum value (at a time
  $t_m < t_0$), before decreasing to a final value of
  $\rho _{o}/\rho _{d}\approx 0.971$ as the droplet detaches from the oil surface at
  $r_c=0$ (equivalent to
  $t=t_0$). The maximum value of
  $F_b/F_w$ for each data set is indicated by a target symbol. The corresponding point at
  $t=t_m$ is indicated in the same way for each macrodroplet in figure 9(b), showing that the maximum value of buoyancy approximately coincides with the inflection point of
  $r_c(t)$. We note that the non-monotonicity of
  $F_b/F_w$ is due entirely to the contribution to buoyancy
  $F_{b2}=\rho _{o} g V_2$ (shown in the inset of figure 10a) due to the volume
  $V_2$ displaced by the droplet as it pulls down on the oil surface. By contrast, the contribution
  $F_{b1}=\rho _{o}gV_1$ (dashed line in figure 10a) due to the volume displaced below the apparent contact line depends only on
  $r_c/R_f$ and increases monotonically as oil spreads to cover more of the droplet.
We can also estimate the instantaneous capillary force  $F_c$ acting upwards on the droplet by integrating the vertical component of air–oil surface tension around the apparent contact line, which yields
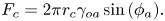 \begin{equation} F_c=2\pi r_c\gamma_{oa}\sin{(\phi_a)}. \end{equation}
Here,  $\phi _a$ is the apparent inclination of the oil surface relative to the horizontal, measured in the vicinity of the contact line, as indicated in the inset of figure 8(a). The angle is extracted from profiles like the ones shown in figure 8(b), by fitting fifth order polynomials to the points fitted to the oil–air surface and recording the inclination at the apparent point of inflection close to the contact line. The measured values of
  $\phi _a$ are plotted in figure 10(b). For clarity, we only show data for the two largest droplets studied. As shown in the inset of figure 10(b), where we have plotted
  $\phi _a$ as a function of the normalised buoyant force
  $F_b/F_w$, the slow initial increase in
  $\phi _a$ (
 $t\lesssim 0.6t_0$) coincides with the increase in
  $F_b$ observed for the first part of the experiment. Here, the reduction in the capillary force due to the reduction in
  $r_c$ associated with the advancing contact line is partially compensated for by an increase in
  $F_b$, and the surface inclination remains roughly constant. After
  $F_b$ reaches a maximum and begins to wane, the increase in
  $\phi _a$ is far more pronounced for both drops (figure 10b inset), as the surface reacts to a decrease in both
  $r_c$ and
  $F_b$. The surface therefore seems to deform in response to variations in both the effective weight of the drop and the geometry of the apparent contact line.
Since we are able to estimate both  $F_c$ and
  $F_b$, we may examine this observation more closely by comparing the instantaneous configuration of the system to the analogous liquid lens equilibrium state of partially wetting droplets (i.e. water on vegetable oil; Phan et al. Reference Phan, Allen, Peters, Le and Tade2012, Reference Phan, Allen, Peters, Le and Tade2014); in the latter case,
  $F_c=F_w-F_b$, i.e. the surface around the droplet deforms to exactly oppose the effective weight of the droplet. From (3.1) and 3.2 we can therefore calculate the inclination
  $\phi _a^{lens}$ for a liquid lens at equilibrium
 \begin{equation} \phi_a^{lens} = \arcsin{\left(\frac{F_w-F_b}{2\pi r_c\gamma_{oa}}\right)}. \end{equation}
Equation (3.3) is an overestimate as it assumes the droplet's effective weight is opposed by capillarity only and ignores viscous stresses. However, the qualitative behaviour is close to what we observe in experiments and in fact the quantitative agreement is very good for  $\phi _a^{lens}/2$, as shown by the dashed lines in figure 10(b); these lines were calculated from (3.3) using experimental values of
  $r_c(t)$ and
  $F_b(t)$ for each drop. By halving the predicted value
  $\phi _a^{lens}$, we are able to achieve strong agreement with experimental values of
  $\phi _a$ over the majority of each experiment. The qualitative agreement suggests that the surface deforms in such a way as to provide a reaction force to the effective weight
  $F_w-F_b$ of the droplet, responding to variations in both
  $F_b$ and
  $r_c$.
Since the predicted value  $\phi _a^{lens}$ is around half the experimental value
  $\phi _a$, this suggests that only half of the effective weight is accounted for by capillarity. As the system obeys Stokes flow (
 $Re\ll 1$) there must be a net force balance at all times, with the remaining instantaneous upwards force on the droplet due to viscous resistance. The observation that viscous forces are, throughout stage 3, approximately equal in magnitude to capillary forces acting on the droplet may reflect the presence of flows in the oil phase driven by gradients in capillary stresses along the deformed oil surface. We are, however, unable to comment on the specifics of any such flows, although by dusting the oil surface with microscopic polymer beads to act as tracer particles prior to depositing droplets, we were able to observe flows driven radially inwards along the oil surface towards the droplet, which recirculated downwards along the droplet surface close to the apparent contact line. While these experiments hint at the existence of complex recirculation flows within the peeling region, we are unable to present a detailed study of such flows due to the sensitivity of interfacial mechanics to particle perturbations. Instead, we will proceed in the following section to examine the peeling flow around the apparent contact line, for which we have sufficient experimental evidence.
3.2.4. Peeling dynamics at the advancing contact line
The spreading of oil over the droplet cap during stage 3 is analogous to classical spreading or peeling phenomena (Bonn et al. Reference Bonn, Eggers, Indekeu, Meunier and Rolley2009; Lister et al. Reference Lister, Peng and Neufeld2013), with the cloaking layer acting as a precursor film. As such, variations in curvature local to the apparent contact line drive a peeling flow. Hence, by studying how surface deformations respond to either changing the size of the droplet or the evolving geometry around the apparent contact line, we can rationalise many of the dynamical features of engulfment discussed in § 3.2.2. The extent of surface deformations at any instant may be inferred largely from the apparent contact angle  $\theta _c$ and the radius
  $r_c$ of the apparent contact line (see figure 8a). It should be noted that as the droplet is engulfed and
  $r_c$ tends to zero, variations in
  $r_c$ will become increasingly important; however, consistent with previous studies of peeling flows, we find that much of the observed variations in engulfment dynamics (both over time and for different size drops; see figure 9) may be interpreted through considering only the evolution of the apparent contact angle
  $\theta _c=\phi _a+\phi _b$ (see inset of figure 8a).
Figure 11 shows the time evolution of  $\theta _c$,
  $\phi _a$ and
  $\phi _b$ (see labels) for the two largest droplet sizes studied. The first component,
  $\phi _a$, has already been discussed and indicates deformation of the oil surface in response to the droplet's effective weight. It is therefore dependent on the size of the droplet (more specifically, the Bond number
  $Bo$), as well as the relative size of the apparent contact line,
  $r_c/R_f$. To illustrate this, we recall that
  $\phi _a\approx \phi _a^{lens}/2$ (an experimental observation; see (3.3)). Due to the cloaking layer, the droplet is completely submerged during stage 3, and
  $F_b\approx 4/3\pi R_f^3\rho _{o} g$. We therefore have
 \begin{equation} \phi_a\approx\frac{1}{2}\arcsin{\left(\frac{2Bo}{3r_c/R_f}\right)}. \end{equation}
While (3.4) neglects the subtle evolution of  $F_b$ (see § 3.2.3), it nonetheless captures the essential dependence of surface deformations on the size of the droplet, as well as the monotonic increase in
  $\phi _a$ over stage 3 as
  $r_c$ decreases (figure 11).
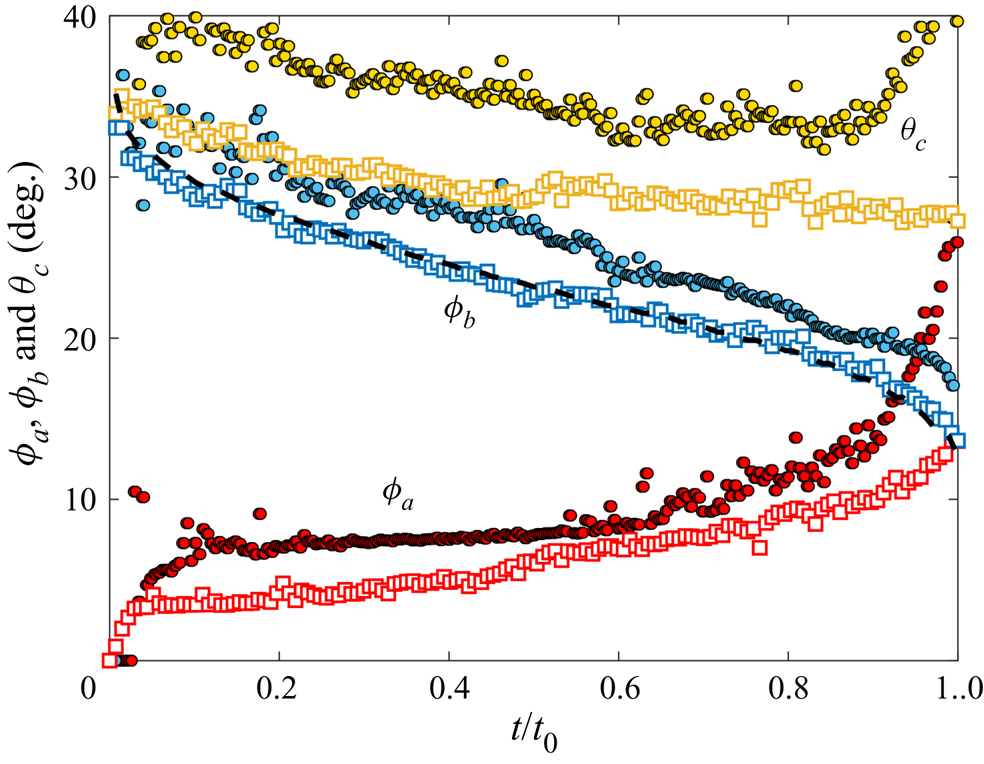
Figure 11. Time evolution of  $\phi _a$ and
  $\phi _b$ (red and blue points) and the apparent contact angle
  $\theta _c=\phi _a+\phi _b$ (yellow points) for the same data shown in figure 10. Circles and squares are data points corresponding to droplets with
  $R_f=2.82$ mm and
  $R_f=2.17$ mm, respectively. The dashed line is (3.5), plotted with experimental data for the smaller droplet, with
  $\phi _{b0}=13.1^{\circ }$.
The second component  $\phi _b$, meanwhile, decreases monotonically due to geometric constraints; as the contact line moves inwards, towards the apex of the drop,
  $\phi _b$ must reduce as the local surface of the droplet becomes increasingly level. The portions of the droplet surface above and below the contact line are described (in the absence of gravity) by spherical caps (Phan et al. Reference Phan, Allen, Peters, Le and Tade2014). Because almost all of the droplet in stage 3 is below the contact line, we would expect the lower portion of the droplet to approximate a spherical cap of radius
  $R_f$ and base radius
  $r_c$. In this case,
 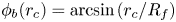 $\phi _b(r_c) = \arcsin {(r_c/R_f)}$, and hence
  $\phi _b$ tends to zero at
  $t=t_0$ (and
  $r_c=0$). However, in practice our droplets hang from the surface in a deformed pendant shape due to their weight stretching them vertically. This results in a constant offset angle
  $\phi _{b0}$ such that
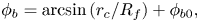 \begin{equation} \phi_b= \arcsin{(r_c/R_f)}+\phi_{b0}, \end{equation}
as shown in figure 11 where we have plotted (3.5) (dashed line) for the smaller droplet; here, choosing  $\phi _{b0}=13.1^{\circ }$ produces the best fit to the data. The offset
  $\phi _{b0}$ decreases for smaller droplets (lower
  $Bo$) as capillary stresses become dominant over gravitational effects and the droplet shape becomes increasingly spherical.
We can empirically approximate  $\theta _c$ using (3.4) and (3.5), which gives
 \begin{equation} \theta_c\approx\frac{1}{2}\arcsin{\left(\frac{2Bo}{3r_c/R_f}\right)} +\phi_{b0}+\arcsin{\left(\frac{r_c}{R_f}\right)}. \end{equation}
The first and second terms on the right-hand side enhance spreading, in the sense that they yield increasing deformations (larger  $\theta _c$) for larger droplets or as the apparent contact line advances (
 $r_c$ reduces). Both of these terms depend directly on the size of the droplet (or
  $Bo$). The third term, meanwhile, suppresses spreading (deformations reduce with
  $r_c$) and depends only on the geometry of the contact line, through
  $r_c/R_f$. The inflection of
  $r_c(t)$ observed for macrodroplets (figure 9b) is therefore due to a competition between the first and third terms, which are associated with
  $\phi _a$ and
  $\phi _b$, respectively. The initial slow increase in
  $\phi _a$ is outpaced by the (purely geometric) reduction in
  $\phi _b$, resulting in weaker deformations and slowing engulfment. Later, the rapid increase in
  $\phi _a$ in response to the waning capillary and buoyant forces (see figure 10b) corresponds to faster engulfment.
The contrasting engulfment dynamics observed for microdroplets (i.e. no inflection of  $r_c(t)$ or
  $H_b(t)$; see figure 9) may also be interpreted within this framework. Since
  $Bo\ll 1$, microdroplets are almost perfectly spherical and
  $\phi _{b0}\approx 0$. Moreover, if
  $Bo\ll r_c/R_f$ then from (3.4) and (3.6) we expect
  $\phi _a\approx 0$ (the surface hardly deflects) and
 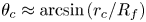 $\theta _c\approx \arcsin {(r_c/R_f)}$; hence, deformations will diminish over time and engulfment will slow continuously as
  $r_c$ reduces. The final detachment of the droplet and oil surfaces is nonetheless due to gravity-driven deformations, consistent with the predicted increase in
  $\phi _a$ for
  $r_c/R_f\lesssim Bo$ (3.6). For microdroplets (
 $Bo\ll 1$) this must occur so close to detachment that we cannot observe it in practice. However, this argument demonstrates that gravity is central to the engulfment process for any size of droplet because
  $r_c/R_f$ will always tend to zero (and therefore become
  $ < Bo$) due to peeling.
We note that for peeling flows, the apparent contact angle generally dictates the velocity of the peeling front (i.e. the contact line; see Ducloué et al. Reference Ducloué, Hazel, Pihler-Puzović and Juel2017). However,  $\theta _c$ remains approximately constant for the smaller of the two droplets represented in figure 11 for
  $t\gtrsim 0.6t_0$, while at the same time the rate of engulfment increases. This suggests that the speed of the apparent contact line is not strongly dependent on variations in
  $\theta _c$ late in stage 3, at least for the smaller droplet. As already noted, to gain a fuller picture of the peeling flow one would need to consider surface deformations not captured by
  $\theta _c$ alone, which is beyond the scope of this study. The analysis presented in this section nonetheless illustrates the basic driving mechanisms of the flow; that is, gravitational forces and geometric constraints.
3.2.5. Effect of droplet size on engulfment time
Figure 12 shows the relation between droplet size  $R_f$ and engulfment time
  $t_0$. The maximum
  $t_0$ occurs for the smallest macrodrops with
  $R_f=1.07$ mm. Increasing
  $R_f$ for macrodrops then results in faster engulfment (lower
  $t_0$), while the microdrop with
  $R_f=38.6$
  $\mathrm {\mu }$m is engulfed much faster than any of the macrodrops. This non-monotonic trend reflects two competing effects of increasing the droplet size. At high
  $Bo$ (macrodrops), larger droplets generate greater deformations in the oil surface, which drives faster engulfment, as already discussed. At very low
  $Bo$, however, such gravitational effects are negligible, and increasing the size of the droplet predominantly acts to increase the area of the droplet over which oil must spread. Hence, for microdrops we expect slower engulfment for increasing
  $R_f$. In agreement with figure 12, this result also implies that there is a critical value of
  $R_f$ at which the time taken to engulf a droplet reaches a maximum.
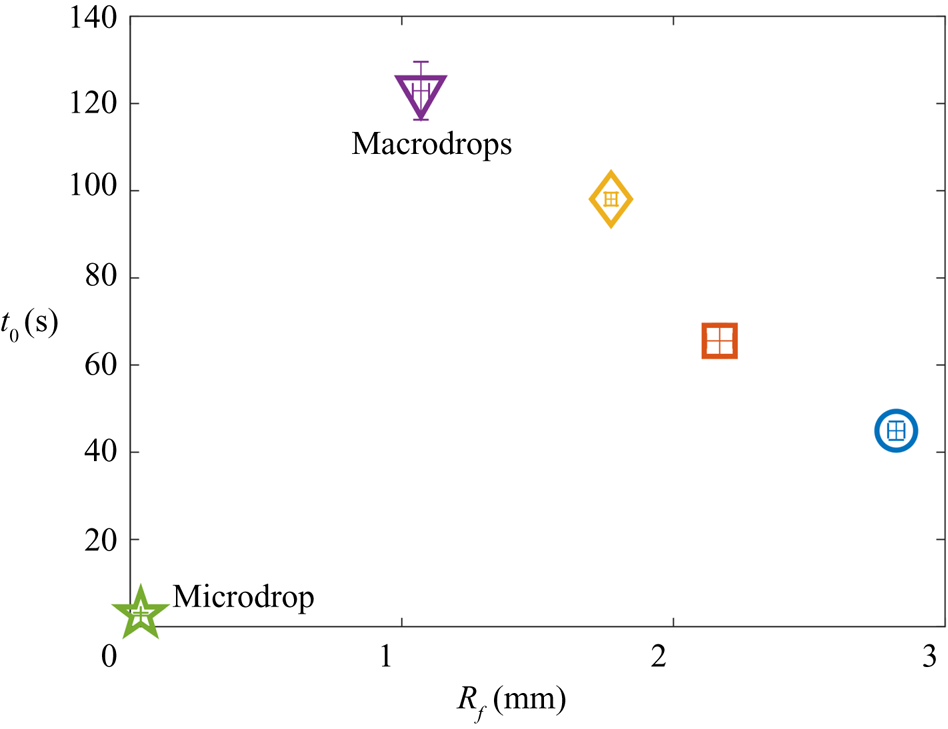
Figure 12. Total experimental duration  $t_0$ for each
  $R_f$ studied. Vertical error bars are the standard deviations of at least three repetitions of the experiments.
3.2.6. Effect of oil viscosity
The time evolution of the cap radius  $r_c$ on oils of different kinematic viscosity
  $\nu$ is shown in figures 13(a) and 13(b) for microdroplets with
  $R_f = 38.6$
  $\mathrm {\mu }$m and macrodroplets with
  $R_f = 1.07$ mm, respectively. For these experiments, we used PDMS oils of viscosities
  $\nu =100$, 1000, 30 000 and 100 000 cSt. The main effect of increasing
  $\nu$ is to slow the engulfment of the droplet, as expected, which is reflected in an increase in the experimental duration
  $t_0$. We note that macrodroplets deposited onto 100 cSt oil (blue circles in figure 13a,b) show distinct dynamics compared with the other (larger) viscosities; most notably, the normalised cap radius
  $r_c/R_f$ is significantly lower at early times
  $t<0.5t_0$ (see inset of figure 13b). This may reflect the fact that
  $\nu =100$ cSt is around the threshold value
  $\nu _{threshold}$ at which we expect the initial conditions of stage 3 to be significantly affected by inertia–capillary effects (see figure 15 in Appendix B). For all
  $\nu$ tested, the dynamics of engulfment for macro- and microdrops is qualitatively similar to that described in the previous section for drops on
  $1000$ cSt oil. The insets of figures 13(a) and 13(b) show the same data with time normalised by
  $t_0$, to allow for qualitative comparison of the data at different
  $\nu$.
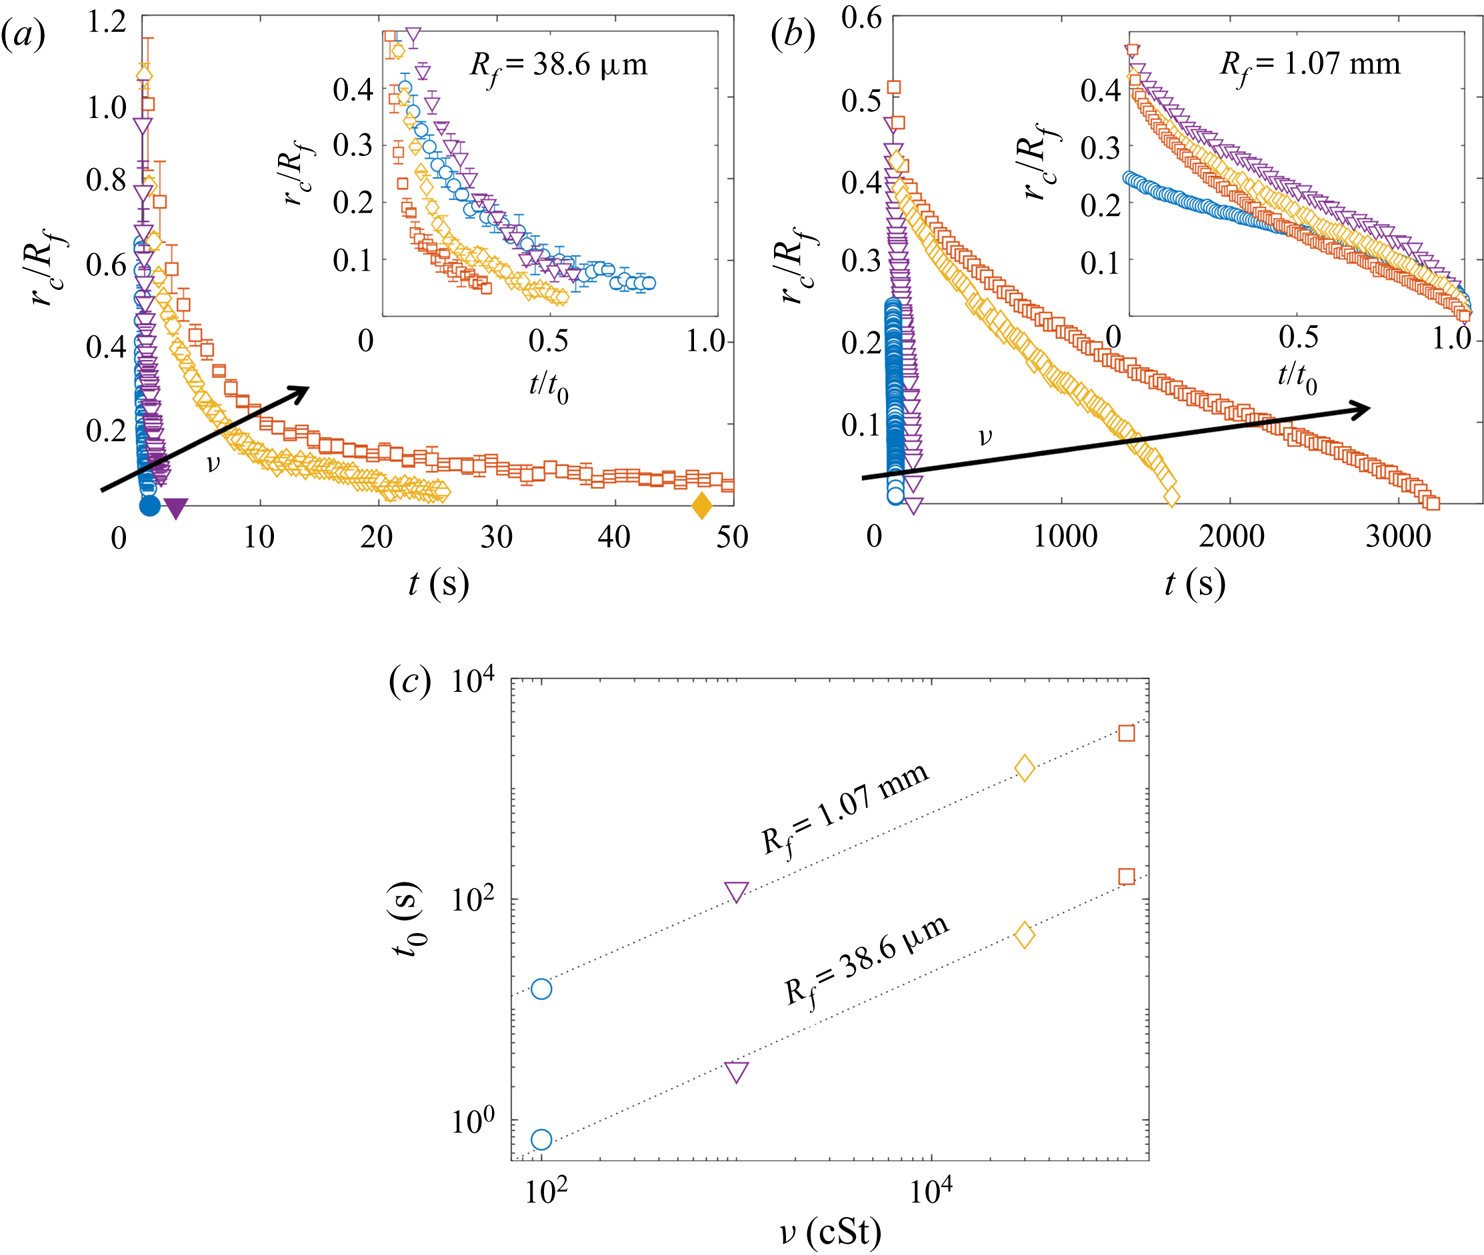
Figure 13. The effect of oil viscosity  $\nu$. Panels (a,b) show the time evolution of the normalised apparent contact line radius
  $r_c/R_f$ for (a) microdrops with
  $R_f=38.6$
  $\mathrm {\mu }$m and (b) macrodrops with
  $R_f=1.07$ mm deposited on oils of viscosities
  $\nu =100$, 1000, 30 000 and 100 000 cSt. Arrows indicate increasing
  $\nu$. The insets show the same data with time normalised by the experimental duration
  $t_0$. Solid symbols in (a) indicate
  $t_0$ for each experiment; data at
  $t_0$ are not plotted for the highest
  $\nu$ experiment, for the sake of clarity. Panel (c) shows
  $t_0$ as a function of
  $\nu$ for the data in (a,b). Dotted lines are least-square fits of the form
  $t_0\sim \nu ^\alpha$, where
  $0.77\le \alpha \le 0.8$.
In figure 13(c), the total experimental duration  $t_0$ is plotted against
  $\nu$ for each of the drop sizes. The dashed lines are least-squares fits of the form
  $t_0\sim \nu ^\alpha$ (note the logarithmic scales). For
  $R_f=38.6$
  $\mathrm {\mu }$m and 1.07 mm, we find similar values of
  $\alpha =0.77$ and
  $0.80$, respectively. Hence, doubling the oil viscosity results in the droplet being engulfed in somewhat less than double the time. Compare this to our observations of stage 2 (see § 3.1), for which the time scale
  $\tau _{\gamma }=\mu R_f/\gamma _{oa}$ scales linearly with oil viscosity; the nonlinear scaling (
 $\alpha \neq 1$) of stage 3 suggests that the effect of
  $\nu$ is not simply to oppose bulk displacement of the oil phase. We speculate that these effects originate in the cloaking layer of oil covering the droplet. At equilibrium, the thickness of the cloaking layer would be determined by a balance between disjoining pressure and capillary pressure in the film, neither of which should depend strongly on oil viscosity. However, the dynamical spreading process which forms the cloak may well result in an initial film thickness which depends on
  $\nu$, as is generally the case for coating flows (Landau & Levich Reference Landau and Levich1942; Bretherton Reference Bretherton1961). The cloaking layer acts as a precursor film as oil spreads to cover the droplet in stage 3; hence, variations in the thickness of the film could modify the time scale of engulfment.
4. Conclusion
We have studied the engulfment of an aqueous droplet deposited on a deep layer of oil which wets the droplet perfectly. Our study focuses on the evolution of the droplet and the oil surface from the instant they first make contact until the instant they detach. We have identified two key stages in this evolution: an earlier stage (stage 2), driven by capillarity and opposed by bulk viscous stresses in the oil, during which the droplet is rapidly pulled beneath the level of the oil surface; and a subsequent stage (stage 3) driven by a coupling between gravity and capillarity as the system slowly evolves towards the instant when the droplet detaches from the oil surface and sinks. Our study of stage 3 in particular revealed several unexpected features of engulfment. By comparing our unstable but slowly evolving system with a stable liquid lens in § 3.2.3, we showed that the viscous and capillary forces acting instantaneously on the droplet over much of stage 3 contribute equally to oppose the weight of the droplet. We then studied the gradual spreading of the apparent contact line in stage 3 as a peeling flow. We found that the opposing effects of geometry and gravity resulted in a maximum engulfment time  $t_0$ for droplets of intermediate size (around 1 mm in radius).
By contrast with studies of droplets penetrating immiscible liquid layers due to impact conditions (Wang et al. Reference Wang, Wang, Yu and Chen2020), the dynamics of engulfment as presented here is entirely independent of impact (see Appendix A), driven instead by unsteadily evolving gravitational and capillary forces, with oil viscosity having a non-trivial effect on the time scale of engulfment (see § 3.2.6). A key feature of the system in determining this complex dynamics is the presence of the cloaking layer of oil over the droplet formed early in stage 2. To our knowledge, only one previous study has examined the dynamical formation of cloaking layers (Sanjay et al. Reference Sanjay, Jain, Jalaal, van der Meer and Lohse2019). Our work continues the story, demonstrating that the subsequent peeling of the cloaking layer from the droplet surface is itself a remarkably complex and subtle process.
Our study of individual droplets has implications for more complicated, coupled systems. During stage 3, for instance, the droplet remains transiently suspended at the oil–air interface for time scales ranging from tenths of a second to an hour, depending on the droplet size and oil viscosity. The instantaneous configuration of the system over this stage is reminiscent of partially wetting droplets or even rigid particles suspended at an interface at equilibrium. This naturally raises questions of how our droplets may behave in the context of self-organising systems, such as particle rafts or soft crystals. For instance, two particles both denser than the underlying fluid layer will tend to pull the fluid surface down at the pinned contact line and may therefore attract one another due to capillary stresses acting to minimise the curved fluid interface between the two (Vella & Mahadevan Reference Vella and Mahadevan2005). On the other hand, if one of the particles is less dense than the fluid and floats (pulling the surface up), the particles will repel due to the inflected surface between them. While we would expect the same buoyant–capillary interactions between our droplets, the constant spreading of oil to cover the drops must also drive flows within the oil phase, absent in interfacial systems studied previously. These time-dependent flows may conceivably enhance or oppose the buoyant–capillary interactions between droplets and particles of different densities, and their exact influence on self-organisation is difficult to predict. Moreover, it remains to be seen how a rigid particle, perfectly wetted by a fluid substrate, may behave.
As a final remark, we note that the high-viscosity regime ( $O\!h\gtrsim 1$) we chose to examine is broadly relevant to oil spills, since many of the planet's natural oil reserves have kinematic viscosities of hundreds of cSt or more (Fingas & Fieldhouse Reference Fingas and Fieldhouse2012). In addition, the viscosity of crude oil slicks tends to increase over time as volatile fractions evaporate. The interaction of oil slicks with droplets is then central to a number of important practical applications. Spraying oil spills with droplet dispersants, for instance, is a routine method intended to enhance microbial oil degradation by increasing the oil–water interfacial area. While the efficacy of doing so remains contentious (Kleidienst et al. Reference Kleidienst, Paul and Joye2015), the practice is used globally and on massive scales, such as in the 2010 Deepwater Horizon oil well blowout in the Gulf of Mexico. We note that dispersants often constitute a complex mixture of polymers and surfactants. A preliminary study suggested that significant contamination from surfactant may prevent the formation of a cloaking layer, halting the engulfment process and stabilising the droplet as a lens at the oil surface (compare with Phan et al. (Reference Phan, Allen, Peters, Le and Tade2014), see § 1). However, provided the cloak can form (a question beyond the scope of this study), our analyses of early-time submersion (§ 3.1.2) and peeling dynamics (§ 3.2.4) suggest that the droplet should ultimately be engulfed regardless of variations in surface tension due to surfactants. Moreover, our study of PEDOT:PSS (§ 3.1.2), which is a complex fluid, suggests that at the low shear rates present in engulfment flows, the presence of polymers does not necessarily modify the dynamics. Hence, our fundamental study of engulfment has relevance to a much broader class of problems.
Acknowledgements
We thank M. Quinn for his technical support. We also thank A. Hazel and D. Vella for helpful discussions of an earlier version of the manuscript.
Funding
CC was funded by an EPSRC DTP studentship, AJ and ABT by EPSRC grant EP/P026044/1 and DPP by EPSRC grant EP/R045364/1.
Declaration of interests
The authors report no conflict of interest.
Appendix A. Effect of impact velocity on early-time engulfment
Figure 14 shows the result of impacting droplets of  $R_f=1.07$ mm at different impact velocities
  $13\le U_f\le 50$ cm s
 $^{-1}$. We varied
  $U_f$ by changing the height from which the droplets fell before impacting the oil layer. The inset of figure 6(d) shows the lifetime
  $T_{AC}$ of the air cushion as a function of
  $U_f$. We consider the air cushion to be formed after the droplet's final bounce following impact, and so we identify the start of
  $T_{AC}$ by the last frame in which the lower surface of the droplet is visible above the oil crater. The value of
  $T_{AC}$ increases monotonically with impact velocity, particularly over the range
  $31\le U_f\le 50$ cm s
 $^{-1}$, varying only slightly for
  $13\le U_f\le 31$ cm s
 $^{-1}$. For
  $13\le U_f\le 31$ cm s
 $^{-1}$,
  $T_{AC}\approx 0.1$ s, similar to the time scale over which impact-generated capillary waves persist on the droplet's surface after impact. Hence, over this range of
  $U_f$, some small amplitude droplet oscillations are still visible when the air cushion ruptures (see figure 6b). At the end of stage 1 (
 $t=0$), all droplets sit at around the same height,
 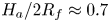 $H_a/2R_f\approx 0.7$, relative to the far-field oil level. This configuration is similar to the equilibrium lens state calculated numerically by Wong, Adda-Bedia & Vella (Reference Wong, Adda-Bedia and Vella2017) for a perfectly non-wetting droplet on a liquid layer. By analogy, the presence of the air cushion in our experiments acts to make the droplet effectively non-wetting on the oil, and the state of the system at the end of stage 1 corresponds to an approximate balance between capillary stresses due to the deformed oil surface and the droplet's weight. The dynamics of stage 2 all fall onto the same curve for
  $H_a(t>0)$ to within experimental variability (
 $t>0$ in figure 6b). In fact, repeated tests indicate that variations in
  $U_f$ did not measurably affect the dynamics of engulfment after
  $t=0$, for either macro- or microdroplets.
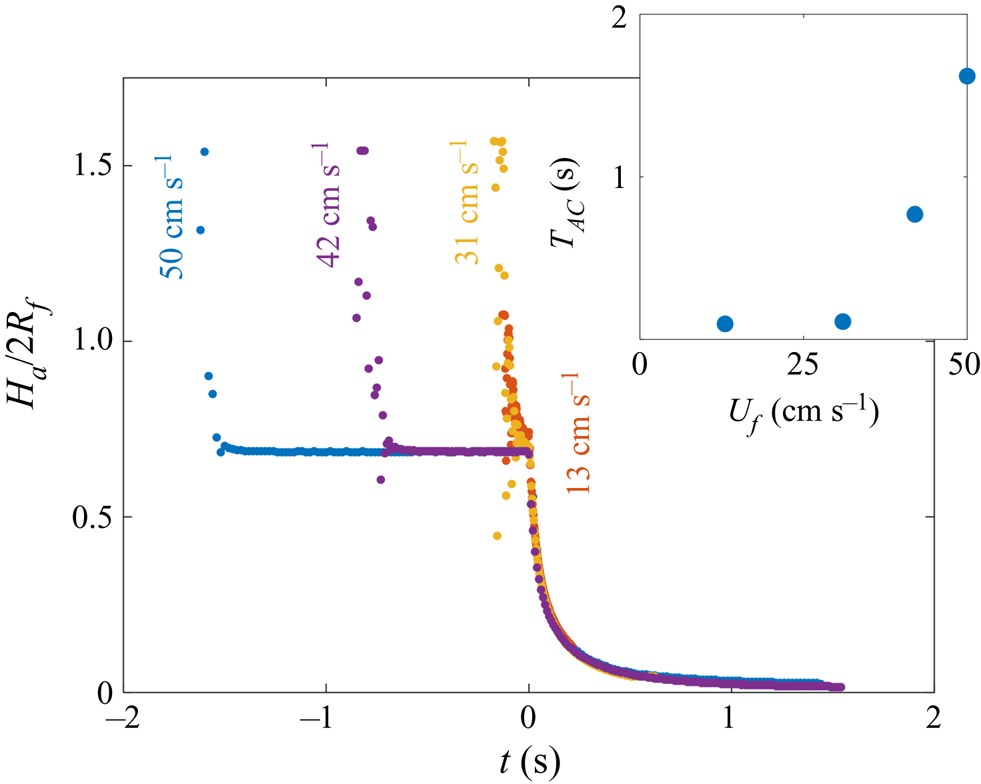
Figure 14. Time evolution of the normalised height  $H_a/2R_f$ of the droplet cap above the oil surface (see figure 6) for four impact velocities
 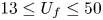 $13\le U_f\le 50$ cm s
 $^{-1}$. Inset: lifetime
  $T_{AC}$ of the air cushion as a function of
  $U_f$.
Appendix B. Effect of substrate viscosity on the time scales of engulfment
We conducted experiments over a broad range of oil viscosities, 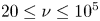 $20\le \nu \le 10^5$ cSt. Figures 15(a) and 15(b) compare the engulfment of droplets with
  $R_f=1.07$ mm deposited on 20 and 100 cSt oil baths, respectively. Side view images illustrate the 4 stages of engulfment introduced in figure 3. Stages 1 and 2 occur over comparable time scales for both viscosities; in both cases the air cushion ruptures at
  $t=0$, leaving behind small air bubbles, and the droplet is pulled downwards as oil spreads over the droplet. However, the time scale associated with stage 3, as well as the qualitative droplet behaviours, differ significantly for 20 and 100 cSt oils. At the start of stage 2, the sudden onset of engulfment generates inertia–capillary waves which significantly distort the droplet surface (see § 3.1). Theses waves are dissipated by viscous resistance primarily within the oil phase. For the drops on 20 cSt oil, inertia–capillary waves persist on the droplet–oil surface throughout engulfment, evident in the vertically stretched shape of the droplet during stage 3 (figure 15a,
  $t=0.02$ s). By contrast, droplets on oils of
  $\nu \ge 100$ cSt (figure 15b,
  $t=0.16$ s) show no clear evidence of the influence of inertia–capillary waves, with the droplets gradually descending below the oil surface. The drop encapsulated in 20 cSt oil detaches from the surface over a time scale comparable to that of stage 2 (
 $\sim$0.03 s), while the drop on 100 cSt oil remains suspended below the oil surface for a relatively long time (
 $\sim$16 s) compared with the preceding stage, before finally detaching and sinking. The contrasting time scales of the two processes are highlighted in figure 15(c), which shows the time of detachment
  $t_0$ as a function of
  $\nu$ for droplets with
  $R_f=1.07$ mm. At
  $\nu \ge 100$ cSt,
  $t_0$ appears to vary with viscosity as
  $t_0\sim \nu ^{0.8}$ (see § 3.2.6), as indicated by the power law fit (note the log–log scale). The point at 20 cSt, however, deviates from this power law by two orders of magnitude, suggesting the influence of inertia–capillary waves at low
  $\nu$ may significantly modify the dynamics of engulfment. We choose to focus our investigation on the high-viscosity regime. To formalise this statement, we define the Ohnesorge number
 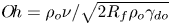 $O\!h=\rho _{o}\nu /\sqrt {2R_f\rho _{o}\gamma _{do}}$, where
  $\rho _{o}$ and
  $\gamma _{do}$ refer to the oil density and droplet–oil interfacial tension, respectively. We have chosen the in-flight diameter of the drop as the length scale.
  $O\!h$ quantifies the ratio between the typical period of oscillation associated with inertia–capillary waves on the droplet–oil interface and the time scale of viscous damping of inertial stresses in the oil phase (
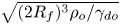 $\sqrt {(2R_f)^3\rho _{o}/\gamma _{do}}$ and
  $(2R_f)^2/\nu$, respectively). We define our threshold
  $\nu$ as that which satisfies
  $O\!h\gtrsim 1$, that is
 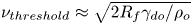 $\nu _{threshold}\approx \sqrt {2R_f\gamma _{do}/\rho _{o}}$. This corresponds to a situation wherein inertia–capillary waves are dissipated over time scales comparable to or less than a single period of oscillation, and should therefore not significantly affect the dynamics of engulfment. Figure 15(d) shows
  $\nu _{threshold}$ as a function of drop size
  $R_f$ for the values studied, indicating a typical order of magnitude of hundreds of cSt.
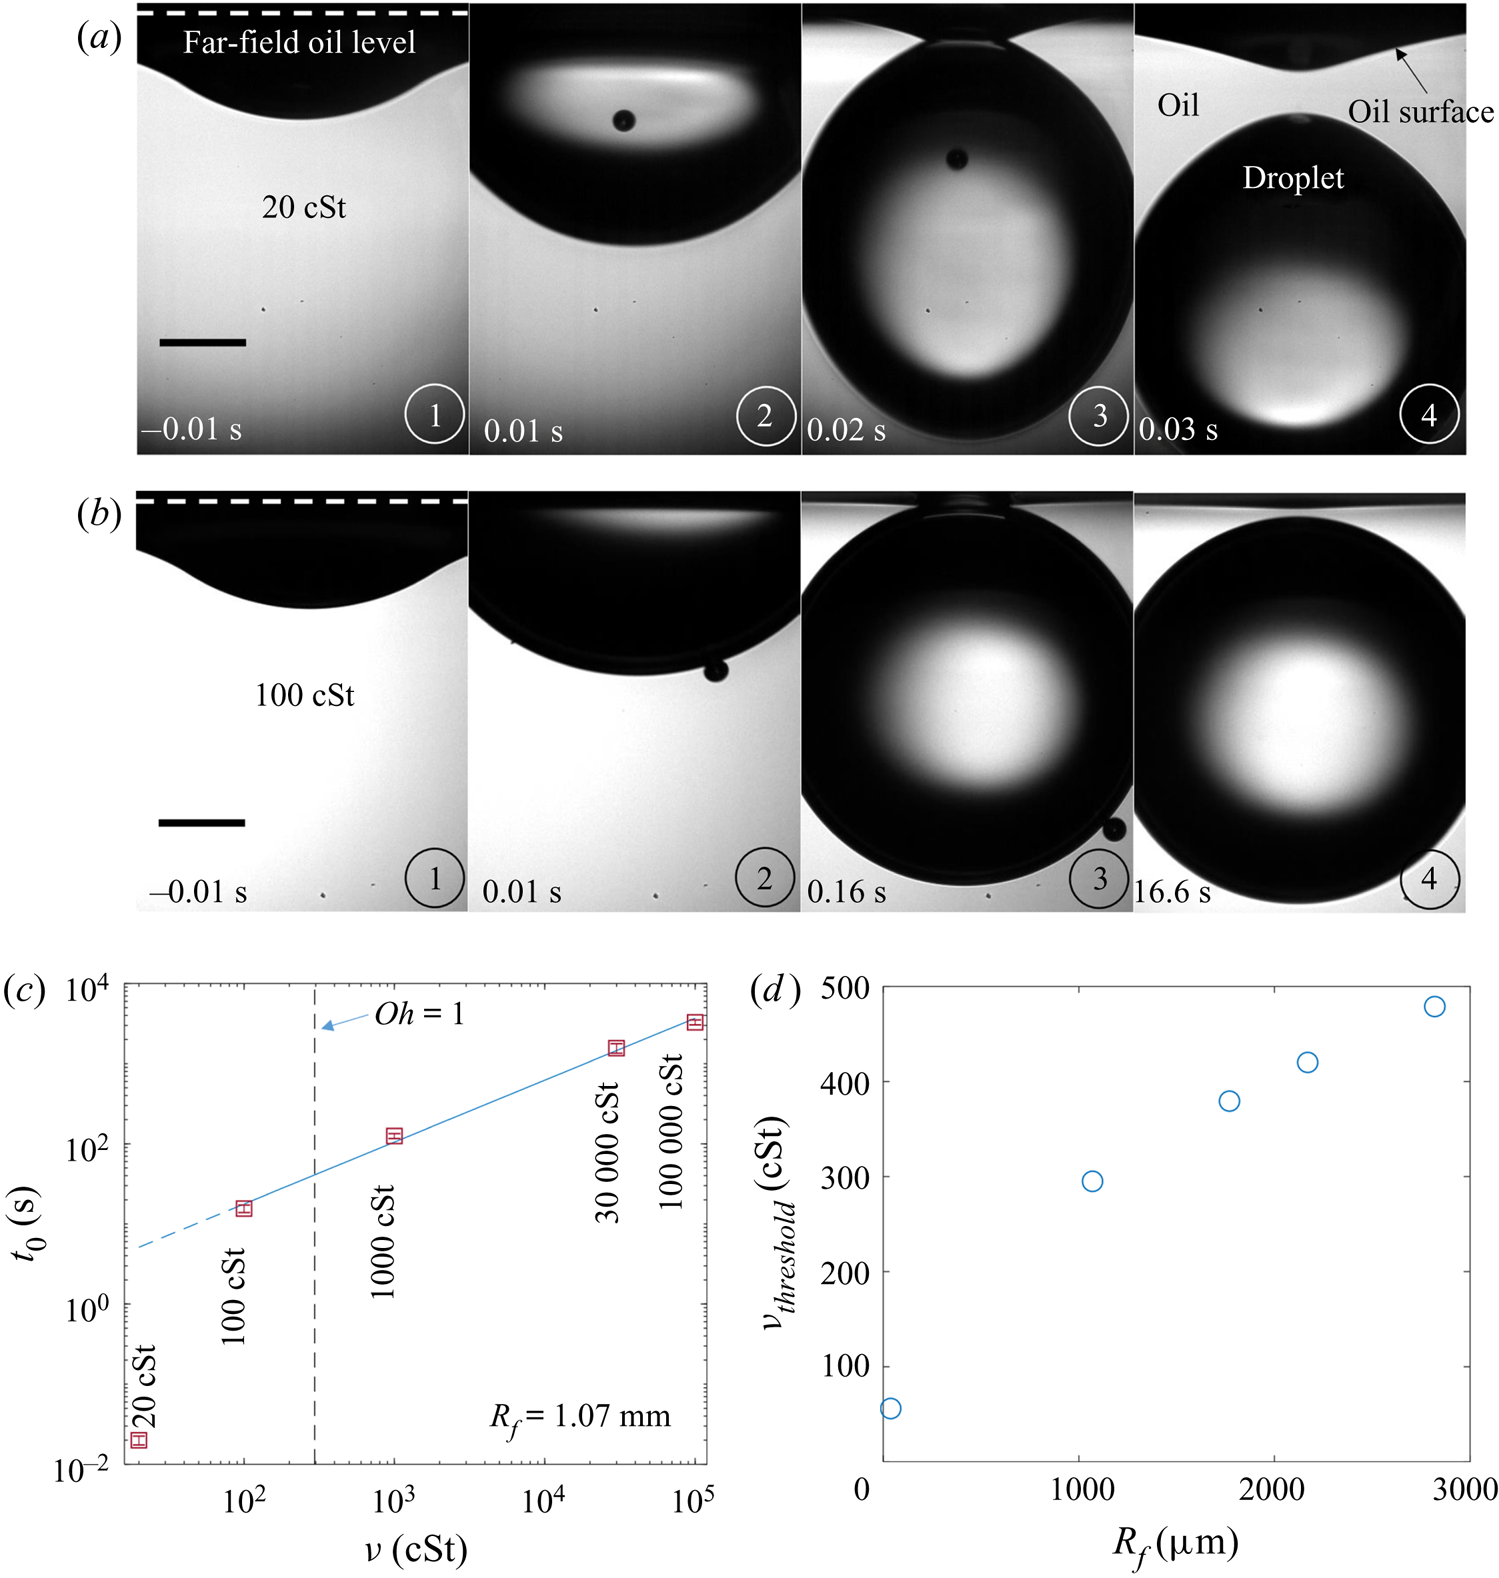
Figure 15. Effect of oil viscosity on time scales of engulfment. (a,b) Side view time series for droplets with  $R_f=1.07$ mm deposited on 20 and 100 cSt oils, respectively. The droplet and oil phases are labelled, as is the far-field level of the oil surface, away from the perturbed region around the droplet. Light is refracted at the curved oil and droplet surfaces, reducing the intensity of light transmitted to the camera objective. Hence, the droplet–air interface is not visible through the oil surface, and the droplet appears brightest within a central region. The times indicated are measured relative to the rupture of the air cushion. The stages of engulfment (1–4; see § 1) are indicated in the bottom right corner of each image. Scale bars are 0.5 mm. (c) The time
  $t_0$ at which the droplet detaches from the oil surface as a function of oil kinematic viscosity
  $\nu$ for drops with
  $R_f=1.07$ mm. The fitted curve (note the log–log scale) corresponds to a power law
  $t_0\sim \nu ^{0.8}$ for
  $\nu \ge 100$ cSt data. Error bars (which are smaller than the symbols) are standard deviations over at least three repetitions of the experiment. (d) Threshold oil viscosity
  $\nu _{threshold}$ for each drop size
  $R_f$ investigated, estimated from setting the Ohnesorge number
  $O\!h=1$ (defined in the main text). The corresponding value for
  $R_f=1.07$ mm is indicated by a dashed line in (c).
Appendix C. Effect of droplet and substrate relative densities on engulfment
We also performed experiments with  $1000$ cSt PPMS oil, which has a density slightly greater than that of water (see table 1). The resulting time evolutions of
  $r_c$ for a microdrop (
 $R_f=38.6$
  $\mathrm {\mu }$m) and a macrodrop (
 $R_f=1.07$ mm) are shown in figure 16(a,b) (blue stars). For comparison, we have plotted data for the same size drops on 1000 cSt PDMS oil on the same axes. For both of the drops on PPMS oil (
 $\rho _{o}>\rho _{d}$), we observe significantly slower spreading than for the corresponding drops on PDMS oil (
 $\rho _{o}<\rho _{d}$). The divergence of the data sets is most pronounced for the macrodroplets, which serves to highlight the dominant role of buoyant effects at larger
  $R_f$, or
  $Bo$. Since the droplets on PPMS oil did not sink, there was no identifiable instant of detachment. In addition, we did not observe any evidence of the apparent contact line closing, as is typically visible for macrodroplets on PDMS oil. Instead, the contact line became increasingly faint, with
  $r_c$ appearing to tend to a constant value, as inferred from the continuously decreasing gradient of the data in figure 16(b). This suggests that the system is tending towards an equilibrium state, sketched in the inset of figure 16(a), in which the droplet is cloaked, floating at the surface of the oil. In this configuration, buoyant forces on the droplet are balanced by the drop's weight and capillary stresses in the cloaking layer (distinct from the capillary stresses localised to a contact line for partially wetting liquid lenses). This is comparable to the situation at the end of stage 1, also sketched in the inset, when the droplet rests on a cushion of air. While the air film ultimately ruptures, the oil cloak in stable due to the effects of disjoining pressure (Schellenberger et al. Reference Schellenberger, Xie, Encinas, Hardy, Klapper, Papadopoulos, Butt and Vollmer2015).
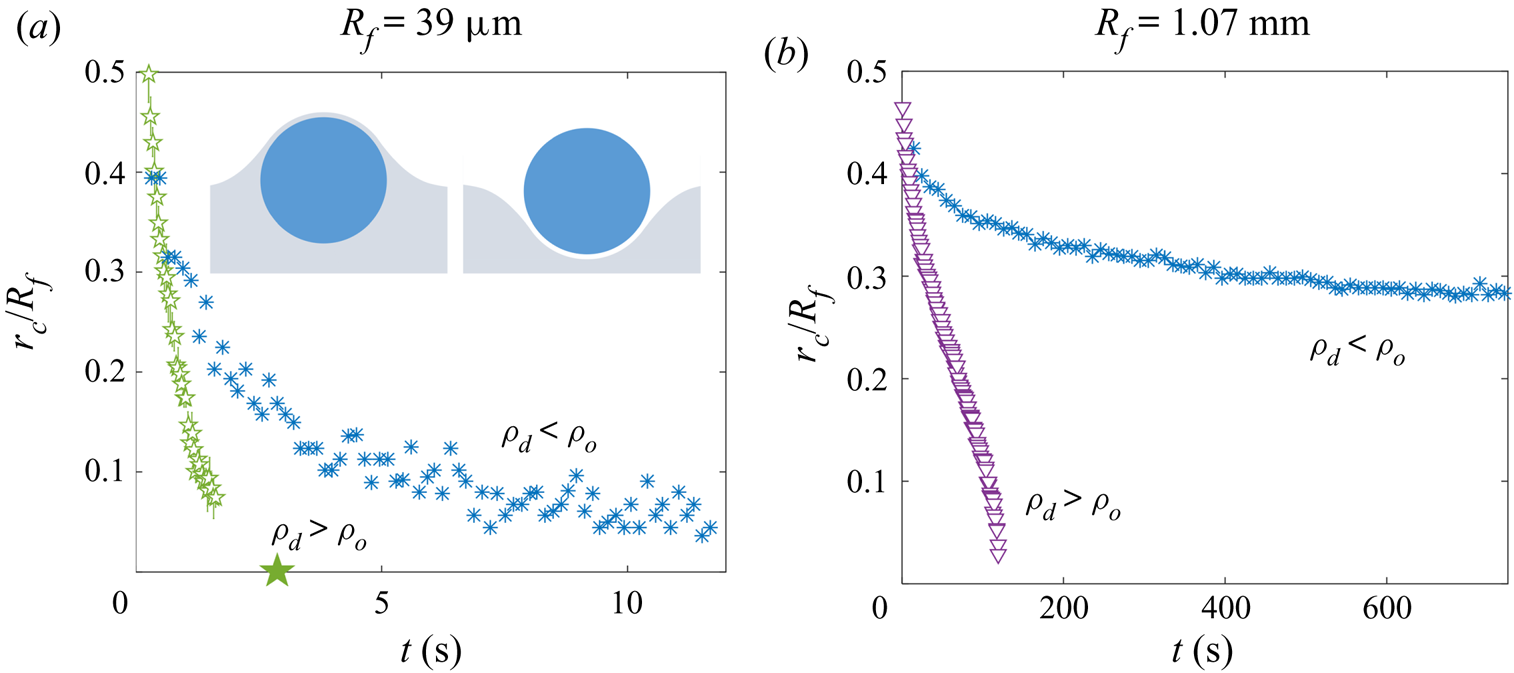
Figure 16. Time evolution of the apparent contact line radii  $r_c$ for (a) micro- and (b) macrodrops on different
  $1000$ cSt oils, with
  $R_f=38.6$
  $\mathrm {\mu }$m and 1.07 mm, respectively. Blue stars are data points for droplets deposited on PPMS oil, with density
  $\rho _{o}$ slightly greater than the density of water,
  $\rho _{d}$. Pentagrams and triangles are data for drops on PDMS oil (
 $\rho _{o}<\rho _{d}$), consistent with figure 9. The inset of (a) shows schematic diagrams of (left) a cloaked droplet at rest, floating on PPMS oil and (right) a droplet transiently at rest on a draining film of air.
Appendix D. Adhesion of droplet and oil surfaces in the presence of a cloaking layer
To investigate the adhesion observed between droplets and the oil surface during engulfment, we performed a set of experiments shown schematically in figure 17(a). A water droplet with  $R_f=1$ mm was deposited onto a Perspex platform suspended by a cantilever. The droplet was lowered into a quartz sample tube (inner diameter 24 mm). The tube was partially filled with 100 cSt PDMS oil, the level of which could be adjusted via a length of rubber tubing lowered into the tube, connected to a glass syringe mounted in a syringe pump (RS-232, KD Scientific). We initially flooded the tube, submerging the droplet entirely (see figure 17a). We then drained the oil to the level of the platform. This leaves the droplet coated in a cloaking layer of oil, which is stable since
  $S>0$ (Schellenberger et al. Reference Schellenberger, Xie, Encinas, Hardy, Klapper, Papadopoulos, Butt and Vollmer2015). After waiting one minute to allow the oil to settle, we submerge the droplet once again by pumping in oil at a fixed volumetric flow rate of
  $Q=10.0$ ml min
 $^{-1}$. During this second stage of flooding, the oil surface rises more slowly in the vicinity of the cloaked cap, compared with the surrounding bath, suggesting an adhesive force between the droplet and oil surfaces. This is evident in the shape of the oil surface just before the droplet is entirely submerged, as shown in side view in figure 17(b). The upper image shows an enlarged view of the region around the cap of the droplet (red dashed line in the lower image), which has been binarised to emphasise the shape of the droplet and oil surfaces. For comparison, figure 17(c) shows images for a droplet with
  $R_f=1.07$ mm deposited onto a deep bath of 100 cSt oil. The deformation of the oil surface in each experiment is strikingly similar, suggesting both are cloaked.
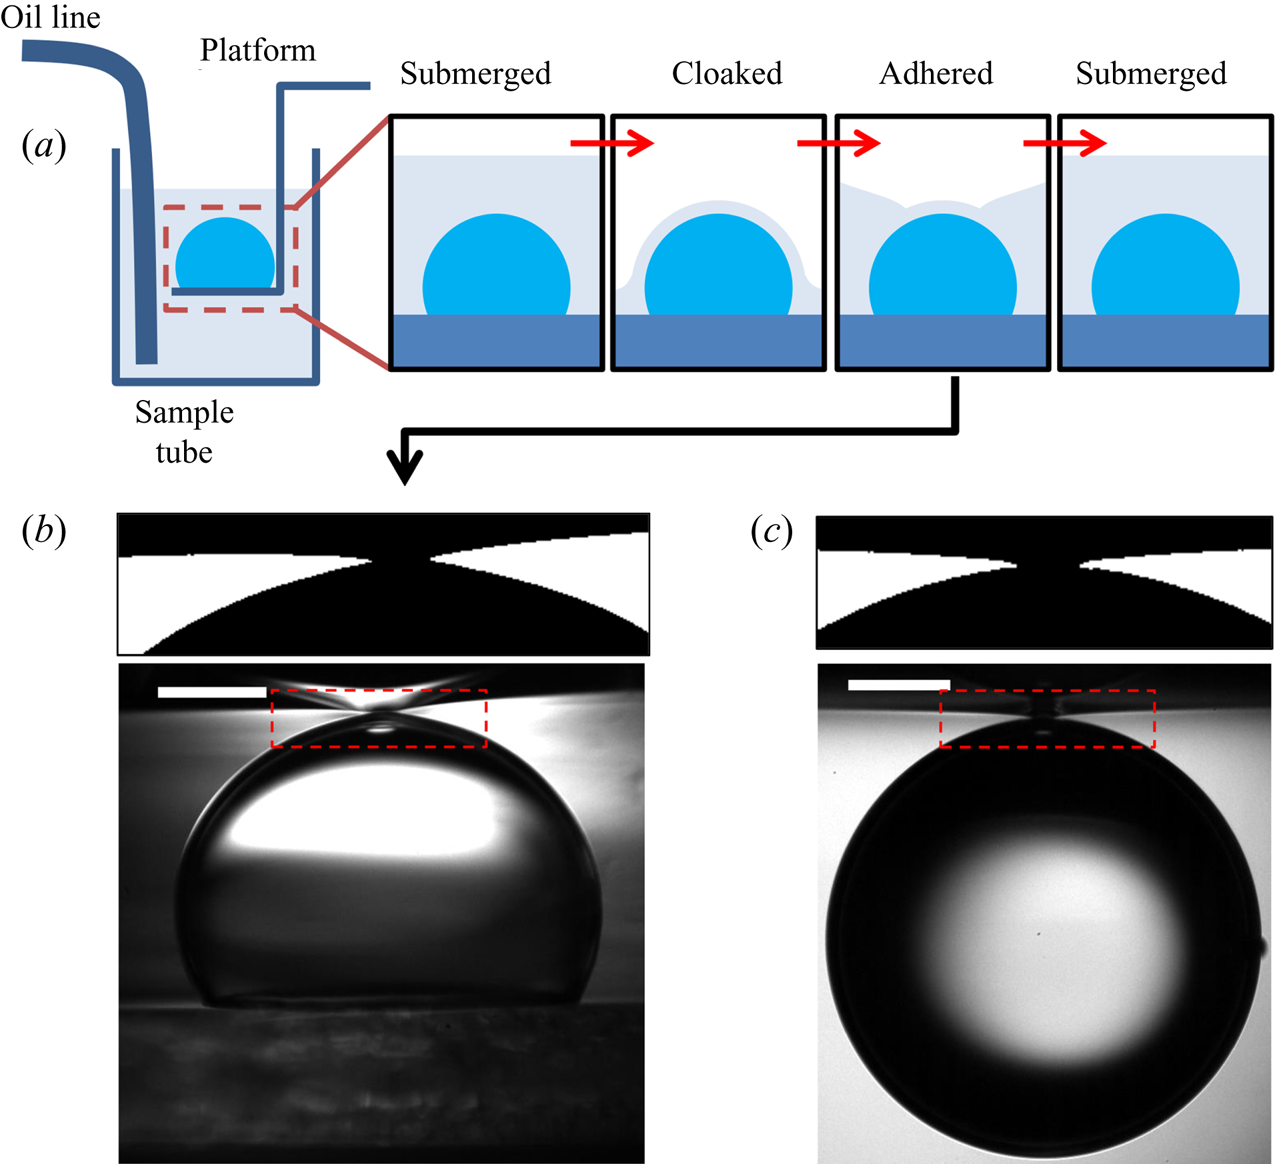
Figure 17. Oil surface adhesion for oil-cloaked droplets. (a) Experimental set-up and procedure. (b,c) Side view comparison of (b) an oil-cloaked droplet during the flooding of the sample tube and (c) a droplet during stage 3 of engulfment. Panel (a) shows enlarged views of the regions in the dashed boxes, where the oil–air and droplet–oil surfaces meet. The images have been binarised so that the oil phase appears white. Scale bars are 0.5 mm. The asymmetry of the oil surface profile in (b) is caused by meniscus effects due to the proximity of the droplet to the sample tube walls. This effect is absent in the much larger Perspex boxes used for (c). Oils of kinematic viscosity 100 cSt were used in both cases.


 Open access