


1. Introduction
The fluid–fluid displacement process is involved in various engineering applications, such as carbon geosequestration, underground hydrogen storage and fuel cells (Szulczewski et al. Reference Szulczewski, MacMinn, Herzog and Juanes2012; Andersson et al. Reference Andersson, Beale, Espinoza, Wu and Lehnert2016; Heinemann et al. Reference Heinemann2021). Extensive efforts have been made to understand, predict and control the fluid transport process using simulations, experiments and theoretical models (Lenormand, Touboul & Zarcone Reference Lenormand, Touboul and Zarcone1988; Zhao, MacMinn & Juanes Reference Zhao, MacMinn and Juanes2016; Singh et al. Reference Singh, Scholl, Brinkmann, Michiel, Scheel, Herminghaus and Seemann2017; Rabbani et al. Reference Rabbani, Or, Liu, Lai, Lu, Datta, Stone and Shokri2018; Guo & Aryana Reference Guo and Aryana2019; Gu, Liu & Wu Reference Gu, Liu and Wu2021). A phase diagram of fluid–fluid displacement patterns was revealed in the seminal work by Lenormand (Reference Lenormand1990), where the three displacement regimes – including stable displacement, capillary fingering and viscous fingering – were found to be controlled by the capillary number, reflecting the relative importance of viscous force to capillary force, and the viscosity ratio of the two fluids.
Another significant progress in understanding multiphase flow in porous media is marked by the identification of impact from wettability, that is, the contact angle at the three-phase contact line measured within the invading phase (Cieplak & Robbins Reference Cieplak and Robbins1990; Trojer, Szulczewski & Juanes Reference Trojer, Szulczewski and Juanes2015; Jung et al. Reference Jung, Brinkmann, Seemann, Hiller, Sanchez de La Lama and Herminghaus2016; Zhao et al. Reference Zhao, MacMinn and Juanes2016; Singh et al. Reference Singh, Scholl, Brinkmann, Michiel, Scheel, Herminghaus and Seemann2017; Primkulov et al. Reference Primkulov, Talman, Khaleghi, Rangriz Shokri, Chalaturnyk, Zhao, MacMinn and Juanes2018, Reference Primkulov, Pahlavan, Fu, Zhao, MacMinn and Juanes2019, Reference Primkulov, Pahlavan, Fu, Zhao, MacMinn and Juanes2021). As the solid becomes more wetting to the invading fluid, i.e. in an imbibition process, the invasion morphology shifts from dendritic patterns with many thin fingers towards a more compact region with smoother invasion front and less trapping of the defending phase. This transition was explained by the increased occurrence of the pore-scale cooperative filling events (Cieplak & Robbins Reference Cieplak and Robbins1990; Holtzman & Segre Reference Holtzman and Segre2015), during which two menisci merge into one, consequently leading to more compact displacement patterns.
While most focus has been placed on the effects of fluid phases, the influence of topological and geometrical features of porous structures on multiphase flow received less attention despite several studies demonstrating a clear dependence of displacement patterns on the pore space geometry, especially in the quasi-static regime where capillary force controls the interface motion. It has been shown that capillary or viscous fingering can be suppressed by careful design of porous media with a particle size gradient (Rabbani et al. Reference Rabbani, Or, Liu, Lai, Lu, Datta, Stone and Shokri2018; Lu et al. Reference Lu, Browne, Amchin, Nunes and Datta2019). Thus understanding how the pore structure affects multiphase flow is of great importance for controlling the process of fluid transport. In regular porous media – e.g. two-dimensional micromodels composed of circular posts with narrow particle size distribution arranged on a triangular or square lattice – both simulations and experiments have shown compact and faceted patterns (Cieplak & Robbins Reference Cieplak and Robbins1990; Martys, Robbins & Cieplak Reference Martys, Robbins and Cieplak1991; Holtzman Reference Holtzman2016; Wang, Pereira & Gan Reference Wang, Pereira and Gan2021). This phenomenon was attributed to the dominance of the underlying pore geometry (regular lattice structure), which results in the symmetrical growth of invasion patterns. However, when heterogeneity is introduced to particle shape (Wang et al. Reference Wang, Pereira and Gan2021), size (Lenormand Reference Lenormand1990; Holtzman Reference Holtzman2016; Hu et al. Reference Hu, Lan, Wei and Chen2019) or position (Wang et al. Reference Wang, Chauhan, Pereira and Gan2019), irregular displacement patterns with rough invasion fronts are observed. These observations can be explained by the amplified unevenness in the local critical capillary pressures due to heterogeneity in pore structure, leading to ramified advancement of menisci even in the wetting condition (imbibition) (Wang et al. Reference Wang, Chauhan, Pereira and Gan2019). One limitation of the aforementioned works, as pointed out by Golmohammadi et al. (Reference Golmohammadi, Ding, Küchler, Reuter, Schlüter, Amro and Geistlinger2021), is that the porosity of porous media is limited to very high values (0.6–0.9) with sparsely packed particles, whereas the multiphase behaviour in porous media with lower porosity remains unexplored.
Clearly, there is a need for thorough examination of the role of microstructure during multiphase flow in porous media. In this work, we study the imbibition process in regular porous media across a wide range of porosity in the quasi-static regime. As expected, due to homogeneity of the porous structure and the wetting condition during imbibition that favours cooperative pore filling events, the invasion morphology is compact and faceted (Lenormand Reference Lenormand1990; Holtzman Reference Holtzman2016; Gu et al. Reference Gu, Liu and Wu2021; Wang et al. Reference Wang, Pereira and Gan2021). Interestingly, when the porosity of porous medium decreases below a critical value, the emergence of unstable invasion associated with rough invasion fronts and occurrence of trapping events is observed, which is reminiscent of invasion percolation (or capillary fingering in drainage condition). By analysing the pore-scale instability events, we show that the macroscopic transition of multiphase flow from a compact and faceted displacement towards an irregular and unsymmetrical growth is linked to the shift in the type of pore filling events. Based on this, a phase diagram is proposed to predict different regimes of multiphase displacement patterns in regular porous media. Results from systematic fluid–fluid displacement simulations with different contact angles and porous structures agree well with the proposed phase diagram.
2. Method
A pore-resolved interface tracking algorithm is used for simulating multiphase flow processes in the capillary-dominated regime (Wang et al. Reference Wang, Pereira and Gan2021, Reference Wang, Pereira, Sauret, Aryana, Shi and Gan2022). The capillary-dominated regime (in the limit of vanishing capillary number), or the quasi-static regime, corresponds to displacement processes where the viscous effect (regardless of viscosity ratio) is negligible compared with the interfacial tension. The algorithm incorporates different types of pore-scale instabilities during fluid invasion, including burst, touch and overlap events (figures 1a–c) (Cieplak & Robbins Reference Cieplak and Robbins1990). The solid surface is discretized into computational nodes such that the sharp edge pinning effect can be taken into account (Gibbs Reference Gibbs1961; Oliver, Huh & Mason Reference Oliver, Huh and Mason1977). The capillary pressures associated with different meniscus advancement events are determined based on the two-dimensional Young–Laplace equation, i.e. assuming that the contribution from the out-of-plane curvature can be neglected:  $P_c=\gamma /R$, with $\gamma$ the interfacial tension and $R$ the in-plane meniscus radius. At each computation step, the meniscus with the minimum capillary resistance advances. The algorithm tracks the interface motion during the fluid–fluid displacement process, and the simulation stops when the invading fluid reaches the outlet. The evolution of capillary pressure can also be obtained during the movement of menisci in pore space. Validation of the numerical method in a previous study has indicated that the invasion mechanisms at pore scale are captured accurately, and the macroscopic invasion morphology of fluid–fluid displacement in disordered porous media can be reproduced. The key advantage of the algorithm is its applicability to multiphase flow in porous media with arbitrary pore structures. However, it is currently limited to capillary-dominated processes, and further efforts are needed to incorporate viscous effects as well as extending the algorithm to three dimensions. A detailed description of the algorithm can be found in the previous study (Wang et al. Reference Wang, Pereira and Gan2021, Reference Wang, Pereira, Sauret, Aryana, Shi and Gan2022) and is omitted here for brevity.

Figure 1. Fluid displacement in regular porous media composed of circles packed on a triangular lattice. (a) Schematic of a burst invasion event, where the meniscus reaches the local maximum capillary resistance pressure and becomes unstable. (b) A touch event, where the meniscus comes into contact with a particle, forming two new menisci. (c) An overlap event, where two menisci intersect and merge into one meniscus. (d,e) Invasion morphologies at percolation (when the invading phase reaches the boundary) during radial injection simulations for porous media with porosity  $\phi =0.65$ and 0.25, respectively. The invading phase saturations are 0.275 and 0.395 for (d,e), respectively. Both cases have intrinsic contact angle $\theta _0=60^\circ$. The insets show magnified regions of the porous media for each case.
Two types of regular lattice structures, triangular and square lattices, are considered in this work. For both cases, the porous media are composed of about 2000 circular posts of equal size arranged at corresponding lattice sites. Each circle with radius unity is discretized into 100 computational nodes, i.e. represented by a 100-edge regular polygon, after which a random rotation about the particle centre by an angle ranging between  $0^\circ$ and $360^\circ$ is applied. This manually introduced rotation, which can be regarded as a small perturbation in geometry, prevents the exact equality of capillary pressure of different menisci in a perfectly crystalline lattice with a single post radius. Mesh independence studies were conducted to ensure that the mesh size is sufficiently small. Radial injection simulations are conducted for porous media with different porosities, and the simulation stops at percolation, i.e. when the invading phase reaches the perimeter (boundary particles) of the domain. The explored intrinsic contact angles for imbibition processes range from $45^\circ$ to $90^\circ$. Since the current algorithm does not capture the phenomenon of corner flow in the extreme wetting condition (Zhao et al. Reference Zhao, MacMinn and Juanes2016), cases with contact angle $\theta _0<45^\circ$ are not considered in the present work.
3. Results and discussion
3.1. Symmetry breaking in pattern formation
Figures 1(d,e) show the final invasion morphologies of invading phase (blue) with  $\theta _0=60^\circ$ and porosity $\phi =\{0.65,0.25\}$, respectively, with insets showing the corresponding particle packing structure of a magnified sub-region. At $\phi =0.65$, the pattern exhibits a hexagonal shape due to the dominance of the underlying triangular lattice on which the particles are arranged, consistent with past experiments and numerical simulations (Lenormand Reference Lenormand1990; Holtzman Reference Holtzman2016; Wang et al. Reference Wang, Pereira and Gan2021). For $\phi =0.25$, however, a ramified shape with several clusters of trapped defending phase is seen, manifesting the transition towards the regime of capillary fingering described by the theory of invasion percolation (Wilkinson & Willemsen Reference Wilkinson and Willemsen1983; Lenormand & Zarcone Reference Lenormand and Zarcone1985). Extra simulations for several different realizations of porous media with the same key parameters, i.e. $\theta _0$ and $\phi$, as well as different mesh sizes (polygon edge number 50, 100 and 200), are conducted, and the same qualitative results are observed.
To illustrate the differences observed in figures 1(d,e) from another perspective, we plot the capillary pressure as well as corresponding pore-scale instability events during the displacement process in figure 2. We define the dimensionless capillary pressure as  $P_c^*=a/R$, with $R$ the meniscus radius and $a$ the particle centre-to-centre spacing. In figure 2(a), the $P_c^*$ evolution during a sub-period of the entire displacement process for the porosity $\phi =0.65$ case shows a periodic behaviour where the touch events associated with large $P_c^*$ are followed by multiple alternating overlap and touch events, before the next cycle starts. Note that the data shown in figure 2 are representative, i.e. the periodicity persists outside the presented time window, and the length of each cycle (number of these alternating events) increases as the invasion area grows larger. By visualizing the invasion progress (see supplementary movie 1 available at https://doi.org/10.1017/jfm.2022.336), it is found that this periodic behaviour is associated with consecutive filling of pores along an edge of the hexagon; i.e. starting from a hexagon, once a new pore is filled, the invasion stops along all other edges, until the current edge is filled completely. The distribution of $P_c^*$ values reveals that there are in total three peaks. The peak with large $P_c^*$ is associated with relatively small number of touch events. Note that the fluctuations of $P_c^*$ within each peak are attributed to the geometrical noise introduced by the random rotation of polygons. The non-overlap of peaks indicates that the geometrical perturbation is small enough, and the mesh size (circular posts represented by 100-edge polygons) is sufficiently fine, such that the local invasion mechanisms in regular lattice with monodisperse particles are preserved. As expected, it is found that the fluctuation decreases as the number of mesh points increases.

Figure 2. Capillary pressures and invasion events during the displacement process. (a) Evolution of the dimensionless capillary pressure  $P_c^*$ with overlap and touch events marked by red circles and blue squares, respectively. The result corresponds to the case in figure 1(d), i.e. $\theta _0=60^\circ$, $\phi =0.65^\circ$. Only a sub-period of the total capillary signal is shown for clarity. The plot on the right shows the distribution of $P_c^*$ values corresponding to overlap (red) and touch (blue) events, respectively. The number of events during the entire simulation is shown in the legend. (b) Data for the case with $\theta _0=60$, $\phi =0.25$ (case in figure 1e).
For  $\phi =0.25$, figure 2(b) shows that the overlap events occur intermittently between touch events that are all associated with high capillary pressure. Also, in contrast to the previous case, the distribution of $P_c^*$ contains only two peaks, a clear indication of change in the capillary pressure signature. The invasion morphology is found to evolve according to a rather chaotic manner with a dendritic pattern, reminiscent of the process of invasion percolation (see supplementary movie 2). The asymmetrical advancement of invading fluid, i.e. symmetry breaking in the pattern formation, is intuitively unexpected since the porous medium exhibits a high degree of homogeneity, and the contact angle $\theta _0=60^\circ$ falls in a range (imbibition process) where the cooperative pore filling events are favoured.
3.2. Analysis of critical pore-scale events
To explain the observed regime transition, we analyse the pore-scale invasion mechanisms for regular porous media at different contact angles. As a meniscus moves forward between a pair of circular pillars, its radius can be calculated as (Purcell Reference Purcell1950)
 \begin{equation} R=\frac{a-2r\cos{\alpha}}{2\sin{(\alpha+\theta_0-90^\circ})}, \end{equation}
with  $a$ the particle centre-to-centre spacing, $r$ the particles radius, $\alpha$ the angle associated with the meniscus position (inset in figure 3a). Figure 3(a) shows the value of $P_c^*$ at different $\alpha$ and $\theta _0$ with ${r}/{a}=\frac {5}{16}$, corresponding to $\phi =0.65$ (case in figures 1(d) and 2(a)). As the meniscus advances (from left to right, i.e. increasing $\alpha$), it may experience pore-scale instabilities including burst, touch or overlap (Cieplak & Robbins Reference Cieplak and Robbins1990). The $P_c^*$ value associated with burst is the maximum value marked by triangles in figure 3(a), which also gives the corresponding value of $\alpha _{burst}$ (the value of $\alpha$ at which burst occurs). The configuration of the meniscus shape corresponds to an arc whose centre is located at the midpoint of the segment that connects the particle centres. The touch event occurs when the meniscus comes into contact with the particle in the front, which satisfies geometrically (see Appendix A for the derivation)
 \begin{equation} \left[1-\cos{(\alpha_{touch}+\theta_0-90^\circ)}\right]R+r\sin{\alpha_{touch}}=\tfrac{\sqrt{3}}{2}a-r. \end{equation}
After replacing the meniscus radius  $R$ according to (3.1), equation (3.2) involves only one variable, $\alpha _{touch}$, and can be solved numerically. The determined $\alpha _{touch}$ and its corresponding dimensionless capillary pressure $P_c^*=a/R$ are marked by squares in figure 3(a). The value of $\alpha$ for an overlap event can be obtained from (Appendix A)
 \begin{equation} \alpha_{overlap}=\max[\theta_{c},2\theta_{c}-\min(\alpha_{touch},\alpha_{burst})], \end{equation}
with  $\theta _c=60^\circ$ the characteristic angle of porous media with triangular lattice (black dashed line in figure 3a) (Holtzman & Segre Reference Holtzman and Segre2015). Equation (3.3) implies that $\alpha _{overlap}$ depends not only on the intrinsic lattice structure ( $\theta _{c}$), but also on the position of its neighbour meniscus before reaching an instability event.

Figure 3. Determination of critical pore-scale events. (a) The dimensionless capillary pressure  $P_c^*$ as a meniscus advances in the porous medium. The location of the meniscus is indicated by $\alpha$ in the inset. The porous medium has porosity $\phi =0.65$ (corresponding to $r/a=5/16$). The burst, touch and overlap events are marked by triangles, squares and circles, respectively. A filled marker indicates the first instability event (critical invasion event) that a meniscus experiences. Plots of $P_c^*$ before and after these critical events are drawn in solid and dotted lines, respectively. The black dashed line marks the characteristic angle for overlap, which is $60^\circ$ for circles placed on a triangular lattice. (b) Plots of $P_c^*$ and invasion events for the case with smaller porosity $\phi =0.25$. (c) Phase diagram showing the type of critical invasion events for different porosity and wettability. The red dotted line and red dashed line correspond to results shown in (a,b), respectively.
As a meniscus moves forward during the invasion process, it is the first critical instability, not necessarily the one associated with the smallest  $P_c^*$, that determines whether a local pore will be invaded. The $P_c^*$ associated with the first instabilities are represented in figure 3(a) by filled markers, and the capillary pressures determined from (3.1) before and after touch or overlap events are represented by solid and dashed lines, respectively. Thus the dashed line represents the theoretical but not realistic capillary pressure that a meniscus can never experience due to the occurrence of merging/splitting events. Figure 3(a) shows that as the wetting condition changes from drainage ( $\theta _0>90^\circ$) to imbibition ( $\theta _0<90^\circ$), the critical pore-scale invasion mechanisms shift from burst to overlap. For smaller porosity $\phi =0.25$ (figure 3b), it can be seen that $P_c^*$ is amplified in both imbibition and drainage due to narrower throats. Also, smaller values of $\alpha$ associated with the maximum $P_c^*$ (burst events) are observed, indicating that the overlap events become less favourable due to the decrease of porosity. A consequent effect is the emergence of touch events (solid squares) in the weak-imbibition regime, which are absent in sparser media (figure 3a). By sweeping the $\theta _0$– $\phi$ space, a phase diagram characterizing the critical type of pore-scale instability can be established (figure 3c). The red dotted line and red dashed lines correspond to figures 3(a) and 3(b), respectively. It has been identified that the overlap event, or the cooperative pore filling event (Cieplak & Robbins Reference Cieplak and Robbins1988; Holtzman & Segre Reference Holtzman and Segre2015), smooths the invasion front and makes the invasion morphology compact, whereas the occurrence of either burst or touch events destabilizes the displacement. Clearly, crossing of regimes is possible by varying either $\theta _0$ or $\phi$. Specifically, a smaller $\theta _0$ and greater $\phi$ favour the overlap events, whereas greater $\theta _0$ and smaller $\phi$ promote touch or burst events.
3.3. Phase diagram
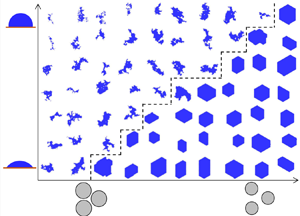
The main results of this work are shown in figure 4, which compares the systematic numerical simulations with the analytical prediction in the imbibition regime. The final invasion morphologies (invading fluid in blue colour) of radial injection simulations at percolation are shown in figure 4(a) for the intrinsic contact angles  $\theta _0\in [45^\circ,90^\circ ]$ and $\phi \in [0.2,0.85]$. Here, particles that are fully submerged in the invading fluid are also coloured in blue. Qualitatively, as $\theta _0$ increases and $\phi$ decreases, a clear transition from compact hexagonal patterns towards dendritic shapes with rough invasion fronts is observed. The blue and brown boxes correspond to the cases in figures 1(d) and 1(e), respectively. To quantify the displacement patterns, in figure 4(b), we present (i) the proportion of overlap events $P_{overlap}$ during the entire displacement process, (ii) the fractal dimension $D_{f}$ of final invasion morphologies using the box-counting method (Mandelbrot Reference Mandelbrot1983), and (iii) the boundary of overlap obtained analytically in figure 3(c) and the corresponding adjusted line for consideration of the sharp edge pinning effect (Gibbs Reference Gibbs1961; Oliver et al. Reference Oliver, Huh and Mason1977; Wang et al. Reference Wang, Pereira and Gan2021) by shifting the original curve towards the left by $3.6^\circ$. This is because each particle is represented by a 100-edge polygon that has a local corner angle of $176.4^\circ$, leading to an effective contact angle $\theta =\theta _0+(180^\circ -176.4^\circ )=\theta _0+3.6^\circ$ during simulations (Appendix A).
The three metrics described in (i)–(iii), respectively, represent the pore-scale, macro-scale and analytical characterization of the displacement processes. Below the adjusted analytical curve, the overlap events account for more than 40 % of the total pore invasion events, and the corresponding fractal dimension remains close to 2 (note the adjusted colourbar for  $D_f$, where the brown colour represents values of around 1.98). Above the analytical curve, both $P_{overlap}$ and $D_{f}$ experience a sharp decrease. Overall, figure 4(b) demonstrates good consistency among these multi-scale descriptions. The adjusted analytical curve (black-dashed line) is mapped onto figure 4(a), which again demonstrates the accurate prediction of the phase transition.

Figure 4. Phase diagram for displacement patterns during imbibition in regular porous media. (a) Invasion morphologies of radial injection simulations at percolation for different wettability and porosity. The black dashed line is mapped from the black dashed line in (b). The blue and brown boxes correspond to the cases in figure 1(d) (also figure 2a) and figure 1(e) (also figure 2b), respectively. (b) Proportion of overlap events  $P_{overlap}$ contour. The colours of dots represent the measured fractal dimension $D_f$ of the invasion morphology using the box-counting method. The black dotted line marks the boundary of overlap events (figure 3c). The black dashed line is obtained by shifting the black dotted line by $3.6^\circ$ to the left for consideration of the sharp edge pinning effect due to the finite number of mesh points.
3.4. Generalization to square lattice
We then generalize our results to porous media with particles packed on a square lattice, which is another common regular configuration. Analytically, the calculation for a burst event remains the same, and (3.1) remains valid. For a touch event, the value of  $\alpha _{touch}$ follows (Appendix A) from
 \begin{equation} \left[R\cos{(\alpha_{touch}+\theta_0-90^\circ)}+a-r\sin{\alpha_{touch}}\right]^2+ \left(\frac{a}{2}\right)^2=(R+r)^2, \end{equation}
again with  $R$ expressed in (3.1). Equation (3.3) remains applicable for overlap events, but the characteristic angle for the square lattice becomes $\theta _{c}=45^\circ$ (black dashed line in figure 5a). The $P_c^*$ evolution as a function of meniscus position $\alpha$ is shown in figure 5(a) for different intrinsic contact angles. The $\theta _0$– $\phi$ phase diagram is shown in figure 5(b). Compared with figure 3(c) for a triangular lattice, one can notice the absence of touch events. This is expected intuitively since the parallel alignment of particles (inset in figure 5a) suppresses the occurrence of a touch event without significant advancement of meniscus position ( $\alpha$), whereas a staggered particle arrangement would favour comparatively the touch events. Also, a slight expansion of the overlap region (from $99^\circ$ in figure 3(c) to $110^\circ$ in figure 5(b) at $\phi =0.85$) is observed. This is attributed to a smaller $\theta _c$, resulting in more favoured overlap events.
To check the validity of the analysis and also preserve brevity, only six simulations with  $\phi =\{0.3, 0.5, 0.8\}$ and $\theta _0=\{60^\circ,90^\circ \}$ near the phase transition are conducted (grey dots in figure 5b), and the corresponding displacement patterns at percolation are shown in the adjacent insets. In the overlap regime, the patterns have rectangular shapes, revealing the dominance of the underlying lattice structure. In the burst regime, all invasion morphologies exhibit irregular patterns with thin fingers and trapping of the defending phase. These observations validate the derived phase diagram, showing the generality of the analysis.

Figure 5. Generalization to a square lattice. (a) Plots of  $P_c^*$ and invasion events for a porous medium with a square lattice configuration. Symbol meanings are the same as in figure 3(a). The characteristic angle of overlap for the square lattice is $45^\circ$, as denoted by the black dashed line. (b) Invasion events phase diagram for the square lattice. The red dashed line corresponds to the path of (a). Insets show the invasion morphologies at percolation for $\phi$ and $\theta _0$, represented by corresponding dots.
3.5. Discussions
Several comments can be made based on the insights provided in this work. Recently, Gu et al. (Reference Gu, Liu and Wu2021) proposed a mathematical model to investigate the imbibition processes in a dual-permeability pore network, where the circular particles are arranged on a square lattice with porosity  $\phi =0.55$ and $\theta _0=30^\circ$. This configuration, according to figure 5(b), falls into the overlap regime. As expected, Gu et al. (Reference Gu, Liu and Wu2021) observed compact growth of the invading fluid. They further claimed the independence of porosity and contact angle of their results by conducting extra simulations at $\phi =0.62$ and $\theta _0=\{15^\circ,45^\circ \}$. However, these settings again imply an overlap-dominated regime according to the phase diagram proposed in the present work. We hypothesize that the growth of invading fluid during the imbibition process could be different qualitatively in the dual-permeability network if their simulations were conducted at a much lower porosity.
In the current work, regular media with mono-sized particles are considered. If geometrical heterogeneity is introduced – for example, by considering either a distribution of particle sizes or an insufficient number of mesh points for describing the particles (or limited resolution in microfluidic devices manufacture process for experiments) – then a wider transition across the phase boundary as in figure 4(b) can be expected. Primkulov et al. (Reference Primkulov, Talman, Khaleghi, Rangriz Shokri, Chalaturnyk, Zhao, MacMinn and Juanes2018) studied the quasi-static fluid displacement processes in a disordered porous media, and demonstrated that an increase in posts spacing, i.e. increase in porosity, widens the range of contact angles for cooperative filling events, making the cooperative pore filling more favourable, leading to more compact displacement. One possible way to evaluate quantitatively the ‘irregularity tolerance’ of porous media for achieving compact growth could be derived by analysing the stability of the occurrence of critical invasion events, i.e. the distance (difference in  $\alpha$ in, e.g. figure 3a) between the first and second instability events. From figures 3(a) and 3(b), it can be shown that the ‘irregularity tolerance’ is greater for smaller $\theta _0$ and greater $\phi$, which corresponds to moving towards the bottom left corner in the $\theta _0$– $\phi$ phase diagram. This may explain the observed hexagonal invasion morphology during imbibition even with 52 % variation in particle size (Holtzman Reference Holtzman2016).
4. Conclusions
We have investigated quasi-static multiphase flow during imbibition processes in two-dimensional regular porous media. It is found that for relatively sparse porous media (high porosity), the displacement process is similar to crystal growth, where the invading fluid remains compact and faceted with its shape governed by the underlying lattice structure. However, when the porosity decreases below a critical value, the invasion morphologies shift towards ramified patterns associated with thin fingers and trapping of the defending fluids, which is reminiscent of capillary fingering during drainage processes. Through analysing different invasion mechanisms at pore scale, the transition from faceted to irregular growth, as the porosity decreases, is explained by less favoured overlap events. The analysis across a wide range of porosity and wetting conditions leads to a phase diagram describing the dominance of different types of invasion events, which can be used to predict the macroscopic morphological transition. By conducting systematic imbibition simulations on regular porous media of different lattice structures, i.e. triangular and square lattices, excellent consistency is observed among pore-scale events, macroscopic invasion morphologies and analytical predictions.
This study provides new insights on the role of geometrical features of solid structures during the fluid–fluid displacement process, with emphasis on the porosity and wettability of regular porous media. The findings would assist in guiding the design of microfluidic devices to control deterministically the multiphase flow, transport and reaction processes.
Supplementary movies
Supplementary movies are available at https://doi.org/10.1017/jfm.2022.336.
Declaration of interests
The authors report no conflict of interest.
Appendix A
A.1. Touch events (3.2) and (3.4)
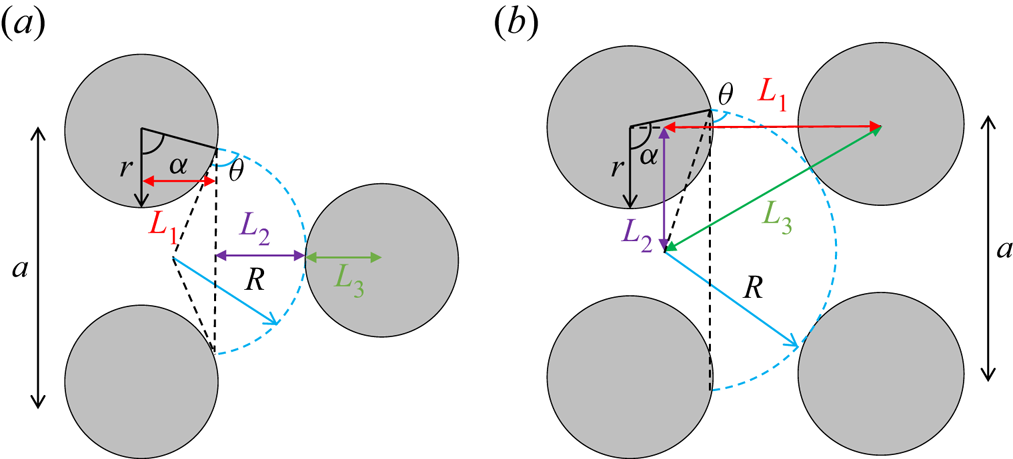
On a triangular lattice, when the meniscus touches the next grain (see figure 6a), (3.2) can be derived from
 \begin{equation} L_1+L_2+L_3=\tfrac{\sqrt{3}}{2}a, \end{equation}
with  $L_1=r \sin {\alpha }$, $L_2=[1-\cos {(\alpha +\theta -90^\circ )}]R$ and $L_3=r$. On a square lattice (figure 6b), (3.4) can be derived from
 \begin{equation} L_1^2+L_2^2=L_3^2, \end{equation}
with  $L_1=[1-\cos {(\alpha +\theta -90^\circ )}]R$, $L_2=a/2$ and $L_3=R+r$.
A.2. Characteristic angle  $\theta _c$ and overlap event (3.3)

The characteristic angle  $\theta _c$ can be determined according to the lattice structure. For a triangular lattice (figure 7a), $\theta _c=60^\circ$ (Holtzman & Segre Reference Holtzman and Segre2015). For a square lattice (figure 7b), $\theta _c=45^\circ$. The $\alpha$ value at which an overlap event may occur is taken as $\max [\theta _c,2\theta _c-\min (\alpha _{touch},\alpha _{burst})]$, i.e. (3.3). This is to consider the status of the neighbour meniscus, i.e. before the neighbour meniscus becomes unstable. Figure 7(c) shows an example where before the neighbour meniscus bursts, the current meniscus (meniscus of interest) needs to advance further in order to overlap with the neighbour meniscus. As a result, the value of $\alpha _{overlap}$ for the current meniscus is $2\theta _c-\alpha _{burst}$.

Figure 7. Schematics: (a,b) characteristic angles for triangular and square lattices, respectively; (c) consideration of neighbour meniscus position for  $\alpha _{overlap}$.
A.3. Sharp edge pinning effect
The meniscus can be pinned at a sharp edge, and the unpin angle can be determined based on a purely geometrical extension of the Young–Dupre equation (Gibbs Reference Gibbs1961; Oliver et al. Reference Oliver, Huh and Mason1977; Wang et al. Reference Wang, Pereira and Gan2021)
 \begin{equation} \theta_{unpin}=\theta_0+(180^\circ{-}\alpha), \end{equation}
where  $\alpha$ is the local corner angle (figure 8). When the surface is perfectly smooth, $\alpha =180^\circ$ and $\theta _{unpin}=\theta _0$. For a 100-edge polygon (current work), the unpin angle is $\theta _{unpin}=\theta _0+(180^\circ -176.4^\circ )=\theta _0+3.6^\circ$, i.e. the meniscus advances (or unpins) only when the contact angle exceeds $\theta _{unpin}$. This effectively makes the specified intrinsic contact angle $3.6^\circ$ smaller than the one during simulation. To take this into account, the black dotted line in figure 4(b) is shifted $3.6^\circ$ degrees to the left.

Figure 8. Schematic showing the meniscus pinning at a sharp edge.


 Open access