


1. Introduction
Turbulent wakes behind bluff bodies are produced when shear layers, forming at points of flow separation interact, and such shear flows can develop significant cavitation depending upon the cavitation number. Cavitating shear flows can lead to vibration, loss of hydrodynamic performance and surface erosion. The interaction between cavitation and the underlying turbulent shear flow is critical for understanding the effects of these flows, and has been examined in a number of studies. From a cavitation inception perspective,the studies of Katz (Reference Katz1984), O'hern (Reference O'hern1990) and Iyer & Ceccio (Reference Iyer and Ceccio2002) discuss the fundamentals of cavitation inception and bubble–vortex interactions in planar shear flows. In addition, a good review, related to the topic, can also can be found in Arndt (Reference Arndt2002).
Developed cavitation in wakes behind bluff bodies has been examined by Kermeen & Parkin (Reference Kermeen and Parkin1957), Young & Holl (Reference Young and Holl1966), Ramamurthy & Bhaskaran (Reference Ramamurthy and Bhaskaran1977) and Belahadji, Franc & Michel (Reference Belahadji, Franc and Michel1995), among others. These studies have highlighted the role of the presence of developed cavitation leading to substantial changes to the vortex shedding process compared with single-phase flow at the same Reynolds number. Young & Holl (Reference Young and Holl1966) studied cavitation in wakes of triangular prisms of different angles and found that the vortex shedding Strouhal number increased with decrease in cavitation number, attaining a peak, before dropping again. The authors hypothesised that cavitation in the vortex produced a ‘sink effect’ in the wake. Ramamurthy & Bhaskaran (Reference Ramamurthy and Bhaskaran1977) observed a similar phenomenon, and Belahadji et al. (Reference Belahadji, Franc and Michel1995) studied cavitation in the wake of a triangular prism in detail. They characterised cavitation flow in different parts of the wake, and also observed an increase in shedding Strouhal number with cavitation. They postulated that cavitation altered the connection between vortex elongation rate and rotation rate, as well as the vortex convection speed due to the added mass of a cavitating vortex core. In a numerical study, Gnanaskandan & Mahesh (Reference Gnanaskandan and Mahesh2016) studied cavitation in the near-wake of a circular cylinder at low Reynolds numbers. They observed that the change in observed Strouhal number can be explained by the change in the wake formation length defined using cross-stream velocity fluctuations, similar to Gerrard (Reference Gerrard1966). They also suggested the importance of vorticity dilation that was produced as a consequence of cavitation. In addition, they also found that the low speed of sound, due to cavitation, resulted in propagating pressures waves that altered the forces experienced by the cylinders.
In these previous studies, the significant effect that developed cavitation had on bluff body wake dynamics was consistently observed, but the underlying flow mechanisms responsible for the observed behaviour was not fully explored. One of the major experimental challenges is that as cavitation develops and the mean volume fraction of the wake flow increases, it becomes increasingly difficult to make experimental observations within the bubbly flow. This has presented a significant obstacle in understanding the dynamics of cavitating wakes at high Reynolds numbers. In the present work, we use detailed experimental visualisation using high-speed cinematography and X-ray densitometry to investigate the near- and far-wake cavitating flow in the wake of a bluff body. With the help of these measurements, a physical explanation for how the inception and development of cavitation fundamentally alters the formation and shedding process will be presented. Specifically, the effect of compressibility of the bubbly mixture on the shedding dynamics will be explored.
To understand the effect of cavitation on wake dynamics and structure, the mechanics and dynamics of non-cavitating single-phase wakes are briefly reviewed. The structure and properties of single-phase wakes behind bluff bodies have been studied extensively as discussed in Bearman (Reference Bearman1967) and Williamson (Reference Williamson1997). One of the prime areas of focus has been the estimation of the Strouhal number of the shed vortices, vortex-street spacing and the drag experienced by the bluff body with change in Reynolds number. Analytical studies by Roshko (Reference Roshko1955, Reference Roshko1993), and Saffman & Schatzman (Reference Saffman and Schatzman1982) reveal the dependence of wake shedding dynamics, mainly the Strouhal number, on drag and Reynolds number. Roshko (Reference Roshko1961) discusses the effect of Reynolds number regime based on experimentally observed shedding dynamics across a range of Reynolds numbers. Roshko (Reference Roshko1993) and Balachandar, Mittal & Najjar (Reference Balachandar, Mittal and Najjar1997) employed the notion of a force balance between the pressure, Reynolds stress and shear-stress-induced forces in the near-wake to understand the vortex formation processes. To obtain a scaling for the observed Strouhal number and drag for various Reynolds number ranges, a number of length scales have been suggested. The cross-stream length of the bluff body was the most commonly used characteristic length scale, but this length does not provide a general scaling for the shedding frequency (Strouhal number). Researchers have, in turn, proposed length scales that are related to the near-wake flow itself. Gerrard (Reference Gerrard1966) discussed how entrainment of fluid in the near-wake changes the vortex shedding and dynamics in the far-wake, defining a formation length of the near-wake as the most physically appropriate length to scale the vortex shedding process.
The effect of single phase compressibility at various inflow Mach numbers on the wake shedding frequency was studied by Nash, Quincey & Callinan (Reference Nash, Quincey and Callinan1963). They found that shedding frequency had a dependence on the Mach number of the incoming flow, and increased abruptly at transonic speeds. Nakagawa (Reference Nakagawa1987, Reference Nakagawa1989) studied the wake generated by a square prism at transonic speeds using holography, and unsteady pressure measurements at various locations. They found that the shedding Strouhal number depended on the incoming Mach number and increased abruptly when shock waves were present in the wake. This study suggests that compressibility effects in the near-wake may play a role in influencing the wake dynamics. Humble, Scarano & Van Oudheusden (Reference Humble, Scarano and Van Oudheusden2007) examined single-phase, high-Mach-number base flow in the wake of a wedge using proper orthogonal decomposition (POD) of experimentally measured velocity fields in the near-wake region to investigate the wake dynamics. They identified a pulsating mode, aligned with the wake axis at prominent at high Mach numbers, as compared with a sinusoidal mode which was more prevalent at low Mach numbers. This is an observation that will be returned to in this study.
Cavitating bubbly wakes can develop and sustain relatively high volume fractions, and in turn the speed of sound in such bubbly mixtures can be significantly reduced. Crespo (Reference Crespo1969), Brennen (Reference Brennen2005, Reference Brennen2013), Shamsborhan et al. (Reference Shamsborhan, Coutier-Delgosha, Caignaert and Nour2010) and Prosperetti (Reference Prosperetti2015) discuss this phenomenon in detail. Recently, Ganesh, Mäkiharju & Ceccio (Reference Ganesh, Mäkiharju and Ceccio2016) and Wu, Ganesh & Ceccio (Reference Wu, Ganesh and Ceccio2019) showed that under certain cavitating conditions, propagating bubbly shock waves occurred as a result of reduced speed of sound, altering cavity shedding dynamics. Budich, Schmidt & Adams (Reference Budich, Schmidt and Adams2018) and Bhatt & Mahesh (Reference Bhatt and Mahesh2020) in another detailed study verified the presence of condensation shocks in partial cavity flows by modeling cavitation, taking into account changes produced in the compressibility of the mixture. More recently, Brandao, Bhatt & Mahesh (Reference Brandao, Bhatt and Mahesh2020) performed a numerical study on the cavitation dynamics in the wake of a circular cylinder and identified the presence of shock waves that cause cavity shedding. Thus, the effect of compressibility on the observed shedding dynamics in cavitating wakes needs to be further explored.
In the present study, we seek to explore the role of mixture compressibility in altering cavitation dynamics in the wakes of bluff bodies, and develop a physical explanation linking the formation of cavitation with the increased vortex shedding rate observed by Young & Holl (Reference Young and Holl1966), Ramamurthy & Bhaskaran (Reference Ramamurthy and Bhaskaran1977), Belahadji et al. (Reference Belahadji, Franc and Michel1995) and others. We use time-resolved X-ray densitometry measurements to study void-fraction variations in the wake behind a triangular prism, combined with dynamic and static base pressure measurements. Based on the measurements and visual observations of the wake flow, we develop a hypothesis to explain how the presence of developed cavitation leads to increasing compressibility (Mach number) in the wake flow that, in turn, results in a change in the underlying flow pattern of the near-wake, leading to an increase in the vortex formation rate. We test our hypothesis by injecting non-condensable gas into non-cavitating wake flow at the wedge base, in order to illustrate how the dynamics of the flow are altered when the bubbly mixture is stiffened compared with one composed mainly of water vapour.
2. Experimental set-up
Cavitation experiments were performed at the University of Michigan, using their 9 in. recirculating water tunnel. The tunnel is equipped with a de-aeration system that facilitates nuclei control. Flow speed in the test section can be varied from 2 to  $15\ \textrm {m}\ \textrm {s}^{-1}$, and static pressure from near vacuum to 200 kPa absolute pressure. For the current study, the test-section size was further reduced to a square conduit of 76 mm by 76 mm (3 in. by 3 in.). This was done to achieve lower baseline X-ray attenuation as compared with a 9-in. test section.
A schematic of the flow set-up is shown in figure 1. Static pressure ( $p_0$) is measured at the inlet of the reduced test section using an Omega Engineering PX20-030A5V, 0 to 208 kPa, absolute pressure transducer with stated accuracy of 0.08 % of full scale. Flow speed ( $U_0$) at the inlet of the reduced test section is obtained by measuring the pressure drop across the contraction downstream of a honeycomb screen to the inlet of the reduced test section. This was performed with an Omega Engineering PX409030DWU10V, 0 to 208 kPa, differential pressure transducer with an accuracy of 0.08 % of full scale. For the current study, the inlet flow speed ( $U_0$) was set to $6.0\pm 0.1\ \textrm {m}\ \textrm {s}^{-1}$, and the inlet static pressure ( $p_0$) was varied from 18 to 120 kPa. The cavitation number is defined in 2.1.
 \begin{equation} \sigma_{0}=\frac{(p_{0}-p_{V})}{\tfrac{1}{2}\rho U_0^2}. \end{equation}
Figure 1. Schematic diagram of the flow set-up. A bluff body with triangular cross-section is mounted in the reduced test section of the 9 in. water tunnel. All dimensions are in millimetres.
In (2.1),  $p_v$ represents vapour pressure and $\rho$ denotes liquid density. The cavitation number has an uncertainty of $\pm 0.1$. The experiments were conducted at a water temperature of $21 \pm 2\ \textrm {C}$.
The cavitating wake was created behind a triangular  $15^{\circ }$ wedge with a span, $S$, of 76 mm and base height, $D$, of 19 mm (0.75 in.), corresponding to a blockage of $\lambda = 0.25$. The Reynolds number based on the wedge height and inlet flow velocity was $Re = 2\times 10^5$. A static pressure tap was located at the wedge base to determine the base static pressure, $p_b$. The unsteady pressure at the wedge base was measured using a PCB 1100M1 unsteady pressure transducer, flush mounted to the wedge base. Figure 2(a) shows the wedge with the location of the static and dynamic pressure sensors. A second wedge model was constructed to permit the injection of non-condensable gas at the base of the wedge, figure 2(b) shows a schematic drawing of the wedge equipped for gas injection. Forty injection ports with a diameter of 0.5 mm spaced 1.9 mm apart along the centreline of the base were added. The static pressure was measured through the 0.25 mm diameter hole. For injection experiments, the inflow rate was measured and controlled with an Omega FMA 5523 mass-flow controller with a range of 0–15 standard litres per minute $(\textrm {SLPM}) \pm 0.225$ SLM.

Figure 2. Schematic images of the two wedge models with a  $15^{\circ }$ wedge angle, a span, S, of 76 mm and base height, D, of 19 mm. Model (a) was used for the experiments without gas injection and shows the location of the static and dynamic pressure sensors, with the dynamic pressure sensor face flush to the wedge base, and a static pressure port of 0.25 mm diameter. Model (b) was constructed to permit gas injection at the base of the wedge, replacing the pressure transducer, port with 40 injection ports with a diameter of 0.5 mm, spaced 1.9 mm apart.
The cavitating flow was imaged using two Vision Research Phantom v710 high-speed video cameras, one placed along the spanwise direction (side view) and another placed along the transverse direction (top view). These cameras have a resolution of  $1280\times 800$ pixels. The top view camera used a Nikon AF-P DX NIKKOR 18–55 mm $f$/3.5–5.6 G VR Zoom Lens and the side-view camera was equipped with a Nikon Micro-NIKKOR-P 55 mm f/3.5–32 Auto lens. The frame rate of the video recordings was 5000 frames per second (fps), with a 35 microsecond exposure time. The camera was triggered manually. Visualisation of the non-cavitating shed vortices was accomplished through the injection of a mixture of milk and iso-propyl alcohol of equal proportion from the static-pressure port at the base of the wedge. TTL signals generated by a Stanford DG535 delay generator were used to trigger the cameras and the data acquisition system. Data were acquired with a National Instruments BNC-2110 DAX module with a LabVIEW 2012 interface. A Bruel & Kjaer hydrophone was placed in a water pocket on the top window to measure acoustics of cavity dynamics. The hydrophone signal was filtered by a band pass of 10 to 200 kHz using a Krohn-hite filter with a gain of 20 dB and sampled at a rate of 10 kHz. Details of the experimental set-up can be found in Wu (Reference Wu2019).
The Strouhal number,  $St$, employed here is defined in (2.2) as
 \begin{equation} St=\frac{fD}{U_0}, \end{equation}
where f is a frequency of interest, typically the vortex shedding rate. The uncertainty in  $St$, estimated based on the width of the frequency peak in the fast Fourier transform, is $\pm 0.01$. The pressure coefficient at the base, ( $C_{PB}$) is defined as
 \begin{equation} C_{PB}=\frac{(p_{B}-p_{0})}{\tfrac{1}{2}\rho U_0^2}. \end{equation}
and the uncertainty in  $C_{PB}$ is $\pm 0.05$.
The spatial and temporal variation of vapour content in the flow, designated by void fraction, was measured using time-resolved X-ray densitometry. Spanwise averages of volume fractions are determined through measurement of the line-averaged attenuation (Beer–Lambert's law). The system used has been described and evaluated by Mäkiharju et al. (Reference Mäkiharju, Gabillet, Paik, Chang, Perlin and Ceccio2013), Ganesh et al. (Reference Ganesh, Mäkiharju and Ceccio2016), Mäkiharju, Ganesh & Ceccio (Reference Mäkiharju, Ganesh and Ceccio2017) and Wu et al. (Reference Wu, Ganesh and Ceccio2019). The frame rate of the imaging system is 1000 fps. The spatial resolution of the volume fraction fields is 0.125 mm. The instantaneous volume fraction has an uncertainty of  $\pm 2\,\%$, and the time-averaged value is $\pm 0.5\,\%$.
3. Cavitating wake flow
The cavitating wake flow behind the wedge was characterised by recording the wake shedding frequency, vortex-street spacing and base static-pressure coefficient. A schematic drawing of the wake flow is shown in figure 3, with definitions of the near- and far-wake, and far-wake vortex spacing. Cavitation inception occurred at  $\sigma _0 = 4.8$, mostly along the streamwise secondary vortices in the near-wake region. Under these conditions, the far-wake was not visualised by cavitation. To aid the visualisation of vortex spacing, the incipient cavitating wake was injected with dye. With a reduction in $\sigma _0$, the cavitation extent increased, filling the cores of the spanwise vortices in the near-wake region, and bubbles were captured in the cores of the far-wake vortex street, permitting them to be visualised. As the cavitation developed, the rate of vortex shedding increased, and at a cavitation number of about $\sigma _0 = 1.8$, the vortex shedding frequency reached a peak value. With a further reduction of cavitation number, the shedding rate reduced and the length of the near-wake increased. Continued reduction of $\sigma _0$ led to the wake extending further downstream and filling with vapour, trending toward a super-cavity (Ceccio Reference Ceccio2010).

Figure 3. Schematic drawing of the wake flow, with definitions of the near- and far-wake, and far-wake vortex spacing. The flow is from right to left.
The vortex shedding Strouhal number,  $St$, vortex spacing, $B/A$, and base pressure coefficient, $C_{PB}$, were determined for a range of $\sigma _0$, as presented in figure 4(a). Here $St$ corresponds to the vortex shedding frequency, and was estimated using the dynamic pressure transducer located at the wedge base. A sample pressure signal and its correspond power spectral density are shown in figure 4(b). The Strouhal number $St$ based on pressure measurements compared well with $St$ estimated from high-speed cinematography and time-resolved X-ray measurements. As observed in previous studies, $St$ increases with decreasing cavitation number, attaining a peak close to $\sigma _0 = 1.8$, after which the shedding frequency drops. The base pressure coefficient, $C_{PB}$, has an almost monotonically decreasing trend, beginning to decrease close to the occurrence of peak $\sigma _0 = 1.8$. This suggests that the form drag on the wedge increases only after the peak in shedding frequency is reached. The vortex spacing, B/A, was determined by examining the video images slightly downstream of the near-wake region that had filled with vapour for cavitating cases. Lack of optical access, and dye diffusion prevented the estimation of B/A in the very far-wake. Vortex spacing B/A initially increased with decreasing $\sigma _0$, attaining a peak value near the peak St.

Figure 4. (a) The vortex shedding Strouhal number, St ( $\bullet$), vortex street spacing of the far-wake, B/A ( $\blacklozenge$), and the base pressure coefficient, $-C_{PB}$ ( $\blacktriangledown$), plotted against cavitation number. Uncertainties in Strouhal number, B/A and $-C_{PB}$ are $\pm 0.01$, $\pm 0.03$ and $\pm 0.05$, respectively. (b) Flush mounted pressure transducer signal and its corresponding power spectral density.
Cavitation events at  $\sigma _0 = 4.8$, 2.7, 1.9, 1.8, 1.6 and 1.3 were examined.
The basic flow parameters measured for five of the conditions examined in detail are listed in table 1. In table 1,  $L_{C}$ and $H_{C}$ denote the length and height, respectively, of the cavity estimated from time-averaged X-ray measurements; $L_{f}$ denotes formation length based on maximum void-fraction fluctuations; $\alpha _{max}$ denotes maximum instantaneously observed void fraction; $\bar {\alpha }_{max}$ is the maximum time-averaged void fraction; ${\alpha }^{\prime }$ denotes the fluctuation in void fraction from the mean; ${\alpha }^{\prime }_{max}$ denotes maximum instantaneous fluctuation; and $M_{W,max}$ is the maximum instantaneous Mach number estimated based on base pressure, void-fraction fields and velocity at the point of separation.
Table 1. Parameters used for six cavitation numbers for wedge flow.

Cavitation inception occurred at an inlet cavitation number around  $\sigma _0 = 4.8$, where vapour began to visibly fill the streamwise secondary vortices that formed and stretched in the near-wake region behind the wedge. This observation is consistent with Katz (Reference Katz1984). Bubbles were not observed in the far-wake vortices. Figure 5(a,b) shows top and side views of the incipient flow near the base of the wedge, and figure 5(c) the vortex street visualised by dye. The spanwise averaged volume fraction of this flow was below the measurement uncertainty to be able to provide useful visualisation with the X-ray system, being less than 1 %. With a reduction in cavitation number to $\sigma _0 = 2.7$, the extent of cavitation in the near-wake increased. Spanwise vortex cores were filled with vapour, and there was cavitation present in secondary streamwise vortices downstream of the near-wake region, as shown in figure 6. Instantaneous, spanwise averaged void-fraction fields are shown in figure 7. The instantaneous spanwise averaged void fraction exceeded $\alpha = 0.4$, indicating the presence of significant local vapour fractions in the wake.

Figure 5. Incipient cavitation,  $\sigma _0 = 4.8$. The top (a) and side views (b) on the incipient cavitation, and visualisation of the far-wake showing the vortex spacing B/A (c).

Figure 6. High-speed video snapshots from the top and side of a cavitating wake at  $\sigma _0 = 2.7$.

Figure 7. Void-fraction time series of a cavitating wake at  $\sigma _0 = 2.7$.
With a further reduction in cavitation number to  $\sigma _0 = 1.9$, both the vortex shedding frequency, and extent of cavitation increased. Vapour was observed in the first few pairs of vortices of the shed vortex street downstream of the near-wake region as well as in secondary vortices, as shown in figure 8. Figure 9 shows the typical shedding cycle with instantaneous void-fraction flow fields, and cavitation in the vortex cores downstream of the near-wake region is clearly visible. The peak shedding rate occurred at $\sigma _0 = 1.8$, which also corresponds to the peak instantaneous volume fractions observed in the flow, and shown in figures 10 and 11. At $\sigma _0 = 1.8$, the instantaneous spanwise averaged void fraction reached a maximum value of $\alpha = 0.92$, indicating the presence of significant local vapour fractions in the wake.

Figure 8. High-speed video snapshots from the top and side of a cavitating wake at  $\sigma _0 = 1.9$.

Figure 9. Void-fraction time series of a cavitating wake at  $\sigma _0 = 2.7$.

Figure 10. High-speed video snapshots from the top and side of a cavitating wake at  $\sigma _0 = 1.8$.

Figure 11. Void-fraction time series of a cavitating wake at  $\sigma _0 = 1.8$.
With a further decrease in cavitation number to  $\sigma _0 = 1.6$, the shedding frequency decreased from the peak value. Cavitation still occurred in the secondary vortices, but the extent of cavitation in the shed vortex street increases. The vaporous region in the near-wake increased in the streamwise direction, due to the presence of larger cavitation structures in the shear layers, leading to substantially more liquid flow near the base, as shown in figures 12 and 13. At $\sigma _0 = 1.3$, the cavity wake filled with vapour and extended farther downstream. Images of the cavity suggest it is full of vapour, figure 14, but X-ray imaging shows that the wake is still a bubbly mixture, as shown in figure 15. For this condition, the shed vortex street was not observable in the viewing section, although a dynamic wake with vortex formation and shedding at the aft of the developed cavity was evident. Interestingly, the instantaneous spanwise averaged void fraction was reduced from its peak to a value of $\alpha = 0.82$, even at a lower overall static pressure.

Figure 12. High-speed video snapshots from the top and side of a cavitating wake at  $\sigma _0 = 1.6$.

Figure 13. Void-fraction time series of a cavitating wake at  $\sigma _0 = 1.6$.

Figure 14. High-speed video snapshots from the top and side of a cavitating wake at  $\sigma _0 = 1.3$.

Figure 15. Void-fraction time series of a cavitating wake at  $\sigma _0 = 1.3$.
4. Average and time-varying void fraction in the wake
The void-fraction flow fields acquired at a rate of 1000 Hz over a duration of 0.787 s, were used to determine the mean, root mean square (r.m.s.) and root-mean-square deviation (RMSD) of the spanwise averaged vapour void fraction. Measurements for a range of cavitation numbers are shown in figure 16. It is interesting to note that the peak values of volume fraction occur during the condition of maximum shedding rate, as opposed to conditions approaching a super-cavity. Time-resolved void-fraction measurements were used to generate profiles of the average volume fraction along several downstream sections, as shown in figure 17.

Figure 16. (a) Time-averaged, (b) r.m.s. and (c) RMSD of void-fraction flow fields at  $\sigma _0 = 2.6$, 1.9, 1.8, 1.6 and 1.3. Note that the maximum scale of RMSD is 0.25 compared with 0.50 for mean and r.m.s.

Figure 17. Void-fraction profiles and different streamwise locations. Uncertainties in mean void-fraction values  $\alpha _{mean} = \pm 0.01$. (a) $X/D = -0.5$; (b) $X/D = -1.0$; (c) $X/D = -1.5$.
From figures 16 and 17 several observations can be made. At a higher cavitation number,  $\sigma _0 = 2.6$, maximum void-fraction (mean, r.m.s. and RMSD) variation occurred within the near-wake spanwise vortical structures. For higher cavitation numbers, the presence of vapour began to influence the underlying single-phase dynamics, as manifest by comparison with the non-cavitating condition for a Strouhal number of 0.5. At cavitation numbers close to the Strouhal-number peak, $\sigma _0 = 1.9$ and 1.8, maximum void fraction (mean, r.m.s. and RMSD) variation occurred within the near-wake cavitating region, not only the vortex cores. Measured void-fraction values were significantly higher than those observed at a cavitation number of $\sigma _0 = 2.6$. In this region, the observed Strouhal number increased, suggesting the importance of the presence of vapour in the near-wake cavity region in affecting the underlying flow dynamics. At $\sigma _0 = 1.3$, maximum void-fraction variations are observed within the cavitating shear layer separating from the wedge base. It is very likely that for this condition, the presence of large regions of cavitation within the shear layer can result in a flow scenario different from the two conditions discussed previously. Brandao et al. (Reference Brandao, Bhatt and Mahesh2020) presented averaged void-fraction profiles observed downstream of a cavitating cylinder wake. Upon comparison, the overall topology of void-fraction fields look similar to the present study, except for the location of a maximum void-fraction region. In their study, maximum void-fraction was observed near the cylinder surface, within the separated region. In the present study, the effect of separation point and its oscillation on the void-fraction flow field is not present because of the truncated wedge base.
Based on averaged void-fraction flow fields, three length scales of interest can be defined. The cavity length,  $L_C$, is defined as the distance from the base to the cavity edge, where mean volume fraction of $\alpha _{mean} = 0.05$. The cavity width, $H_C$, is defined as the maximum cross-stream extent of the cavity thickness, reaching a value of at least $\alpha _{mean} = 0.05$. The cavity formation length, $L_F$, is defined as the downstream distance from the wedge base to the location of maximum void-fraction fluctuations.
These values are plotted, in figure 18, as a function of cavitation number, where power-law regressions are also shown. As discussed earlier, Gerrard (Reference Gerrard1966) suggested that the shedding rate can be scaled using a formation length based on the downstream length of the near-wake where the vortex cutting process takes place. This is typically defined as the centreline location downstream of the bluff body where the vertical velocity fluctuations reach a maximum. In the present study, we do not have measurements of velocity in the cavitating near-wake. However, the time resolved X-ray densitometry fluctuations in void fractions can be measured, and used to develop an analogous length scale,  $L_F$. In the classical single-phase scaling, an increase in the formation length would lead to a decrease in the vortex shedding frequency. However, in the cavitating case here, the shedding rate increases with the modest increase in $L_F$, albeit based on void-fraction fluctuations. Thus, the changes observed in void-fraction-based formation length $L_F$ is not adequate to explain the observed increase in the shedding rate. This suggests that unlike the single-phase flow in which the formation length can aid the explanation of change in shedding characteristics, the presence of vapour in the near-wake could involve a different mechanism that is represented by fluctuations in void fraction. Depending upon the amount of vapour present, other effects, mainly the compressibility of the bubbly mixture can become important. For instance, maximum instantaneous void fraction increases with a reduction in cavitation number, $\sigma _0$, as shown in figure 19. As the maximum volume fraction observed in the near-wake increases to a peak value, the observed Strouhal number, figure 19, also increases. This trend continues as the peak in shedding rate is passed, and the two curves diverge only when the cavity develops into a super-cavity. As mentioned previously, one of the important effects of the presence of vapour-filled mixtures is reduced speed of sound and, hence, the onset of mixture compressibility effects. The presence and consequence of these effects are explored in the next section.

Figure 18. Variation of cavity length  $L_c/D$ ( $\blacktriangledown$), maximum width $H_c/D$ ( $\blacktriangle$) and formation length $L_f/D$ ( $\blacksquare$) with $\sigma _0$ and their corresponding trend lines $L_c/D = 4.4\sigma _0^{-1.61}, H_c/D = 1.3\sigma _0^{-0.44}, L_f/D = 1.6\sigma _0^{-1.45}$. Uncertainties in $L_c/D$, $H_c/D$, $L_f/D$ is $\pm 0.07$.

Figure 19. Strouhal number St ( $\bullet$) and maximum instantaneous void fraction $\alpha _{max}$ ( $\blacksquare$) variation with inlet cavitation number $\sigma _0$. Uncertainty in Strouhal number and maximum instantaneous void fraction are $\pm 0.01$ and $\pm 0.05$.
5. Mach number of the bubbly wake
Cavitating bubbly flows at high void fractions can have low speed of sound by virtue of the coupling between the phases, and can make a bubbly mixture flow susceptible to compressibility effects, such as shocking. Recently, Ganesh et al. (Reference Ganesh, Mäkiharju and Ceccio2016) and Wu et al. (Reference Wu, Ganesh and Ceccio2019) reported the presence of such bubbly shock waves, a phenomenon related to the compressibility of the bubbly cavitation flow, to be a dominant mechanism of shedding of partial cavities. The presence and the role of bubbly shock waves in partial-cavity shedding dynamics have been recently verified by Budich et al. (Reference Budich, Schmidt and Adams2018), Bhatt & Mahesh (Reference Bhatt and Mahesh2020) and Brandao et al. (Reference Brandao, Bhatt and Mahesh2020).
The speed of sound within the bubbly mixture depends upon the local void fraction, local pressure, and thermodynamic properties of the phases. Depending upon the complexity of the physical processes considered, several expressions for the speed of sound can be formulated. Brennen (Reference Brennen2005) presents an approximate relationship for the speed of sound in a two-phase mixture (neglecting surface tension of the gas bubble and assuming a perfect gas) as
 \begin{equation} \frac{1}{C_M^2}=[\rho_L(1-\alpha)+\rho_G\alpha]\left[\frac{\alpha}{kP_M}+\frac{(1-\alpha)}{\rho_L C_L^2}\right].\end{equation}
In (5.1),  $\alpha$ is the void fraction, $\rho _L$ is the density of the liquid, $\rho _G$ is the density of the gas, k the polytropic coefficient, $P_M$ is the local mixture pressure and $C_L^2$ is the speed of sound through the fully liquid phase.
For a mixture of water liquid and water vapour when the local void fraction  $\alpha$ is sufficiently greater than zero, ${\alpha }/{k P_M} \gg {(1-\alpha )}/{\rho _L C_L2}$ and $\rho _G \alpha \ll \rho _L(1-\alpha )$. Thus, the formula can be simplified to the following expression
 \begin{equation} C_M^2 = \frac{k P_M}{\rho_L \alpha (1-\alpha)}. \end{equation}
The speed of sound expression used in this study is close to the homogenous frozen speed of sound, where it is assumed that there is no heat transfer between the phases in the process of sound transmission. Other simpler expressions for the speed of sound involve the use of the homogenous equilibrium speed of sound, where both phases are assumed to be in thermodynamic equilibrium. Equilibrium values of the speed of sound are lower than the frozen speed of sound, and Budich et al. (Reference Budich, Schmidt and Adams2018) discusses the importance of using equilibrium sound speed for cavitating flows. In reality, the actual speed of sound is somewhere in between the values predicted by frozen and equilibrium speed of sound. In a study in cavitation behind a backward-facing step, it was found that defining Mach number based on the frozen speed of sound predicted the onset of propagating bubbly shocks better than the equilibrium speed of sound (Bhatt, Ganesh & Ceccio Reference Bhatt, Ganesh and Ceccio2020). Based on this finding, frozen speed of sound is used for estimating the Mach number in the present study.
The spanwise averaged void-fraction measurements obtained using X-ray densitometry can be used to determine  $\alpha$, and base pressure measurements $p_B$ can be used to approximate the mixture pressure in the near-wake, $P_M$. In reality, the pressure distribution in the near-wake is not a constant as assumed above. Nevertheless, such an assumption helps quantify the reduction in speed of sound and hence the effect of local compressibility.
Speed of sound estimated using (5.2) can be compared with a relevant velocity scale to estimate the Mach number. Owing to the lack of availability of local velocity measurements, the liquid velocity at the wedge separation point is chosen. Velocity at the wedge apex (separation point) dictates the shedding frequency in a non-cavitating flow, and comparison of the estimated speed of sound with this velocity scale is reasonable. In reality, the velocity behind the wake is less than velocity at the wedge apex.
Thus, we can estimate the local Mach number,  $M_W$, in the near-wake from
 \begin{equation} M_W=\frac{U_0}{C (1-\lambda)}, \end{equation}
where  $\lambda$ is the blockage ratio.
Figure 20 shows the instantaneous Mach number  $M_W$ (based on instantaneous void-fraction fields) variations in the near-wake for inlet cavitation numbers $\sigma _0 = 2.9$, 1.9, 1.6 and 1.3. The likelihood that the near-wake bubbly mixture becomes locally supersonic in comparison with wedge apex velocity increases with decreasing inlet cavitation number. Figure 21 shows the variation of maximum instantaneous Mach number with inlet cavitation number, and the corresponding Strouhal number. Also plotted is the fraction of the time within a measurement window, when the local speed of sound within the wake flow is supersonic in relation to the wedge apex velocity, $t_{M>1}/t_{Total}$. It is evident that the speed of sound within the bubbly mixture is close to the wedge apex velocity near the condition of maximum Strouhal number. In other words, $M_W$ becomes supersonic when the maximum Strouhal number is observed.

Figure 20. Instantaneous Mach number fields at different  $\sigma _0$.

Figure 21. Maximum instantaneous Mach number,  $M_W$ ( $\blacktriangle$), with $\sigma _0$ and the corresponding Strouhal number, St ( $\bullet$). Also plotted is the fraction of the time when any region of the wake flow is supersonic, $t_{M_W>1} / t_{tot}$ ( $\blacksquare$). Uncertainty in Strouhal number is $\pm 0.01$.
The dynamics of near-wake void-fraction flow fields at different cavitating conditions can now be explored with the hindsight gained from  $M_W$ behaviour. From both the high-speed images and the void-fraction fields, based on X-ray densitometry, three cavity shedding/collapse mechanisms were observed in the wakes. The first shedding mechanism, S1, allows the lobes to collapse from all sides. Figure 22(a) shows a time series of such a collapse, and figure 22(b) shows the corresponding estimated Mach number $M_W$. Here the flow is, on average, subsonic and thus there is a very low probability of any shock induced collapse. Instead, it is more likely that the cavity collapses by convecting into a higher pressure region. The second shedding mechanism, S2, has the vapour lobes forced from the middle of the base of the wedge to collapse towards the far-wake. Figure 23(a) shows a time series of the collapse while figure 23(b) shows the corresponding estimated Mach number. The last shedding mechanism observed, S3, appears to be a clear condensation front within the wake. It forms from the far-wake and propagates towards the base of the wedge. This is shown in figure 24(a), whereas figure 24(b) shows the Mach number fields. Shedding mechanism S3 occurs for cavitation numbers below those corresponding to peak shedding frequency, with the Strouhal number decreasing with decreasing cavitation number. Such shock-induced collapse of partial cavities in the wake behind a cylinder was also reported by Brandao et al. (Reference Brandao, Bhatt and Mahesh2020). At such low cavitation numbers, the presence of cavitation within the separating shear layer affects the underlying flow to the extent that it deviates significantly from the near-wake flow observed at higher cavitation numbers.

Figure 22. Time series of collapse dynamics for  $\sigma _0 = 2.6$ (a) and the corresponding Mach number ( $M_W$) (b). White arrows illustrate the direction of vapour pocket collapse.

Figure 23. Time series of collapse dynamics for  $\sigma _0 = 1.9$ (a) and the corresponding Mach number (b). White arrows illustrate the direction of vapour pocket collapse.

Figure 24. Time series of collapse dynamics for  $\sigma _0 = 1.3$ (a) and the corresponding Mach number (b). White arrows illustrate the direction of vapour collapse.
Table 2 indicates the distribution of the shedding mechanisms for different ranges of cavitation number.
Table 2. Shedding mechanisms observed.

6. Proper orthogonal decomposition of void-fraction fields
Spatio-temporal variation of void-fraction fields can provide insights about the underlying mechanisms by which the presence of vapour alters the shedding dynamics. Analysis of variance of void-fraction fields from their mean value can be performed using modal decomposition techniques such as POD, dynamic mode decomposition (DMD) and spectral proper orthogonal decomposition (S-POD), to name a few. A good review of the methods, their relative strengths and weaknesses can be found in Taira et al. (Reference Taira, Brunton, Dawson, Rowley, Colonius, McKeon, Schmidt, Gordeyev, Theofilis and Ukeiley2017) and Towne, Schmidt & Colonius (Reference Towne, Schmidt and Colonius2018).
In the present study, time series of void-fraction images were analysed using POD to determine the dominant modes of the cavity dynamics. POD was used to develop a series of void-fraction fields (modes) that represent a decomposition of the measured field based on variance from the mean. Each field (mode) is assigned an energy which can be interpreted as a fraction of the total variance of the original field. More information on POD can be found in Taira et al. (Reference Taira, Brunton, Dawson, Rowley, Colonius, McKeon, Schmidt, Gordeyev, Theofilis and Ukeiley2017). Recently, Brandao et al. (Reference Brandao, Bhatt and Mahesh2020) used DMD to study the dynamics of partial cavitation behind a cylinder. The presence of noise in X-ray-based void-fraction measurements used in the current study made it difficult to use DMD. Identification of dominant eigenvalues to determine the DMD modes and their growth rates was not straightforward.
POD analysis of void-fraction fields revealed two main modes based on the spatial variation of variance. The first mode is the classic sinusoidal or a cyclic mode or an asymmetric, representing the vortex-street shedding pattern as shown in figure 25(a). Variance represented by the void-fraction dynamics are asymmetric across the flow axis (centreline parallel to the flow) representing vortex shedding. This mode will be referred to as sinusoidal. The second mode, shown in figure 25(b), represents void-fraction variations that are symmetric about the centreline. Physical interpretation of this mode is more challenging than the first mode. Upon projecting the data on to this mode, coefficients of time variation represented by the mode can be obtained. Using these coefficients, it is possible to visualise the time variation represented by this mode. It was observed that the void-fraction variation represented by this mode is pulsating in nature, with the oscillations occurring along the centreline. It should be noted that POD methodology used in this study is orthogonal only in space, not time. This mode will be referred as pulsating.

Figure 25. POD modes of void-fraction flow fields in the near-wake region at  $\sigma _0 = 1.8$: (a) typical sinusoidal mode (mode 1), (b) pulsating mode (mode 2) and (c) energy distribution across the first 10 modes.
To capture most of the variance, more than two dominant modes are needed. The mode energy represented by 10 of the most dominant modes was computed, and the modes were then either classified as pulsating (P) or sinusoidal (S), as illustrated in figure 25(c) (for the case of  $\sigma _0 = 1.9$). Upon estimating energies, the total energy represented by two types of modes, sinusoidal or pulsating, is calculated, and shown in figure 26. At higher cavitation numbers, the fraction of energy represented by the sinusoidal modes dominate at greater than 50 %. It should be noted that for higher cavitation numbers represented by $\sigma _0 > 1.9$, X-ray measurements were performed when the near-wake region possessed significant amounts of vapour. For these cavitation numbers, the Strouhal number was already higher than the non-cavitating case (Strouhal number of $St = 0.5$), but less than the peak value. It is likely that the pulsating mode is already present at higher cavitation numbers measured with X-ray densitometry when the observed Strouhal number increases from the non-cavitating condition. The pulsating mode energy peaks at $\sigma _0 = 1.7$, which corresponds to where the measured shedding rate peaks. Beyond the peak, the pulsating mode energy reduces.

Figure 26. POD energy distribution in pulsating ( $\blacksquare$) and sinusoidal modes ( $\bullet$) for varying $\sigma _0$.
Physical interpretation of the occurrence and the variation of energy represented by these pulsating modes is not straightforward. One possible explanation is to compare with compressible single-phase near-wake flow. The near-wake flow of compressible wakes behind bluff bodies is complex. The flow region experiences interactions between expansion regions, reattachment of shear layers and the presence of compression regions downstream of reattachment, as mentioned in Humble et al. (Reference Humble, Scarano and Van Oudheusden2007). In addition, such near-wake regions can also exhibit ‘necking’ which occurs due to the interaction between slip lines (Schmidt & Shepherd Reference Schmidt and Shepherd2015). Downstream of the near-wake region, compressible wakes begin to resemble their incompressible counterparts depending upon a threshold value of local convective Mach number  $M_c$. On most occasions $M_c$ is represented using local velocity and the inflow speed of sound. Nakagawa & Dahm (Reference Nakagawa and Dahm2006), Nash et al. (Reference Nash, Quincey and Callinan1963) and Humble et al. (Reference Humble, Scarano and Van Oudheusden2007) discussed the behaviour of compressible wakes in detail.
A compressible cavitating wake is similar to a single-phase compressible wake. Void-fraction variation in the near-wake region of a cavitating wake results in a speed-of-sound profile downstream of the wedge. This profile can result in local regions of supersonic flow. In the very far-wake, the presence of vapour is negligible, results in an absence of compressibility effects, and the wake structure resembles that of an incompressible far-wake. Comparison of near-wake flow structures and the dynamics of a compressible single-phase wakes can provide insights into the mechanisms by which compressibility affects the near-wake dynamics of a cavitating wake.
Humble et al. (Reference Humble, Scarano and Van Oudheusden2007) examined single-phase, high-Mach-number base flow in the wake of a wedge using POD of velocity fields to examine the wake dynamics. They identified a pulsating mode, characterised by the presence of dominant symmetric streamwise motion along the axis of the wake, which was aligned with the wake axis at high Mach numbers. A sinusoidal mode was more prevalent at low Mach numbers. The presence of large-scale streamwise structures, owing to the effect of increasing compressibility, was also reported by Clemens & Mungal (Reference Clemens and Mungal1995) for a supersonic mixing layer. Wygnanski, Champagne & Marasli (Reference Wygnanski, Champagne and Marasli1986), using linear stability analysis, showed that the cyclic sinusoidal modes of a high-speed planar wake decay faster at higher Mach numbers as compared with the streamwise oscillating varicose modes. The existence of asymmetric and symmetric modes, and their dependence on Mach number for single-phase compressible wakes, gives an insight into the effects of compressibility. Similar interplay between a sinusoidal and pulsating mode observed with increasing  $M_W$ in the present study is likely to be due to the effect of increasing compressibility, until the peak Strouhal number is attained. Actual change in the kinematics of the near-wake flow owing to compressibility is difficult to conclude based solely on POD findings that are in turn based on void-fraction fields.
At cavitation numbers less than the maximum Strouhal number, the shedding frequency decreases, even though the local Mach number increases. Correspondingly, the amount of energy associated with the pulsating mode also decreases. This trend needs to be addressed. Upon examining figures 18 and 16 it is observed that both cavity length and curvature increase when  $\sigma _0 < 1.8$. The extent of cavitation on the shear layers is significant in that it resembles an open cavity with streamlines aligned along the direction of the inflow. This results in a significantly different near-wake flow that is different in topology as compared with both single-phase flows and cavitating flows at higher pressures. Such changes in topology can alter the mechanisms by which the pulsating mode can influence the Strouhal number. Nevertheless, local compressibility of mixture still plays a role in this regime as inferred by the observation of propagating discontinuities resembling a propagating bubbly shock that causes cavity shedding, as seen in figure 24. Such shocks were also observed by Brandao et al. (Reference Brandao, Bhatt and Mahesh2020) on a cavitating cylinder. Compressibility effects are manifest in this regime by the formation of such propagating shocks.
7. Injection of non-condensable gas into the wake
Injection of non-condensable gas into a cavitating wake can provide insights into the physical processes occurring within the bubbly mixture. Recently, Brandao et al. (Reference Brandao, Bhatt and Mahesh2020) found that the presence of non-condensable gas can alter the dynamics and properties of propagating bubbly shocks in a cavity behind a circular cylinder. Even though injection of a fluid into a wake can alter its dynamics significantly, it can also provide information regarding the effect of interaction of gas–liquid flow on the observed dynamics. Specifically, the effect of non-condensable gas injection on the behaviour of pulsating mode in POD of void-fraction fields, and its relationship to an increase in shedding rate, can be studied. To achieve this purpose, a series of wake observations in which a non-condensable gas was injection into the wake were conducted.
Before identifying the rate of non-condensable gas volume injection, a maximum rate of vapour production,  $Q_{v,max.}$, within a natural cavitation condition was estimated. To determine this quantity, the amount of vapour produced between two sequential void-fraction flow fields was computed. A final estimate of the maximum instantaneous rate was found by averaging over a number of shedding cycles.
Figure 27 shows maximum vapour production rate,  $Q_{v,max.}$ in standard litres per minute (SLPM) ( $\blacksquare$) after scaling for changes in wedge base pressure $p_{B}$. Figure 27 also shows $Q_{v,max.}$ in $\textrm {m}^3\ \textrm {s}^{-1}$ ( $\blacktriangle$). The wedge base pressure for natural cavitation cases depends upon the inlet cavitation number, $\sigma _{0}$, as shown in figure 4. Several observations can be made from figure 27. The rate of vapour-volume production increases with decreasing cavitation number to attain a peak. The rate of vapour volume production then decreases again with decreasing cavitation number until the wake begins to fill with vapour. The rate then increases as the cavity growth approaches a super-cavity. It is interesting to note that a local maximum vapour production rate corresponds to the inlet cavitation number, $\sigma _{0}$, of maximum vortex shedding rate for natural cavitation.

Figure 27. The maximum vapour production rate presented as a standard volumetric flow of air ( $\blacksquare$) after scaling for changes in wedge base pressure $p_B$, in SLPM. Also shown is the measured maximum vapour production rate in $\textrm {m}^3\ \textrm {s}^{-1}$ ( $\blacktriangle$).
By injecting non-condensable gas equivalent to the amount of maximum vapour production rates of natural cavitation, an equivalent natural cavity can be simulated comprising only non-condensable gas. An equivalent injection cavitation number,  $\sigma _{INJ}$, that corresponds to the gas injection rate that matches the vapour production rate of the natural cavitation at $\sigma _0$ can be defined. By injecting non-condensable gas into non-cavitating wake at rates represented by $\sigma _{INJ}$, the dynamics of a wake-filled non-condensable gas can be studied. In addition, injection of non-condensable gas of varying proportions into a cavitating wake can also be studied. Both of these scenarios are discussed.
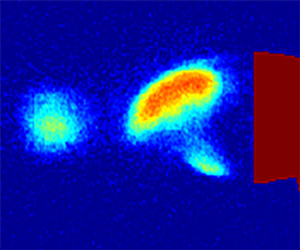
In the first experiment different amounts of non-condensable gas were injected, at a high cavitation number ( $\sigma _0 = 4.8$), where there was only limited natural cavitation. The rates injected corresponded to injection cavitation numbers of $\sigma _{INJ} = 3.2$ to 1.4. High-speed video, X-ray densitometry void-fraction flow-field measurements and acoustic hydrophone measurements were obtained at these conditions. Figure 28(a) shows a high-speed snapshot of the injection. As the gas injection rate increased, the length of the cavity behind the wedge also increased. Furthermore, from a qualitative perspective the amount of gas within the vortex cores also increased, but the amount of gas present within the cores was less than the naturally cavitating case. Figure 28(b) shows the mean void-fraction flow field for an injection rate of $Q_{air, eq.} = 8.56$ SLPM, $\sigma _{INJ} = 1.8$. The maximum mean void fraction does not reach high values, attaining a maximum of $\alpha =0.36$ for most of the injection trials.

Figure 28. (a) High-speed snapshot of non-cavitating wake flow with non-condensable gas injection. (b) Time-averaged void-fraction flow field. (c) Instantaneous void-fraction flow field. Non-condensable gas flow rate,  $Q_{air,eq.}=8.5$ SLPM, corresponding to a $\sigma _{INJ}=1.8$.
The shedding rate and corresponding Strouhal number were determined by analysing the acoustic hydrophone signals as well as direct examination of the high-speed videos. Figure 29 shows the relationship between the Strouhal number and the equivalent cavitation number,  $\sigma _{INJ}$, for the injection experiments. The non-injection (natural cavitation) Strouhal-number measurements are also compared with the shedding rate under conditions of gas injection represented by $\sigma _{INJ}$ in figure 27. Unlike the naturally cavitating flows, the flow with gas injection showed no strong effect on the vortex shedding rate, with the Strouhal number remaining essentially constant for all injection rates. Furthermore, the vortex-street spacing also did not change significantly, and remained $0.30 < B/A < 0.36$. The underlying vortex-shedding mechanism in the near-wake appears to be insensitive to the injection of non-condensable gas at $\sigma _{0} = 4.8$.

Figure 29. The relationship between Strouhal number, St, and cavitation number for the gas injection experiments as a function of equivalent injections cavitation number,  $\sigma _{INJ}$: ( $\bullet$) represents natural cavitation ( $\sigma _{0}$); ( $\blacksquare$) represents averaged hydrophone measurements based on St; and ( $\blacktriangle$) represents averaged X-ray void-fraction measurements based on St.
At  $\sigma _{0} = 4.8$, the base pressure is significantly higher than the natural cavitation conditions when the peak Strouhal number is observed. In addition, the local void fraction is also lower than natural cavitation conditions. This can result in higher speed of sound for these injection cases. The Mach number, $M_{W}$, of these flows is much lower than that of the cavitating flow, given that the mixture pressure is higher compared with the naturally cavitating conditions ( $\sigma _0 = 4.8$), as evident from (5.2). The maximum value of $M_{W} = 0.55$ at injection rates corresponding to peak shedding conditions was observed.
POD was performed for the void-fraction flow field measurements for injection trials obtained using X-ray densitometry. Figure 31 shows the energy fraction for the sinusoidal and pulsating modes as a function of  $\sigma _{INJ}$. Unlike the naturally cavitating flows, the pulsating mode consistently had lower energy compared with the sinusoidal mode. The sinusoidal mode remained dominant until the injection rate was significant enough to cause the flow to transition to a super-cavity. Upon transitioning to a super-cavity, the pulsating mode energy increased in a similar manner to that seen in the super-cavity pulsating-mode energy in the natural cavitation case.
The preceding observations suggest that the injection of non-condensable gas, equivalent to the amount of maximum vapour generated for natural cavitation cases, into an almost non-cavitating wake, does not change the shedding dynamics. In fact, the Strouhal number remains essentially a constant. At injection conditions, the base pressure  $P_{B}$ is higher and the maximum instantaneous void fraction is lower, than that of natural cavitation conditions. Consequently, compressibility effects of the bubbly gas–liquid mixture might not be prominent at high mixture pressures at $\sigma _{0} = 4.8$. This is also evident in the variation of modal energies with injection rates shown in figure 31. In addition, it should be noted that the nature of the injection process itself might play a role in the observations. Injection of gas in the near-wake can result in gas–liquid interaction in the shear layer, thereby causing changes to the inherent near-wake flow.
To study the effect of injection on compressibility in more detail, non-condensable gas was also injected at lower cavitation numbers (lower mixture pressures) when natural cavitation was also present. The injection rates chosen were a fraction of maximum vapour production rate observed for natural cavitation. Non-condensable gas was injected at  $\sigma _0 = 1.7$ and 2.1 at 0 %, 10 %, 20 % and 30 % of the natural vapour production rate at a given $\sigma _0$. It should be noted that $\sigma _0 = 2.1$ corresponds to condition along the negative slope of Strouhal number versus $\sigma _0$ at which the observed shedding frequency was less than the maximum Strouhal number. A value of $\sigma _0 = 1.7$ corresponds to the natural cavitation case at a condition in excess of the maximum Strouhal number.
Hydrophone and void-fraction flow fields were analysed to determine the shedding frequency, and are presented in figure 32. At  $\sigma _0 = 2.1$, the Strouhal number increases somewhat, before decreasing with increasing gas injection. Time-averaged void-fraction fields for the case of injection are shown in figure 30, it can be seen that the injection process results in changing the cavity-flow topology and an increase local void fraction. POD was performed on time-resolved void-fraction measurements of all fractional injection cases, and the energy distribution is shown in figure 33.

Figure 30. Average void-fraction flow fields for non-condensable gas injection at  $\sigma _{0} = 1.7$: (a) natural cavitation, (b) injection corresponding to 10 % of maximum vapour production, (c) injection corresponding to 20 % of maximum vapourproduction and (d) injection corresponding to 30 % of maximum vapour production. Changes in the cavity topology, with injection, can be clearly seen.

Figure 31. The mode energy distributed between the sinusoidal ( $\bullet$) and pulsating modes ( $\blacksquare$) as a function of equivalent injections cavitation number, $\sigma _{INJ}$.

Figure 32. The relationship between Strouhal number, St, and non-condensable gas injection rate for two cavitation numbers  $(\blacktriangle ) = \sigma _{INJ}= 2.1$ and $(\blacksquare ) = \sigma _{INJ}= 1.7$.

Figure 33. POD mode energy distributed between the sinusoidal and pulsating modes as a function of non-condensable gas injection rate for two cavitation numbers  $(\blacktriangle ) = \sigma _{INJ}= 2.1$ and $(\blacksquare ) = \sigma _{INJ}= 1.7$.
From figure 33, the POD energy associated with the pulsating mode increases with increasing Strouhal number, before dropping. As the base pressure,  $P_B$, was maintained at the same value for all rates on injection, the presence of injected gas caused an increase in void fraction. This can result in lower speed of sound, with all other parameters remaining the same. At higher injection rates, the cavity begins to change to a more open cavity (figure 30c,d), thereby reducing the Strouhal number. These observations are consistent with natural cavitation cases, and the trend between increased Strouhal number and energy represented by the pulsating mode remains related.
8. Conclusions
The influence of cavitation on the vortex shedding of bluff-body wakes has been examined with the goal of understanding the role of the presence of a high void-fraction bubble mixture in the near-wake of the bluff body in altering the shedding dynamics. Previous studies have observed that the vortex shedding rate increases with a reduction of cavitation number from inception, reaching a peak value as the cavitation develops. Further reductions in cavitation number result in the reduction of the shedding rate as the cavity further grows in extent to become a super-cavity. The underlying mechanism responsible for this phenomenon is difficult to discern owing to the problem of making observations in the high-void-fraction bubbly near-wake. In the present study, with the use of X-ray cinematographic densitometry, the effect of the mixture compressibility on the cavitating wake flow dynamics has been investigated. From the measurements it is observed that as the cavitation number is reduced, the void fraction within the wake flow increases and results in a reduction in the speed of sound within the bubbly cavitation mixture. As a consequence, the local Mach number of the flow, based on the wedge separation velocity and local speed of sound, increases with decreasing cavitation number. Wedge velocity-based Mach number becomes supersonic close to the condition of maximum observed Strouhal number. POD of void-fraction flow fields is performed to discern the change in dynamics associated due to cavitation and the effect of compressibility. POD analysis of void-fraction fields revealed the presence of a sinusoidal mode and a pulsating mode, consistent with previous studies, with higher energy in sinusoidal mode at higher cavitation numbers. It is found that an increase in Strouhal number is also accompanied by an increase in the energy represented by a pulsating mode, with the maximum energy contained by pulsating mode occurring at the condition of maximum Strouhal number. The pulsating mode, characterised by streamwise variation, is similar to the symmetric streamwise modes observed in single-phase high-speed compressible wakes and shear layers at high Mach numbers. At cavitation numbers lower than those corresponding to peak Strouhal number, the energy associated with pulsating mode decreases. This is likely to be due to the cavity transitioning into an open cavity before becoming a super-cavity when the underlying flow is dominated by the cavitating shear layers. Nevertheless, compressibility effects still prevail at lower cavitation numbers with the presence of propagating shock waves, similar to those observed in recent literature. A series of non-condensable gas injections revealed the importance of mixture pressure and local void fraction in dictating the compressibility effects as manifest by the energy within those pulsating modes associated with an increase in Strouhal number.
Acknowledgements
J.W. and L.D. contributed equally for this study.
Funding
This work was supported by the Office of Naval Research under Grant number N00014-14-1-0292, with Dr K.-H. Kim as Program Manager.
Declaration of interests
The authors report no conflict of interest.


 Open access