


1. Introduction
Situations involving the impact of a liquid on solid, or vice versa are commonly found in industrial applications. Some notable examples that occur on a large scale are hull slamming during the (re-)entry of a ship into water (Kapsenberg Reference Kapsenberg2011), the landing of sea planes or spacecraft (Abrate Reference Abrate2013), wet-deck slamming in ships or off-shore structures (Smith, Stansby & Wright Reference Smith, Stansby and Wright1998; Faltinsen Reference Faltinsen2000; Faltinsen, Landrini & Greco Reference Faltinsen, Landrini and Greco2004) and wave impacts on harbours and sea walls (Peregrine Reference Peregrine2003) and during sloshing (Dias & Ghidaglia Reference Dias and Ghidaglia2018). Liquid–solid impact events are associated with large loads that are created primarily due to the added mass effect: upon impact, a certain mass of liquid is rapidly accelerated towards the velocity of the impacting object. However, in all situations, the surrounding air can have a very non-trivial influence on the generated load, and its distribution on the solid structure (Bogaert et al. Reference Bogaert, Léonard, Brosset and Kaminski2010; Dias & Ghidaglia Reference Dias and Ghidaglia2018). One way this occurs is via aeration of the liquid phase (Bredmose, Bullock & Hogg Reference Bredmose, Bullock and Hogg2015; Ma et al. Reference Ma, Causon, Qian, Mingham, Mai, Greaves and Raby2016). More often, the air that is trapped in between the liquid and the solid affects the shape of the liquid surface (Hicks et al. Reference Hicks, Ermanyuk, Gavrilov and Purvis2012), and also plays a crucial role in affecting the loading on the solid phase (Hattori, Arami & Yui Reference Hattori, Arami and Yui1994; Peregrine & Thais Reference Peregrine and Thais1996; Wood, Peregrine & Bruce Reference Wood, Peregrine and Bruce2000; Ermanyuk & Ohkusu Reference Ermanyuk and Ohkusu2005; Bredmose, Peregrine & Bullock Reference Bredmose, Peregrine and Bullock2009). In this work, we focus on the role of trapped air. Its role in influencing the pressures can be benign, such as by mitigating pressure singularities and distributing the loads over a larger surface. On the contrary, the trapped air can also increase the duration of the loading, and cause additional damage to a solid structure by an oscillating air pocket or a cavitation implosion of the trapped air.
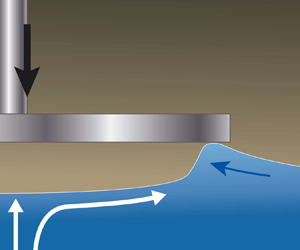
Here, we experimentally study the local pressures and forces produced on a disc that is impacted onto a water bath. Prior to the impact, the disc creates an air flow that results in it entrapping air on the impacting side of its own accord (Verhagen Reference Verhagen1967; Jain Reference Jain2020). We describe the set-up and the air trapping on the disc in § 2. The trapped air layer has been shown to cause a small reduction in the peak pressure (Chuang Reference Chuang1966) and also affect its distribution (Okada & Sumi Reference Okada and Sumi2000; Tödter et al. Reference Tödter, el Moctar, Neugebauer and Schellin2020) over the impacting face. In § 3, we report the measurements of local pressures at the centre of the disc and near its edge (see figure 1), and how the trapped air influences peak pressures. The discussion in this section is further complemented in § 4 by measuring the total impact force on the assembly with a load cell. The peak values of both are found to be very sensitive to the temporal resolution of the equipment, something that is known from the liquid-slamming literature over decades. This is connected to the fact that theoretically, in the absence of air cushioning, the moment of impact creates a temporal pressure singularity at the point of contact on the solid.

Figure 1. (a) Schematic of the set-up. A linear motor is used to impact a disc on water surface with constant velocity. Using total internal reflection (TIR), the water surface can be used as a mirror, and its behaviour observed when subjected to deflections. A load cell is installed along the rod to measure the overall force experienced in the vertical direction. (b) Design (upper figure) and dimensions (lower figure) of an 80 mm wide disc on whose surface local impact pressures are measured. The two identical sensors have a circular sensing area with a diameter of 5.5 mm. Their mounting locations – at the disc's centre, and close to its edge – are shown in panel (b).
It is known that time-integrated pressure signals, also known as pressure impulses, are a much more faithful indicator of the loading intensity (Bagnold Reference Bagnold1939; Partenscky Reference Partenscky1989; Hattori et al. Reference Hattori, Arami and Yui1994; Bullock et al. Reference Bullock, Obhrai, Peregrine and Bredmose2007). Consequently, we compute impulses from our measurements, and find them to be significantly more well behaved in the region of the peak pressures and forces. We show that the buildup of the load before the peak value is reached is mediated by the air layer, and follows inertial scaling for both pressure and force impulses. Turning to the impulse accumulated during the impact peak, the (area-integrated) force impulses are found to lie very close to the classical result of Batchelor (Reference Batchelor1967, § 6.10) and Glasheen & McMahon (Reference Glasheen and McMahon1996), while the local pressure impulses at the disc centre lie along the air-cushioned impact impulse calculation of Peters, van der Meer & Gordillo (Reference Peters, van der Meer and Gordillo2013).
2. Set-up
The experimental installation consists of a reservoir filled with water, which is contained in a tank of area  $50\,\textrm {cm} \times 50\,\textrm {cm}$. The water depth is kept fixed at 30 cm. We impact flat discs on the water bath such that their impacting surface is parallel to the stationary water surface. The disc's motion across the free surface is controlled using a linear motor, with a position accuracy of approximately 0.6 ${\rm \mu}$m. The assembly's motion is programmed such that it achieves a specified velocity when in the middle of its available stroke. Concerning the disc, the stroke is programmed such that it attains the constant, programmed-for velocity $V$, several diameters before it reaches the free surface. This constant velocity is maintained as the disc plunges roughly the same distance into the target pool; $V$ is varied in the range 0.05–3 m s $^{-1}$.
The free surface of water is both visualised directly, and using the TIR set-up, as shown by the schematic in figure 1(a) (Jain et al. Reference Jain, Gauthier, Lohse and van der Meer2021a; Jain, Gauthier & van der Meer Reference Jain, Gauthier and van der Meer2021b). When the disc and water surface are in touch, those sections of the free surface that wet the disc cease to reflect the reference pattern and effectively disappear.
We install pressure sensors on an 80 mm wide disc made of steel to measure pressures on its impacting surface. Vaseline is used to seal any gaps between the sensors and the mounting sites on the disc. The sensors used were Kistler 601CAA dynamic piezoelectric transducers, with a diaphragm width of 5.5 mm. All the pressure measurements reported throughout the paper were done with a single disc of diameter 80 mm. The sensors together cover an area of approximately 0.95 % of the disc's impacting surface. They were flush mounted on the disc as per the manufacturer's instructions. A sketch showing the dimensions of the disc and positions of the sensors is shown in figure 1(b). Pressure measurements were made at an acquisition frequency of 200 kHz, where the sensors have a natural frequency larger than 215 kHz. Additionally, we measure the overall force on the disc that is generated at impact using analogue strain gauge load cells (FUTEK LSM300). Over the range of force measurements performed, the load cell with a suitable maximum loading capacity was used – with 200 and 500 lbs, with natural frequencies of 1773 and 2499 Hz respectively. The load cells were calibrated using known weights, and measurements done using an analogue amplifier (FUTEK IAA200) with current output at an acquisition rate of 25 kHz. In this case, disc radii  $R$ are varied in the range 1–8 cm. The pressure measurements were done with a single disc of stainless steel (RVS 316), with density 8.03 g cm $^{-3}$. Force measurements were done with a number of steel discs (RVS 316), aluminium (6082 aluminium alloy, with density 2.71 g cm $^{-3}$) and 3-D printed plastic (with density 1.13 g cm $^{-3}$). Their tensile properties appear to be irrelevant even for the short time scales over which peak forces are resolved (see figure 7). Natural frequencies of the impacting assemblies attached to the respective load cells were measured, and are mentioned alongside time series where shown in the paper.
3. Air film entrapment and spatially localised loading
3.1. Air film entrapment
As the disc approaches the water surface with a finite speed, there is an intervening air layer trapped between the two. The air in this layer is squeezed out such that its flow results in a radial pressure gradient. These pressure changes are sufficiently large to deform the water surface before the disc makes any contact with it. Thus the water surface is made aware of the approaching disc in advance; at the point that lies directly under the disc centre, the liquid surface is pushed down by the stagnation pressure in the air phase. Conversely, under the disc edge, a high hydrodynamic pressure in the air creates a suction which destabilises the water surface to be sucked upwards towards the disc (Jain Reference Jain2020; Jain et al. Reference Jain, Gauthier, Lohse and van der Meer2021a). As a result, at the first moment that the disc makes contact with the water surface, the water–air interface under the disc edge is vertically separated from that under the disc centre by approximately 200  ${\rm \mu}$m. This ‘air-cushioning’ effect on the free surface invariably creates conditions to trap an air layer under the disc at its first contact with the liquid surface, as is shown in figures 2 and 3.

Figure 2. The trapping of an air film on a water-entering disc is directly seen from below the water bath at  $V = 0.06$ m s $^{-1}$ in (a), and at 0.1 m s $^{-1}$ in (b). The disc shown is 8 cm wide (as shown in figure 1b). The time labels are centred at 0 ms when the disc makes it first contact with water. The trapped air film contracts inwards due to surface tension of the water–air interface. The process is also shown in supplementary movies 1 and 2 available at https://doi.org/10.1017/jfm.2021.846. The film's retraction dynamics is discussed in Appendix A.1.

Figure 3. Snapshots of the free surface during the impact of a 12 cm wide disc at 0.5 m s $^{-1}$, recorded at 50 k f.p.s. using the TIR set-up, as shown in figure 1(a), imaging the free surface from below. The free surface is pushed down before the disc makes contact with it, which is evident from (a). The time labels shown at top left corner are centred about $t=0$ at the instant where the disc makes first contact with the deformed water surface. An air layer is trapped on the disc at impact. It collapses inwards as the disc plunges further into the liquid bath (b) and is finally punctured at the centre by the liquid (c). The puncturing process is shown in movie 4 and discussed in further detail in Appendix A.2. More examples using different parameters are shown in movies 5 and 6.
At low impact velocity  $V$, such as shown in figure 2 at 0.06 and 0.1 m s $^{-1}$, after entrapment, the air layer merely contracts inwards on account of the high surface tension of the air–water interface. It is observed that, as the surrounding water displaces air, its perimeter stays remarkably stable and consistent in shape. This is due to the interface being stabilised by the Saffman–Taylor mechanism, which is only unstable to perturbations when a less viscous liquid displaces a more viscous one. Note how at a slightly higher $V$ of 0.1 m s $^{-1}$ in figure 2(b) the air film is briefly ruptured as it passes over the sensor at the disc edge, but then continues to contract inwards, preserving the interface shape to remain as a bubble at the disc centre. The inward retraction of the film is due to the high surface tension of the air–water interface, and occurs with a constant velocity, as is discussed in more detail in Appendix A.1). Our observations of how such a trapped air bubble behaves are consistent with the observations of Mayer & Krechetnikov (Reference Mayer and Krechetnikov2018), who used a flat rectangular plate as the impactor.
At a somewhat higher impact velocity  $V = 0.5$ m s $^{-1}$ (figure 3) the trapped air film is shown at the first moment of impact in panel (a), using the TIR technique shown in figure 1(a). With this technique, all parts of the water surface that turn black indicate where the free surface has disappeared either due to wetting of the disc, or due to being ejected upward out of the initially quiescent liquid surface's plane. The moment when the disc makes first contact with the water surface can be identified when a section of the reflecting water surface disappears (i.e. turns black) by wetting the disc. In panel (b), it is observed that the air layer initially starts to collapse towards the disc centre while the disc plunges further into the liquid bath, until, in panel (c), the air bubble is punctured in the centre due to the high pressure that occurs in the stagnation point that has formed in the liquid. This particular observation is further addressed in Appendix A.2, where we present the measured puncture times. The current and additional examples of this process can be seen in movies 4–6.
For sufficiently high impact velocities, after the air layer is punctured, it is observed to be expelled from below the disc. This happens when the hydrodynamic forces that push the air outwards are stronger than the capillary forces that try to keep the air layer together.
Taking a look at the dimensionless numbers that may play a role during the impact, we note that the growth of the small cavity of thickness of order  $100\ {\rm \mu}{\rm m}$, which is formed prior to impact on the free surface, is mainly driven by the stagnation pressure in the air phase at the disc's symmetry axis. The formation of such a cavity is resisted by both surface tension and inertia of the liquid. The Weber numbers $\textit {We} = \rho _{w} V^2 R/\sigma$ that concern both the entrapment of the air film, and the subsequent impact, range between approximately $1$ and $10^4$ (using $R=1\text {--}8$ cm and $V = 0.05\text {--}3$ m s $^{-1}$; $\rho_w$ and $\sigma$ are the density and surface tension of water). The Froude number $\textit {Fr} = V^2/gR$, with g the acceleration due to gravity, lies in the range between $0.006$ and $92$. Note that, in the pre-impact stage, the liquid inertia limits free surface deformation. In this particular stage prior to impact, the effective Froude number is $\textit {Fr}\rho _{{gas}}/\rho _{{water}}$, which is much smaller than the uncorrected Froude and Weber numbers at impact. Shortly after impact, when a large slamming force is created on the impactor, the liquid experiences much larger acceleration than gravity, making the Froude number irrelevant (Iafrati & Korobkin Reference Iafrati and Korobkin2004; Peters et al. Reference Peters, van der Meer and Gordillo2013; Mayer & Krechetnikov Reference Mayer and Krechetnikov2018).
In the next subsection, we will discuss the pressures that are measured during impact by the two pressure sensors in the  $R=4.0$ cm steel disk of figure 1. Before starting this discussion, we want, however, to stress the difference in time scales in the buildup of the pressure on the one hand ( ${\ll }1$ ms), and that of the contraction ( ${\sim }100$ ms) and the puncturing ( ${>}1$ ms) and sometimes subsequent expulsion ( ${\sim }10$ ms) of the entrapped air layer on the other. This implies that, during pressure buildup, the air film can be viewed as largely stationary and covering most of the disc.
3.2. Pressure measurements
The effect of impact on pressure characteristics is found to be typical of solid–liquid impact events in general (Peregrine Reference Peregrine2003; Kapsenberg Reference Kapsenberg2011). The first contact between a transducer on the disc edge and water surface creates a large pressure spike (figure 4a,b), lasting for a short duration  ${\sim }{O}(10^{-4}\,\text {s})$. Note from figure 4(a,b) how, in examples shown for both a low velocity impact at $V = 0.075$ m s $^{-1}$ and a larger velocity of 1 m s $^{-1}$, the pressure at the disc centre starts to grow prior to that at the edge. This is due to a stagnation pressure building up in the liquid at the disc centre, whose magnitude is of the order of $\rho _w V^2$. This can be expected, since the free surface under the disc responds to the pressure buildup before the disc comes into contact with the water. The magnitude of such a pressure buildup will exist in an approximate balance with the high pressures needed to accelerate the fluid via the cushioning layer. Another important observation from (a) is that, while the time taken for the air film to retract from the edge sensor to the one at the centre is ${\approx }185$ ms (see also figure 2, Appendix A.1, and supplementary movies 1 and 2), the time gap between the pressure peaks at the two sensors is of the order of 0.1 ms (also shown in the inset figure 4b). We can conclude that the both the pressure buildup and the attainment of the peak pressure at the centre are certainly mediated by the air cushion.

Figure 4. Time series of pressures measured at the two locations on an 80 mm wide disc (see figure 1b) when it impacts on a deep liquid bath at a velocity of (a) 0.075 m s $^{-1}$ and (b) 1.0 m s $^{-1}$. The signals are centred about $t=0$ at the instant when the central pressure reaches its peak. (c) Peak pressures measured at two locations on the same disc are plotted over a range of impact velocities. Error bars show the standard deviation of peak pressures over 3–6 repetitions of the experiment at each impact velocity. The peak pressures at the centre are found to scale quadratically with $V$, whereas those near the edge of the disc are found to be slightly below those at the centre. The impact peak is always attained first at the edge sensor, irrespective of where a higher peak pressure is attained. The inset of (b) highlights this by showing the time difference $\Delta t_{{c-e}} = t_{centre} - t_{edge}$ between the times $t_{centre}$ and $t_{edge}$ at which the peak pressure is attained at the centre and the edge, respectively.
While it is clear that the first contact at the disc's edge creates the first peak pressure, it is not immediately clear where the bubble's outer perimeter lies, and what shape it has when the peak pressure at the centre (a mere  ${\sim }{O}(10^{-4}\,\text {s})$ later, inset figure 4b) is registered. The time delay $\Delta t_{c-e}$ between the peaks at the edge and centre is much shorter than the time span in which the trapped air retracts ( ${\sim }{O}(10^{-1}\,\text {s})$, also see figure 10), or over which it ruptures and fragments at higher velocities ( ${\sim }{O}(10^{-3}\,\text {s})$, also see figure 11). In addition, the impact velocity does not clearly affect $\Delta t_{c-e}$.
An oscillating component in the pressure signals with a period of  ${\sim }4$ ms is visible at all times in (a), and after the impact in (b) in figure 4. This arises from structural oscillations in the disc–rod assembly, and is also present in the data from the load cell (figure 7). The natural frequency of this impactor assembly (with the masses of rod and disc combining to approximately 502 grams) was measured with the load cell to be $236.8\pm 30.5$ Hz, corresponding to a period of approximately 4.2 ms.
Peak pressures measured from impacts done at a range of velocities are plotted in figure 4(c). Multiple repetitions of the experiment at each velocity were performed to quantify reproducibility. At low velocities ( $V \lessapprox 0.5$ m s $^{-1}$ in figure 4(c) for the present parameter $R=4$ cm), pressures at the edge of the disc were found to be higher than those at the disc's centre. The opposite, however, was observed in impacts at higher velocities. Thus, while at low velocities the impact pressures at the disc's centre are actively ‘cushioned’ by the trapped air film, for $V \gtrsim 0.5$ m s $^{-1}$, the air film appears to play a diminished role in reducing the peak pressure at the disc centre. Note that peak impact pressures at the disc centre are approximately 100 times larger than the stagnation pressure $\rho _w V^2$ in water and that they are found to scale quadratically with $V$, as expected for an inertial impact process (see figure 4c). Okada & Sumi (Reference Okada and Sumi2000) performed impact tests using a flat plate, and also found higher peak pressures closer to its centre. We thus designate impact velocities ${\gtrsim }0.5$ m s $^{-1}$ as ‘slamming’ velocities throughout the present work. At slamming velocities, the initially trapped air film does not persist – either getting punctured by the stagnation pressure ( ${\sim }{O} (10^{-3}\,\text {s})$ after impact, see Appendix A.2), or fragmenting prior to being violently expelled out from under the disc ( ${\sim }{O} (10^{-2}\,\text {s})$ after impact, movie 3). It is to be emphasised here that the threshold $V \approx 0.5$ m s $^{-1}$ (corresponding to $\textit {We} \approx 278$) is only intended to differentiate between low-speed impacts (where the entrapped air bubble contracts) and slamming impacts (where the entrapped air bubble is punctured and expelled) in the case of the $R=4.0$ cm disk.
3.3. Localised pressure impulses during impact
The most elementary measure of the intensity of an impact event is the peak pressure that is measured on the solid structure. However, in most circumstances, this peak pressure can have a large variance between tests performed at the same parameters. Since rise times of the initial impact peak can be very short  ${\sim }{O}(10^{-5}\,\text {s})$, one reason for the variance in peak pressures is often due to the limited time resolution of the sensors. Another reason very often encountered is the inconsistent role played by the ambient air that is trapped at impact. Since the first such work by Bagnold (Reference Bagnold1939) studying the effect of trapped air on peak pressures, several later works (Denny Reference Denny1951; Chan, Melville & Gaster Reference Chan, Melville and Gaster1988; Peregrine Reference Peregrine2003) have also identified that the trapped air can play an important role during the production of the initial large pressure peak. Richert (Reference Richert1969), Partenscky (Reference Partenscky1989) and Hattori et al. (Reference Hattori, Arami and Yui1994) found from wave impacts on walls that the most severe pressures were produced when there were several small air bubbles, or a very thin ‘lens shaped’ air pocket trapped along the wall. It is a general consensus that pressure impulse, or the pressure integrated over duration of the peak, is a better predictor of the amount of local damage that is caused by an impact event on the solid structure (Kirkgöz Reference Kirkgöz1990; Hull & Müller Reference Hull and Müller2002; Peregrine Reference Peregrine2003; Bullock et al. Reference Bullock, Obhrai, Peregrine and Bredmose2007; Bredmose et al. Reference Bredmose, Peregrine and Bullock2009; Dias & Ghidaglia Reference Dias and Ghidaglia2018). Indeed, pressure impulse is also found to be a much more reproducible measure of the intensity of impact than the peak value in itself (Bagnold Reference Bagnold1939; Denny Reference Denny1951; Chan et al. Reference Chan, Melville and Gaster1988; Peregrine Reference Peregrine2003; Bullock et al. Reference Bullock, Obhrai, Peregrine and Bredmose2007; Dias & Ghidaglia Reference Dias and Ghidaglia2018).
Thus we calculate the pressure impulses  $\varPi (t)$ from the measurements done at slamming velocities. They are computed by numerically integrating the pressure signal p from a time before it starts to rise $t_0$, to arbitrarily later times as
 \begin{equation} \varPi(t) = \int_{t_0}^{t} p(t')\,\textrm{d} t'. \end{equation}
Consistent with all the pressure measurements, the time coordinate of all pressure-impulse results are again centred about  $t=0$, at the instant when the central pressure reaches its maximum. This way of presenting the results allows one to focus on the early-time rise in impulse until the trapped air film collapses at the disc's centre.
Pressure impulses measured at  $V = 1.25$ and 2.5 m s $^{-1}$ are plotted in figure 5. At the disc centre, $\varPi (t)$ starts to rise earlier than at the disc's edge. This can be ascribed to an observation made earlier in figure 4(a), where it was seen that the pressure at the disc centre starts to rise before that at the edge. The difference in how the impulse at the edge grows compared with that at the centre occurs due to different behaviour of air flow in the two regions at impact. At the moment of impact, there is a trapped air film whose thickness is maximum under the disc centre. The opposite holds true at the disc edge, where the contact first happens. At slamming velocities, after the peak impact pressure is attained, the air film collapses. Immediately after this, the air that was initially trapped is fragmented and expelled from under the disc. As its escape happens from under the disc edge, fast air flow, followed by fast liquid flow, interfere with the pressure reading. That the impulse shown in figure 5 initially accumulates more smoothly at the centre than at the disc's edge suggests that impact at the disc centre is cushioned by the air layer. Indeed, the presence of air also prolongs the duration of the initial impact peak, which contributes to the impulse at the centre growing to larger values than that at disc edge (Iafrati & Korobkin Reference Iafrati and Korobkin2008).

Figure 5. Pressure impulses  $\varPi$ measured from experiments at (a) $V = 1.25$ m s $^{-1}$ and (b) $V = 2.5$ m s $^{-1}$ are plotted as time series. Experiments were done with the sensor arrangement as shown in figure 1(b). As before, all time series are centred about $t=0$, the moment when the pressure at disc centre reaches its maximum.
The air film plays this role of a cushioning layer only in the earliest stages of impact before the peak pressure at disc centre reaches its maximum. Thus, whatever subsidiary effect is caused by it, such as mitigating pressure singularities, distributing the loading and prolonging the impact, lasts for a short duration of a few milliseconds prior to  $t=0$ in figure 5. This stage is key to determining the final value of the impulse that is accumulated during the first impact peak. Noting that, inertially, pressure should scale as $\rho _w V^2$, and time as $R/V$, we expect the pressure impulse $\varPi (t)$ to scale as the product of the former. Using this inertial scaling, we non-dimensionalise the results in figure 5(a) together with data for other values of $V$ and re-plot them in figure 6. The growth of the pressure impulse at the centre prior to the peak at $t=0$ s is very well collapsed by the non-dimensionalisation. Thus, similar to the growth of stagnation pressure on the free surface under the disc's centre before impact, the air-mediated early-stage loading on the disc centre is an inertial process. This allows us to conclude that, at the disc centre, the impact impulse arises mainly due to sudden acceleration of a certain bulk of liquid by the impact. It leads us to expect that the impulse created by total force on the disc's entire surface should behave similarly to the pressure impulses as in figure 6. This indicates that early-time loading on the pressure sensor grows as it would have had the pressure sensor already been in touch with, or immersed in, the liquid. This finding is in keeping with those of Ross & Hicks (Reference Ross and Hicks2019) and Moore (Reference Moore2021), who found using a viscous air-cushioning analysis, that the initial (up to a time span of the order of $10^{-6}$ s, compared with an order of $10^{-4}$ s for our experiments) trapped volume of air moves with the same velocity as the impactor. In the added-mass sense for the surrounding (target) liquid, this trapped cushioning layer essentially acts as an extension of the solid body.

Figure 6. Non-dimensional pressure impulses  $\hat {\varPi } = \varPi /V R \rho _w$ measured at the disc centre (from figure 5) are plotted against non-dimensional time $t V /R$. The convincing data collapse in the region of interest (below $t V/R=0$ in the early stages of impact loading) reveals that the accumulation of the pressure impulse at the disc centre, when it impacts at high velocities, can be described as an inertial process.
In fact, if for our disc impact experiment one estimates the time it takes for the entrapped air pocket to reach pressures of the order of the stagnation pressure in the liquid, after which the liquid will be able to start moving, one obtains values smaller than  $10\,{\rm \mu}$s (see Appendix A.3). Since this pressurisation time is much shorter than the build-up time of the load, the latter will be dominated by what is happening in the liquid, which connects to the inertial scaling that was observed.
4. Spatially integrated loading
4.1. Force measurements and impulse calculation
We perform force measurements on the discs to check to what extent they are consistent with the pressure measurements. Some typical force measurements are shown in figure 7(a). The main features of interest around the impact peak are the same as were found in the pressure measurements. The first large peak results from the initial impact. Here, however, the forces measured by the load cell are averaged throughout the disc and rod assembly that is mounted on the linear motor. As a result, structural vibrations in the impactor dominate the measured signals shortly after  $t=0$, and drown several weaker signals that might be of interest.

Figure 7. (a) Time evolution of the impact force measured using the disc shown in figure 1(b), impacted at various velocities. The time series are centred about  $t=0$ at the time of registering peak impact force. The natural frequencies of the impacting structure used here were measured with the respective load cells. They ranged from $313.2 \pm 55.5$ Hz for the lightest disc, to $236.8 \pm 30.5$ Hz for the heaviest attachment. (b) Peak average pressure, $\tilde {P}_{{peak}} = F_{{peak}}/{\rm \pi} R^2$ computed from the force measured in experiments using discs of varying sizes, materials and impact speeds are plotted against their velocities of impact. Data shown using purple coloured markers are from experiments impacting steel discs, yellow from impacting 3-D printed plastic discs, and green markers from experiments using aluminium discs. Peak average pressures are found to deviate substantially from the previously found quadratic dependence on $V$ for the centre and (to a lesser extent) the side pressures presented in figure 4(c).
Force measurements were done using discs of different sizes and materials. The variation of peak forces with  $V$ is shown in figure 7(b). As with pressure measurements, force measurements at each set of parameters were repeated a number of times to obtain variance in the measurements. They are found to vary substantially from the quadratic scaling that peak pressures were found to follow. Instead, peak forces appear to grow as $\sim V^{1.54}$ within the experimental range of errors. Since experiments done with discs made of steel, aluminium and plastic follow a consistent trend, we can conclude that the total forces produced on the discs indeed have a hydrodynamic origin. They do not depend on the material that a disc is made from. The peak pressure deviation from a $V^2$ scaling appears likely due to limited temporal resolution of the strain gauge load cell.
However, the challenge in resolving the peak in flat plate impacts is more indicative of the very short time scales involved in this particular impact scenario, rather than only the limited resolution of the equipment. For objects such as a wedge, a cone or a sphere entering water, the wetted surface expands in time. The impact force increases with the increase in wetted area. Space-averaged (Wagner Reference Wagner1932) and Logvinovich (Korobkin Reference Korobkin2004) models for the prediction of force on a water-entering object with a non-zero deadrise angle take into account the wetting rate to predict the impact force's time evolution. Force measurements by Vincent et al. (Reference Vincent, Xiao, Yohann, Jung and Kanso2018) show how increasing the deadrise angle of the wedge increases the duration of the impact peak. El Malki Alaoui et al. (Reference El Malki Alaoui, Nême, Tassin and Jacques2012) also find well-resolved force measurements in impacting cones with deadrise angles varying in the range  $7\text {--}30^{\circ }$ while using an accelerometer with a natural frequency of 2500 Hz, and compared successfully with calculations by Shiffman & Spencer (Reference Shiffman and Spencer1951). Similarly impact drag coefficients measured by Moghisi & Squire (Reference Moghisi and Squire1981) in the liquid entry of a sphere are both well resolved and compared successfully with calculations by Shiffman & Spencer (Reference Shiffman and Spencer1945). Another indication of how the time scales at the first impact peak are affected by the curvature of the impacting face was provided by Ermanyuk & Gavrilov (Reference Ermanyuk and Gavrilov2011) by performing slamming experiments with discs with flat, convex and concave surfaces. Ermanyuk & Gavrilov (Reference Ermanyuk and Gavrilov2011) associate the greatest accelerations, and correspondingly the shortest time scales in the pressure time series, with the water impact of a disc with flat surface, followed by the convex and concave surfaces, respectively. Finally we comment that ignoring air-cushioning effects, a finite curvature of the impacting surface necessarily dilates the duration of the initial added-mass induced force peak.
However, coming back to the present experiments, and notwithstanding the limited resolution of load cell, we can numerically integrate the force measurements starting from the time when the first impact peak starts to rise. The force impulses
 \begin{equation} \mathcal{F}(t) = \int_{t_0}^{t} F(t')\,\textrm{d} t', \end{equation}
thus computed are non-dimensionalised as before using inertial length and time scales. The results are plotted in figure 8. As with pressure impulses, the growth of force impulses until the time of peak force (conveniently at  $t=0$) is well collapsed by the re-scaling. Our expectation from previous section (based on figure 6) is upheld by force-impulse measurements.

Figure 8. Non-dimensional force impulses  $\mathcal {F}/R^3 V \rho _w$ are computed from force measurements with a steel disc of radius $R = 4$ cm, impacting on water at various $V$. Each result is centred about $t=0$, the time when the corresponding impact force attains its peak value. The horizontal dashed line is drawn to mark the non-dimensional force-impulse value of 4/3. Inset: a force–time curve at $V=1$ m s $^{-1}$ is shown; the shaded area shows the time duration over which $F(t)$ is integrated to obtain $\mathcal {F}$.
After  $t=0$, the structural oscillations (signals with a period of 4 ms, visible both in figures 4(a,b) and 7(a)) become very large, and depending on the impactor's extent of submergence in the bath, are affected to varying degrees by the bath's sloshing. Notice also in the inset of figure 8, that there is a secondary peak in the force, which cannot be easily ascribed to any hydrodynamic phenomenon. This explains why the later force signals and their resulting impulses do not follow hydrodynamic scales.
4.2. Impulse due to water impact of a disc
That, in our experimental set-up, both the pressure impulses,  $\varPi (t)$, and force impulses, $\mathcal {F}(t)$, obey inertial scaling despite the presence of a cushioning air layer, is an important observation as regards to comparing the measurements with theory. Here, we start with a brief discussion of the well-known idea of pressure impulse in a fluid. The idea is useful when fluid boundaries, or a portion of the bulk, is subjected to a sudden acceleration of a large magnitude and short duration. Over this short duration, velocities of both the fluid and the boundary are small. Ignoring viscosity, Euler's equation, linearised in the velocity field $\boldsymbol {v}$, can be used to describe fluid motion (Cooker & Peregrine Reference Cooker and Peregrine1995)
 \begin{equation} \frac{\partial \boldsymbol{v}}{\partial t} ={-}\frac{1}{\rho_{{w}}} \boldsymbol{\nabla} p, \end{equation}
where both the terms are manifestly of large magnitude for a short interval of time, in which the acceleration term is dominant over the terms in Euler equation. Integrating both sides with time,
 \begin{equation} \boldsymbol{v}_{{after}} - \boldsymbol{v}_{{before}} ={-}\frac{1}{\rho_{{w}}} \boldsymbol{\nabla} \left(\int_{t_{before}}^{t_{after}} p(t')\,{\rm d}t'\right), \end{equation}
which can be integrated and re-written in terms of a scalar flow potential  $\phi$ (with $\boldsymbol {v} = \boldsymbol {\nabla } \phi$) as
 \begin{equation} \phi_{after} - \phi_{before} = \frac{\varPi(t_{{before}}) - \varPi(t_{{after}})}{\rho_w}. \end{equation}
This expresses that, in a fluid that is initially stationary, any motion produced by sudden acceleration will, at least for a short time, be irrotational. In such a fluid domain, flow potentials throughout the bulk are uniquely determined by the normal component of velocities imposed at its boundaries. The pressure-impulse calculation that corresponds exactly to the present experiment with the impact of a disc shown in Batchelor (Reference Batchelor1967, § 6.10), yielding  $\mathcal {F}_{{impact}} = 4/3R^3V\rho _{{w}}$. The same result was also arrived at in Lamb (Reference Lamb1945, § 102) by deriving the kinetic energy that is imparted to the surrounding fluid by an immersed disc that is impulsively accelerated from rest. Glasheen & McMahon (Reference Glasheen and McMahon1996) performed experiments impacting a disc on water, and measured the loss in its momentum from impact by measuring the sudden drop in its velocity (4.3). From the loss in the projectile's momentum, they estimated the added mass on the moving disc. The results were compared with the above analytical result (also in Birkhoff & Zarantonello Reference Birkhoff and Zarantonello1957), finding a good agreement.
Note that our method of computing the impact impulse differs significantly from that of Glasheen & McMahon (Reference Glasheen and McMahon1996), who could calculate the force impulse by measuring the sharp drop in projectile momentum. Their method would not be suited in our case due to the amount of control in our experiment that allows us to impose a constant velocity. In contrast, we numerically integrate the directly measured force and local pressure over the duration of the impact peak.
Although in essence both the methods to measure  $F$ relate to the added-mass coefficient being measured, the difference between the two approaches can be understood by using the following expression for the inertial force on the disc in terms of the depth of penetration $h(t)$ into the liquid phase, as derived by Iafrati & Korobkin (Reference Iafrati and Korobkin2011),
 \begin{align} F &= m_a \rho_w R^3 \ddot{h} + \rho_w {R^2} \dot{h}^2\left[a_1\left(\frac{h}{R}\right)^{{-}1/3} + a_2 \log \left(\frac{h}{R}\right) + a_0 \right] + O(1)\nonumber\\ &\approx m_a \rho_w R^3 \ddot{h} + a_1\rho_w {R^2} \dot{h}^2 \left(\frac{h}{R}\right)^{{-}1/3}, \end{align}
where  $\dot {h}$ and $\ddot {h}$ denote the first and second time derivatives of $h(t)$. Here, the first term represents the added mass (with $m_a = 4/3$) and the second term the build up of quadratic drag, between which the first contribution (with $a_1 \approx 2.7250$) is the dominant one for small $h$. Note that the quadratic drag term is diverging and therefore dominant for small $t$. Although (4.5) was explicitly derived for $t \geq 0$, such that $\dot {h} (0) = V$, we make the reasonable assumption that $\dot {h}(0^-) = 0$, and assuming the expressions’ integrability, time integrate the dominant contribution to (4.5) from $t=0^{-}$ just before impact, until some time $t=t_1$ after impact, yielding the impulse
 \begin{equation} \mathcal{F} = \int_{t = 0^-}^{t_1} F\,\textrm{d} t \approx \rho_w R^3 \left[m_a\dot{h}(t_1) + \frac{3}{2} a_1\int_{t = 0^-}^{t_1} \dot{h}\,\textrm{d}\left((h/R)^{2/3}\right)\right]. \end{equation}
One may estimate the second term by noting it is always positive and, since  $\dot {h} \leq V$ we have
 \begin{equation} \frac{3}{2} a_1\int_{t = 0 ^ -}^{t_1} \dot{h}\,\textrm{d}\left((h/R)^{2/3}\right) \leq\frac{3}{2}a_1 V \int_{t = 0 ^ -}^{t_1}\,\textrm{d} \left((h/R)^{2/3}\right) = \frac{3}{2}a_1\left(\frac{h(t_1)}{R}\right)^{2/3}, \end{equation}
that is, in contrast to its dominance in the expression for the force for small  $t$ (4.5), the contribution of the quadratic drag term to the impulse is vanishingly small for small $h$, and the impulse is dominated by the added-mass contribution, $\mathcal {F} \approx m_a \rho _wR^3 \dot {h}(t_1)$.
Clearly, when the velocity is kept constant, we find that  $\mathcal {F} \approx m_a \rho _wR^3 V$ in the inertial approximation, and one would expect the impulse to quickly converge to $m_a \rho _wR^3 V$. Any deviation would be due to secondary effects, such as liquid compressibility, which accounts for the growth of the added mass, and takes place on a time scale $R/c_w$, with $c_w \approx 1.5\times 10^3$ m s $^{-1}$ the speed of sound in water. In our experiments, this time scale is of the order of several tens of microseconds.
However, when the velocity is not controlled, e.g. when the impactor has a mass  $M$, then the impulse is not constant since $h(t)$ is the solution of the equation of $M\ddot {h} = - F + Mg$, where $F$ is given by (4.5). Even if we neglect the acceleration due to gravity $g$, this implies that $\dot {h}(t)$ is changing from its value upon impact ( $V$) to its terminal value ( $V/(1+m_a/M)$) on a time scale that is determined by the quadratic drag term, which is necessarily proportional to the inertial time $R/V$, which would be of the order of 10–100 ms for experiments similar to ours. During this time interval the force that the disc experiences is determined by the quadratic drag term in an indirect manner, namely by how it affects $h(t)$, and consequently $\dot {h}$ and $\ddot {h}$.
Thus, there is a crucial difference in free fall experiments reported before, and our experiments imposing a constant velocity. By keeping a constant velocity on the disc, we effectively suppress effects that cause variation of the added-mass terms in (4.5) and (4.6), thereby bringing the experiments closer to the classical theory. Additionally, our measurements extend the range of experimental parameters ( $R^3 V \rho _{{w}}$) covered by Glasheen & McMahon (Reference Glasheen and McMahon1996) to a much larger range of disc momenta at impact.
We compute  $\mathcal {F}_{{impact}}$ and $\varPi _{{impact}}$ by considering the signal up to the end of the first peak (as shown in the inset of figure 8). Here, $\varPi _{{impact}}$ values are multiplied by the disc area to make the two measures of impact impulses comparable. The comparison is shown in figure 9. Note that the range of data for $\mathcal {F}_{{impact}}$ is greater than that for ${\rm \pi} R^2 \varPi _{{impact}}$. This is due to the forces being measured with disc sizes up to $R = 8$ cm, while the pressures were measured with fixed disc size of $R=4$ cm. It is seen in figure 9 that force impulses from our measurements lie very close to the theoretical prediction. We find good agreement between our data and the $4/3$ slope for small impact momentum ( $\rho _w R^3 V$). However, at larger momenta, discrepancies set in, which cannot be solely attributed to limited temporal resolution of the sensors. We also do not anticipate any effects from finite depth of the bath to have played in our measurements. Experiments by Ermanyuk & Gavrilov (Reference Ermanyuk and Gavrilov2011) showed the effects of finite bath approaching the asymptotic value of added mass coefficient (equalling 4/3, also see Chebakov Reference Chebakov1974) for a bath of depth $0.8 R$. Bath depths in the present work ranged between $3.75R-30 R$.

Figure 9. Impulses accumulated during the first impact peak (see inset of figure 8) are plotted against growth rate of the added mass of liquid at impact. Impulses calculated from pressure measurements ( $\varPi _{{impact}}$) at the disc centre (shown in figure 6) were multiplied by the disc area so that they can be plotted directly on the same scale as $\mathcal {F}_{{impact}}$. Dashed line shows the theoretical calculation for the impulse transferred from an impulsively accelerated disc to an infinite half-space filled with inviscid fluid. Dotted line is the result from Peters et al. (Reference Peters, van der Meer and Gordillo2013) (4.8). The results in (b) are the collapsed version of the same in (a).
It is possible to at least approximately compute the influence of the entrapped air layer on  $\mathcal {F}_{{impact}}$, as was done by Peters et al. (Reference Peters, van der Meer and Gordillo2013), who calculated the total force on a disc with the cushioning air layer. They estimated the change in momentum of a disc slamming at constant velocity as
 \begin{equation} \mathcal{F}_{{impact}} = 0.315 \rho_{w} {\rm \pi}R^3 V, \end{equation}
i.e. a reduction of the classical force impulse by approximately 25 %. This result is also compared with our measurements in figure 9. It lies closer to the area-integrated pressure impulses measured at the disc centre, but is consistently below the directly obtained force-impulse data from the load cell.
5. Conclusions
We report here experiments where a flat disc is impacting at a controlled, constant velocity on a deep water bath initially at rest. We measure local pressures at the centre and near to the edge of the disc, and the total impact force. At the moment of impact, the disc entraps a thin air layer on the impacting side due to the air cushioning that occurs prior to first touchdown. The air layer causes a difference in impact pressures at the disc's centre and edge. The first pressure peak is registered at the disc edge, where the disc makes first contact with the liquid. While the air layer prolongs the build-up of the pressure peak, we also find that the time duration between the occurrence of the pressure peaks at the two sensors is always of the order of 100  ${\rm \mu}$s regardless of how the air film behaves. The trapped air film retracts or collapses over longer time scales ( ${\sim }{O}10^{-1}$ and $10^{-3}\,\text {s}$ respectively), which implies that the film's time evolution is much slower than the buildup of the load. The pressure peak at the centre has already occurred before the shape of entrapped air film has changed significantly.
Pressure impulses  $\varPi (t)$ are computed by numerically integrating pressure measurements starting from a time before they start to rise. The pressure impulses $\varPi (t)$ accumulated at the disc centre are found to be higher than those at the disc edge. Further, the early, air-mediated growth stage of the central pressure impulse is shown to be governed by inertial length and time scales, which may be connected to the very fast pressurisation of the air layer, after which the dynamics is expected to be dominated by what happens in the liquid.
By multiplying with the disc area, the peak pressures are compared with peak forces on the disc. The peak forces are found not to follow a  $V^2$ scaling, which is only indicative of insufficient resolution of the force sensor. The impulses, being a more practical measure of the intensity of loading, are used to isolate the role of the air layer in cushioning of the impact loading. The role of added mass in producing the large initial impact force peak is verified by determining the force impulse $\mathcal {F}(t)$ at impact. As seen with $\varPi (t)$, the growth of $\mathcal {F}(t)$ in the early stages of loading is also well collapsed by a re-scaling with inertial length and time scales. Our analysis, in line with findings from Bagnold (Reference Bagnold1939), Hattori et al. (Reference Hattori, Arami and Yui1994) and Partenscky (Reference Partenscky1989), shows that impulses are a much more reliable and reproducible indicator of the intensity of an impact event. This is especially the case when sensors are suspected to underestimate the peak pressures (or forces) due to their limited time resolution.
The impulses accumulated during the first peak,  $\varPi _{{impact}}$ and $\mathcal {F}_{{impact}}$, are compared with the theoretical hydrodynamic mass of the fluid that is accelerated by the impact. A better agreement is found between force impulses and the theory than by Glasheen & McMahon (Reference Glasheen and McMahon1996), and over a much larger range of parameters. The values of $\varPi _{{impact}}$ at disc centre are found to be consistently lower than both $\mathcal {F}_{{impact}}$ and the theoretical prediction. At larger disc momenta, the data increasingly deviate from the $4/3$ slope, and follow a trend closer to the $\mathcal {F}$ calculation by Peters et al. (Reference Peters, van der Meer and Gordillo2013), which was done while accounting for the air-cushioning effect.
Supplementary movie
Supplementary movie is available at https://doi.org/10.1017/jfm.2021.846.
Acknowledgements
We thank J.M. Gordillo for useful discussions.
Funding
We acknowledge financial support from SLING (project number P14-10.1), which is partly financed by the Netherlands Organisation for Scientific Research (NWO). P.V.-M. acknowledges the support of the Spanish Ministry of Economy and Competitiveness through grants DPI2017-88201-C3-3-R and DPI2018-102829-REDT, partly funded with European funds.
Declaration of interests
The authors report no conflict of interest.
Appendix A. Time evolution of the entrapped air layer
The fate of the trapped air layer is determined by a balance of the stagnation pressure that occurs as the water flows along the air–water interface, surface tension which tries to minimise its surface area and its natural oscillations. At low impact velocities, surface tension overcomes inertia and the air bubble retracts. At high impact velocities, when the inertial time scales are much shorter than those relevant for the retraction (see figure 2), the air bubble is rapidly punctured, fragmented and expelled. Imperfections present in the experiment, such as slight tilt of the disc, or its surface roughness, also play an increasingly interfering role in triggering a rupture of the air film. As such, it becomes difficult to define a clear criterion to separate the two ‘retracting’ and ‘fragmenting’ behaviours. Nevertheless, it is found for several parameters that the two co-exist, showing that the two are not in fact mutually exclusive ‘regimes’ (see for example, movies 5 and 6 showing water entry of 5 and 9 cm wide discs at 0.5 and 0.3 m s $^{-1}$ respectively).
Some quantitative discussion on the behaviour of the entrapped air layer is presented in this Appendix.
A.1. Retraction of the air film at low impact velocities
The inwards retraction of the air film at low impact velocities is due to the surface tension of the air–water interface. We measured the time evolution of the bubble diameter for different disc diameters and impact velocities and present them in figure 10. The retraction velocity  $V_{retr} \approx 0.38\text {--}0.42$ m s $^{-1}$ appears to be near constant, suggesting a Taylor–Culick-type retraction. Similar observations were made by Mayer & Krechetnikov (Reference Mayer and Krechetnikov2018) while using a rectangular plate.

Figure 10. Time evolution of the diameter  $D_{air}$ of the retracting air film at low impact velocities for different disc diameters $D$ and impact velocities $V$. Note that the retraction velocity $V_{retr} \approx 0.38\text {--}0.42$ m s $^{-1}$ appears to be independent of $D$ and $V$.
$V$.
It is good to note that the time scale of retraction  ${\sim }{O}(10^{-1}\,\text {s})$ is significantly larger than that over which the load on the disc builds up and the peak pressures at the disc edge and centre are separated in time ${\sim }{O}(10^{-4}\,\text {s})$ (inset, figure 4b).
In addition, we observe that the retracting bubble's perimeter emits surface waves that converge to its centre and produce the largest oscillations. An example is shown in movie 7 (12 cm disc entering water at 0.4 m s $^{-1}$). Waves with a large range of wavelengths are initially excited. Those with the smallest wavelengths travel the fastest. Such a bubble's natural frequency, despite being attached and flattened against a plate, is essentially the same as the Minnaert frequency (Blue Reference Blue1967). For $R=6$ the resonance frequency is approximately 54 Hz, with the corresponding oscillation period of approximately 18.5 ms. It can be seen in movie 7 that, by 18.5 ms after the initial touchdown, several oscillation cycles at the centre have already occurred, thereby showing that the bubble's natural oscillations affect neither its retraction nor its puncturing.
A.2. Puncturing of the air film at high impact velocities
The time intervals  $\Delta t_{punct}$ between the first contact time of the disc and the water surface and the appearance of the puncture in the centre of the air film are measured as a function of the impact velocity $V$ for three different disc diameters and presented in figure 11. A smaller disc entraps a thinner air layer (Jain Reference Jain2020; Jain et al. Reference Jain, Gauthier, Lohse and van der Meer2021a), with the consequence that the air layer with the smaller discs is more susceptible to being affected by experimental imperfections such as disc surface roughness or its edges. The time interval $\Delta t_{punct}$ is reasonably well fitted with the functional form ${\sim }1/V^2$, with the exception of the smallest disc, where we expect the air layer to be most sensitive to perturbations from experimental imperfections – leading it to earlier rupture, or at locations off the centre. It is good to note that the time interval $\Delta t_{punct}$ is of the order of a millisecond, and decreases with the disc diameter $D$.
$D$.

Figure 11. Time interval  $\Delta t_{punct}$ between the first contact time of the disc and the water surface and the appearance of the puncture in the centre of the air film, as a function of the impact velocity $V$ for three different disc diameters. The dashed lines are best fits to the functional form $\Delta t_{punct} = A/V^2$, with $A$ constant.
Some examples of the process are also shown in movies 4–6. Movies 5 and 6 were particularly chosen to show that puncturing may also occur for a retracting air film as evidence that both may occur simultaneously and therefore do not constitute separated regimes. The two videos using  $D=5$ and 9 cm, with $V= 0.5$ and 0.3 m s $^{-1}$, show how an initially retracting air film, such as described in Appendix A.1, can still eventually rupture close to the centre at a later stage in time.
A.3. Pressurisation of the entrapped air pocket
The last topic we want to discuss is the pressurisation of the air pocket. As soon as the air pocket is entrapped, the disc further moves down into the liquid and air pocket will be compressed. The entrapped air can only begin to displace the surrounding liquid once it has reached a value comparable to the stagnation pressure. To estimate the amount of time needed for this to happen, we assume adiabatic compression such that pressure  $p$ and volume $v$ of the entrapped air pocket are related by
 \begin{equation} p v^\gamma = p_0 v_0^\gamma, \end{equation}
where  $p_0$, $v_0$ and $\gamma$ are the ambient air pressure, initial volume of the entrapped air pocket and adiabatic index of air, respectively. For a disc of surface area $S = {\rm \pi}R^2$, we know from Jain et al. (Reference Jain, Gauthier, Lohse and van der Meer2021a) that an air film of thickness $h_0 \approx \kappa R$ is entrapped at impact, where $\kappa \approx 7 \times 10^{-3}$. The initial volume of this air pocket can therefore be estimated as $v_0 \approx S h_0$. On compression in the vertical direction, the decrease in volume $S \Delta h$ relates to an increase in pressure $\Delta p$. For a disc plunging at constant velocity $V$,
$V$,  $\Delta h = V \Delta t$. The adiabatic compression law thus reads
 \begin{equation} (p_0 + \Delta p) S^\gamma (h_0 - V \Delta t)^{\gamma} = p_0 S^\gamma h_0^ \gamma, \end{equation}
from which we can compute the time  $\Delta t_c$ it takes to pressurise the air pocket to a pressure $\Delta p$ above $p_0$
$p_0$
 \begin{equation} \Delta \tau_c \equiv \frac{V \Delta t_c}{R} = \kappa \left[1 -\left(1 + \frac{\Delta p}{p_0} \right)^{{-}1/\gamma} \right], \end{equation}
where  $\Delta \tau _c$ is the non-dimensionalised pressurisation time. The time taken for the pressure in the air pocket to rise to the stagnation pressure $\Delta p = \rho V^2$ can now be estimated using $\gamma = 1.4$ for air, $\rho =10^3$ kg m $^{-3}$ and $p_0 = 10^5$ Pa.
In table 1, we calculate the pressurisation time for  $R = 1\text {--}8$ cm and $V = 0.5\text {--}3$ m s $^{-1}$ which correspond to our slamming impact experiments. From this table, we conclude that it takes in the range of $0.3\text {--}10\,{\rm \mu}$s to pressurise the air pocket to stagnation pressure, after which the pressurised air pocket can begin to displace the surrounding liquid. Clearly, this corresponds to time scales which are very short compared with the build-up time of the load.
Table 1. Estimates of the compression time  $\Delta t_c$ for $R= 1$ and $8$ cm, with $V = 0.5\text {--}3$ m s $^{-1}$.


 Open access