


Introduction
Obesity is a global pandemic that negatively affects multiple aspects of individuals’ well-being, and is a known risk factor for diabetes and other diseases. According to the National Center for Health Statistics, 42.5% of the US population aged 20 and older were classified as obese in 2018 [Reference Powell-Wiley, Poirier and Burke1,Reference Fryar, Carroll and Afful2]. A few studies in different countries have documented an increase in body mass index (BMI) after the lockdown caused by the COVID-19 pandemic [Reference Pellegrini, Ponzo and Rosato3,Reference Bakaloudi, Barazzoni, Bischoff, Breda, Wickramasinghe and Chourdakis4] including in the USA, where 42% of adults surveyed reported an undesired increase in weight [5]. Multiple studies found that the pandemic has led to behavioral changes that increased the tendency of individuals to gain weight, including changes in nutritional choices, financial burdens, psychological alterations, and physical activity patterns [Reference Ashby6,Reference Almandoz, Xie and Schellinger7]. Additionally, food companies have initiated innovative marketing techniques since the start of the pandemic, which added to increased unhealthy food and alcohol consumption [Reference Khan and Moverley Smith8].
Obesity has a strong negative effect on diabetes mellitus (DM) prognosis. Obesity is the most prominent risk factor for insulin resistance in the USA, which is the main reason for Type 2 DM [Reference Lee, Okumura, Davis, Herman and Gurney9]. More than 90% of diabetic patients are classified as having Type 2 DM. Though obesity is less of a risk factor for Type 1 diabetes, it plays an important role in the management of Type 1 DM as well. About 11% of the US population suffers from Type 1 or Type 2 diabetes [10], and over 75% of DM patients are obese [Reference Bays, Chapman and Grandy11].
There is evidence that obesity reduces the glycemic control of diabetic patients in addition to increasing the severity of comorbidities [Reference Scheen12]. A common way of evaluating diabetes disease is measuring the concentration of Hemoglobin A1c (HbA1c), which depends on both the concentration of glucose in the blood and the life span of red blood cells. Since the average lifespan of red blood cells is about 120 days, HbA1c reflects the integrated glucose concentration over 8–12 weeks prior to the test. This offers the advantage of eliminating day-to-day fluctuations that occur in blood glucose concentrations [Reference Goldstein, Little and Lorenz13]. In addition, HbA1c blood samples can be taken at any time of the day without patient preparations [Reference Weykamp14]. The HbA1c concentration is frequently used to monitor the glycemic status in both Type 1 and Type 2 diabetes patients over time. This measurement helps to indicate the degree of glycemic control, response to treatment, and the risk of development of diabetes-related complications. A higher level of HbA1c is strongly suggestive of poorly controlled diabetes [15,16]. An HbA1c level of at least 6.5% would be diagnostic of diabetes if confirmed by an elevated blood glucose level [Reference Saudek, Herman and Sacks17].
Uncontrolled glucose levels were found to affect the morbidity and mortality of diabetic patients infected with COVID-19. Diabetic patients infected with COVID-19 are twice more likely to develop severe COVID-19 disease with twice the risk of mortality. Therefore, a large portion of diabetics presents with COVID-19 infection present to the ER with severe respiratory symptoms and are admitted to the hospital [Reference Kumar, Arora and Sharma18]. A study by Ghosal et al. demonstrated that poor glycemic control increased the risk of mortality in diabetic patients with COVID-19. The authors also found that the duration of lockdown was directly proportional to the deterioration of glycemic control and diabetes-related complications [Reference Ghosal, Sinha, Majumder and Misra19].
About 30% of the patient population of the VCU Health System are African American. African Americans are documented to experience more detrimental effects related to diabetes. The National Center for Health Statistics reports that 24.9% of African American diabetic patients have poor glycemic control, compared to only 8.8% of non-Hispanic White diabetic patients. African Americans are 2.1 times more likely to die from diabetes [Reference Kochanek, Murphy, Xu and Arias20] and 1.7 times more likely to be hospitalized as a result of diabetes compared to non-Hispanic Whites [21]. This difference in complication rates can be attributed to many factors, such as the disproportionate socioeconomic status of African Americans, compared to non-Hispanic Whites. Additionally, blood glucose monitoring rates are significantly lower for African Americans than those for non-Hispanic Whites [Reference Levine, Allison, Cherrington, Richman, Scarinci and Houston22], further increasing the risk of uncontrolled diabetes. Minority populations such as African Americans constitute 20% of the rural population, where there is limited access to primary healthcare and lower screening rates of chronic diseases [Reference Johnson23]. Death rates of diabetes in African Americans are higher in rural areas of the USA than in urban areas as well as those in the rural White population [Reference Probst, Moore, Glover and Samuels24–Reference Slifkin, Goldsmith and Ricketts26].
The aims of this research project were to: (a) evaluate and compare BMI levels before the COVID-19 pandemic (2018–2019) and during the COVID-19 pandemic (2020) of all adult patients seen at VCU Health System, as well as (b) investigate the changes in the severity of diabetes cases treated at the VCU Health System by comparing HbA1c laboratory results and the number of diabetes-related emergency department (ED) visits before and during the pandemic. Considering the large portion of minority patients among VCU Health System’s population, it was important to stratify analysis by subpopulations. It was hypothesized that BMI levels would increase during the COVID-19 pandemic compared to previous years due to disruption of lifestyle in Virginia. Additionally, it was hypothesized that the severity of diabetes cases would increase as measured by higher HbA1c values and a larger number of diabetes-related ED visits.
Methods
Data Source
The study used de-identified retrospective data from electronic health records (EHRs) at the VCU Health System, which included encounters between January 2018 and December 2020. The data were provided by the Biomedical Informatics Core at the VCU Wright Center for Clinical and Translational Research. Since the requested data was completely de-identified, this project was not considered human subject research, and therefore did not require review from the VCU Institutional Review Board. There were two datasets created. The first dataset included aggregated monthly mean BMI measurements for all adult patients who visited any VCU Health System locations in the study period. BMI is a calculated variable in VCU Health System’s EHR system without any validation, which sometimes results in errors, producing unreasonable outlier values for BMI. To reduce these errors, we removed BMI values from the dataset that were less than 10 (BMI value for an average height 70 pound man), or more than 70 (BMI value for an average height 500 pound man). If a patient had multiple visits in a month with BMI measurements, the mean of the BMI values was calculated for the patient for that month. The dataset included gender, age (18–19, 20–39, 40–59, >60), race, and ethnicity of the patients. We categorized patients as overweight if their monthly mean BMI index was larger than 25. This dataset was referred to as the BMI cohort in the study. The second dataset included aggregated monthly mean HbA1c measurements for all adult patients who had Type 1 or Type 2 diabetes diagnoses and visited any VCU Health System locations in the study period. HbA1c lab values are clinically validated in the EHR system, therefore we did not remove any of these values due to being outliers. If a patient had multiple visits in a month with HbA1c measurements, the mean of the HbA1c values was calculated for the patient for that month. Only visits with HbA1c measurements were included in this cohort. The dataset also included the number of ED visits for the month, as well as gender, age (18–19, 20–39, 40–59, >60), race, and ethnicity of the patients. We categorized patients as being in a poor glycemic state if their monthly mean HbA1c lab value was larger than 6.4. This dataset is referred to as the Diabetes cohort in the study. We excluded the demographic variable ethnicity from reporting as each cohort had less than 2% Hispanic population and the results for those Hispanic patients were not significantly different from non-Hispanics.
Data Analysis
All data for the BMI and diabetes cohorts were summarized using proportions for categorical variables, as well as mean and standard deviation for numeric variables. For each outcome (BMI, HbA1c and number of ED visits), we stratified the results by gender, age, race, and ethnicity to identify trends in subpopulations. Since there was repetition in observations per patient, we chose to conduct a mixed model analysis using the patient as the random effect and only a random intercept. For each of the three outcomes, we constructed four models. First, we constructed a simple linear model to assess temporal association with the outcome. Our second model was a mixed model, with a patient random effect and year as a continuous fixed effect to assess whether the temporal association with the outcome was clustered among individuals. Similarly to model 2, our third mixed model used year as a categorical-fixed effect to assess changes in trends for year 2020, the COVID-19 inflection point. Our last model included an interaction between year and race to assess the temporal association in subpopulations. The original race variable was consolidated to African American, White, and Other; where Asian, American Indian, and multi-racial were grouped with Other since they were a small percentage of each cohort. When year was modeled as categorical measure (as done in models 3 and 4), we looked at pair-wise differences for all factors in the mixed model, computed p-values and confidence intervals based on the t-distribution using degrees of freedom based on a Satterthwaite approximation. The reference values for the categorical variables were the year 2020 and Other race. The contrasts in means were plotted, highlighting groups that had a significant difference in means between each year. For the BMI and HbA1c outcomes, we used a standard mixed model since the outcome is continuous and normally distributed. The Number of ER Visits followed a Poisson process, so we used a generalized mixed model for this outcome. To improve model convergence, the race variable was limited to just African Americans in the generalized mixed model. From the regular mixed models, we report the fixed and random effects with a 95% confidence interval from the profile likelihood. From the generalized mixed models, we report the fixed effect, random intercept, and p-values for significance. We also report the intraclass correlation to assess how similar values are within clusters. All analysis was done in R 4.0 using the lme4 package for mixed models.
Dichotomous outcomes for overweight and poor glycemic state were added to our analysis. The outcomes followed the overweight threshold (BMI ≥ 25) and high HbA1c threshold (HbA1c ≥ 6.4). Additionally, a generalized estimating equation model was used to determine the clustered association of these outcomes, and the change in rate during the year of the COVID-19 pandemic, 2020. In this model, we included a knot for the year 2020, to determine if a change took place in this year compared to years prior. For our GEE analysis, we used the R package Geepack.
Results
Table 1 contains summary statistics for the BMI cohort, while Table 2 shows summary statistics for the diabetes cohort.
Table 1. Body Mass Index (BMI) cohort summary table
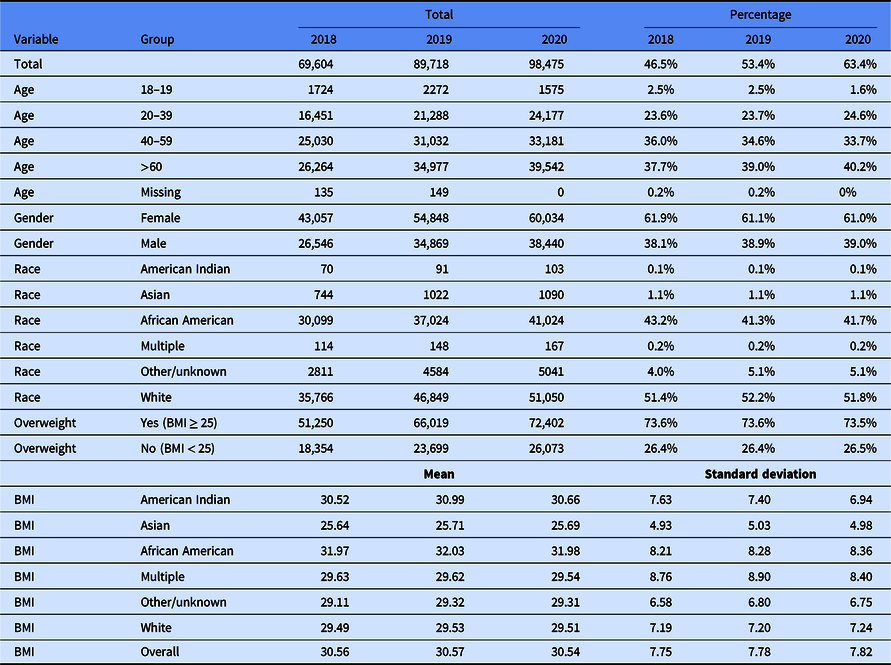
Table 2. Diabetes cohort summary table
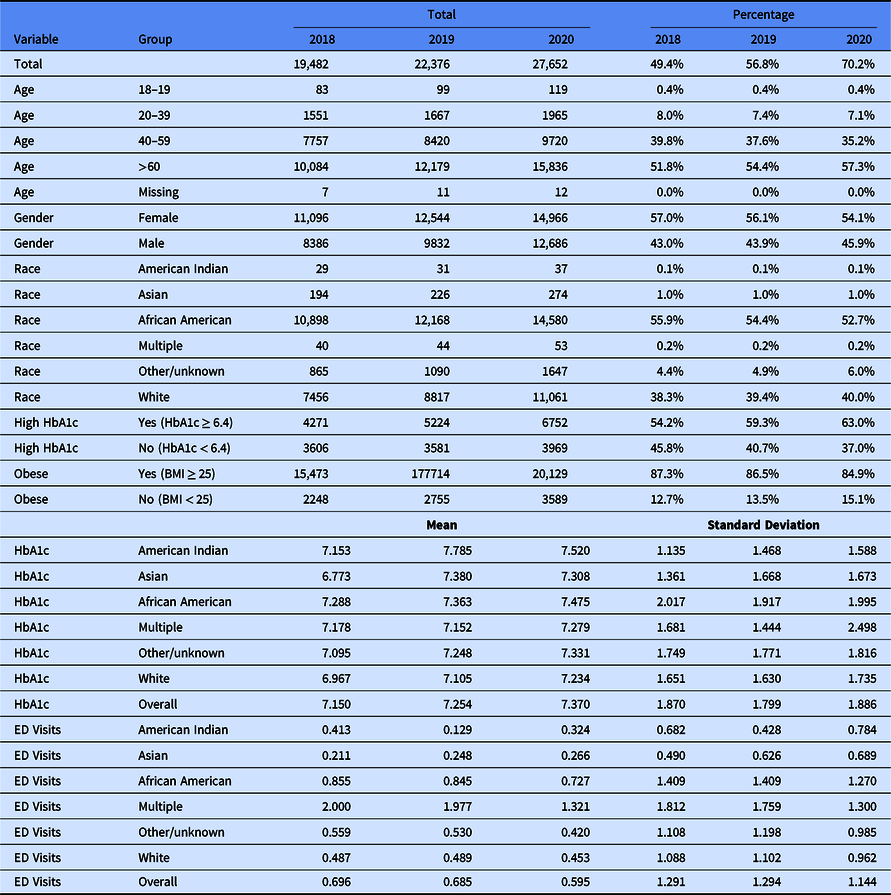
Hemoglobin A1c (HbA1c); Emergency Department (ED).
BMI Analysis
This analysis used the BMI cohort to assess trends in BMI change for the whole adult population of VCU Health System. The summary tables from the models are described in Table 3. From the simple linear model 1, there is no sign of association between time in years and BMI since the 95% CI contains 0 [−0.013 slope (−0.034, 0.009)]. However, after including a random effect for the patient (model 2), the BMI increases over time 0.0083 (95% CI 0.002, 0.0143). For model 3, considering year as a category, we see that only the year 2018 has a nonzero slope [−0.017 (95% CI: −0.029, −0.006)] compared to the reference of the year 2020 (the time of the pandemic). There is no significant change in BMI comparing 2019–2020 [0.0003 (95% CI: −0.010, 0.011)]. There is no substantial change in BMI from before COVID to during COVID.
Table 3. Body Mass Index (BMI) models using the BMI cohort

Not Applicable (NA); Year (Yr); African American (AA); Standard Deviation (SD); Intraclass Correlation Coefficient (ICC).
When looking at race subpopulations in model 4, we notice that changes in BMI stratified by race are nonzero, meaning that change over time is statistically significant compared to the inflection point of the year 2020. Looking at the African American population, the pairwise contrast for African Americans in 2020 compared to 2019 [0.027, (95% CI: 0.011, 0.044)] and for 2020 compared to 2018 [0.049 (95% CI: 0.031, 0.067)] shows that the rate of BMI is increasing, albeit negligibly. This is different from what was shown in the summary statistics of the overall means, where the BMI in 2020 is less than in 2019. However, we do notice a larger variance in BMI measures in 2020, which could influence the result of the mixed models. The African American population has a higher BMI than other races. The comparison within the same race over time shows an increase in BMI albeit trivial before COVID to during COVID. The intraclass correlation coefficient (ICC) from the mixed models is all greater than 0.9, suggesting that the BMI within each patient cluster is similar over time. In other words, while there may be statistically significant changes in BMI over time within a cluster, these changes are trivial. BMI largely stays the same over time.
HbA1c Analysis
This analysis used the diabetes cohort to assess trends in glycemic state change for the diabetic adult population of VCU Health System. The result tables from the models are described in Table 4. HbA1c is positively correlated with time both in the simple linear model and the mixed model. When accounting for the random effect (model 2), the mean HbA1c increased by 0.103 (95% CI: 0.086, 0.119), which reflected what was seen in the data summary table (Table 2); an increase from 2018 to 2019 and another increase in 2020. When considering year as a factor (model 3), both 2018 [−0.206 (95% CI: −0.240, −0.173)] and 2019 [−0.075 (95% CI: −0.102, −0.039)] have nonzero slope, indicating that 2020 has a higher HbA1c than these years. Figure 1 shows the pairwise contrasts in years for HbA1c, indicating the same conclusion that 2020 has a higher mean HbA1c when controlling for random error in the patient. When stratifying by race, we see that this contrast for 2020 to other years for African Americans also indicates an increase in HbA1c: with 2018 [0.186 (95% CI: 0.140, 0.231)] and with 2019 [0.092 (95% CI: 0.048, 0.135)]. The ICC for the mixed models was all 0.668 meaning there was less within-cluster consistency in HbA1c measure per patient than there was with BMI. It is possible that after a high HbA1c measure at one visit, the patient was encouraged to lower their blood sugar to regulate their diabetes before a second visit, resulting in more fluctuation within a subject. Similarly to BMI, the change in HbA1c over time is largely trivial before and during the pandemic.

Fig. 1. Hemoglobin A1c/year contrast. Hemoglobin A1c (HGA1C); Admission (ADM).
Table 4. HbA1c models using the diabetes cohort

Not Applicable (NA); Year (Yr); African American (AA); Standard Deviation (SD); Intraclass Correlation Coefficient (ICC).
Number of ED Visits Analysis
This analysis used the diabetes cohort to assess trends in number of Emergency Department visits for the diabetic adult population of VCU Health System. The results for the number of ED visits models are described in Table 5. The number ED visits is negatively associated over time [−0.081 (p-value <0.05)] in the simple generalized linear model, which reflects the summary table (Table 2), a decreasing trend can be seen in ED visits over time from 2018 to 2020. In model 2, adding the random patient effect, the negative trend persists [−0.067 (p-value <0.05)] as the number of ED visits decreases from 2018 to 2020. As for model 3, with year as a categorical variable, both 2018 [0.13, p-value <0.05] and 2019 [0.133, p-value <0.05] show that the number of ED visits is greater before COVID than during the year 2020 during the COVID-19 pandemic. Using model 4, we looked at pairwise differences between year and race, and again see a decreasing trend in ED visits from 2018 to 2020 [2020 AA estimate – 2018 AA estimate: −0.140, p-value <0.05] and from 2019 to 2020 [2020 AA estimate – 2019 AA estimate: −0.143, p-value <0.05]. This reaffirms that the number of ED visits decreases as well in the African American population.
Table 5. Emergency department visit count models using the diabetes cohort

Not Applicable (NA); Year (Yr); African American (AA); Standard Deviation (SD); Intraclass Correlation Coefficient (ICC).
Generalized Estimating Equation (GEE) Analysis
Our additional models dichotomized the BMI and HbA1c variables to distinguish overweight patients using a threshold of BMI ≥ 25 and patients with poor glycemic state using a threshold of HbA1c ≥ 6.4. The output for both the high HbA1c and overweight GEE models can be seen in Table 6. Key to our assessment is the interaction between a knot of the year 2020 (the year of the pandemic) and an indicator for race, particularly African American. For the overweight model, there is no significant change in the risk of being overweight for African Americans in the pandemic year compared to prior years [−0.011, p-value 0.830]. Further, in the overweight GEE model, there is no temporal association with risk of being overweight and no change in risk for the year of the pandemic across all races. This reinforces what was seen in the generalized model, if there was a change in BMI, it was negligible and did not shift persons from a non-overweight category to an overweight category. Also within each person, BMI has very little change over time. For the high HbA1c model, there is no significant change in rate of high HbA1c compared before and during the pandemic for the African American population [0.219, p-value 0.166]. Despite a significant trend in temporal risk of high HbA1c from 2018 to 2020, the risk of high HbA1c decreases during the pandemic year in the GEE model when not stratifying for race. This result on its face conflicts with that of the generalized linear model, however our modeling of the continuous measure showed a small decimal change over time which may mean that overall, this does not shift categorizations of high HbA1c by much. Likely a person with high HbA1c will always have high HbA1c, same with those with low HbA1c.
Table 6. Generalized Estimating Equation models for HbA1c (diabetes cohort) and BMI (BMI cohort)

Hemoglobin A1c (HbA1c); Body Mass Index (BMI); Year (Yr); African American (AA).
Discussion
The respiratory disease, coronavirus 2019 (COVID-19), has had an enormous effect on global health. An overlooked outcome, however, is its indirect effects on obesity, and how that has impacted diabetes. The prevalence of obesity continues to rise worldwide, and it is often described as being an epidemic. In the USA, the African American population is especially affected by the obesity epidemic.
Our study analyzed BMI data of the general adult population between January 2018 and December 2020 at the VCU Health System, an academic safety-net healthcare institution serving a large underserved African American population. We also analyzed HbA1c lab results and the number of Emergency Department visits of diabetic patients in the same population and timeframe. We hypothesized that the disruption in everyday life caused by the COVID-19 pandemic might have caused an increased obesity rate, as well as less effective management of diabetes disease manifesting in higher HbA1c values and more frequent ED visits. Our study had mixed results, while some of the models showed significant differences between the pre-pandemic and pandemic timeframes, the measured difference was negligible. It is difficult to assess what parts of the changes shown by our analysis were caused by a long-term trend that would have occurred without the COVID-19 pandemic, and what parts of the changes were caused by the pandemic.
Our analysis reaffirms that the pandemic has affected the African American population more severely than the White population.
Our most significant finding is that the number of ED visits significantly decreased from 2018 and 2019 to 2020, which can be easily explained by restrictions that were put in place at medical facilities and by the fear of infection at these facilities. These factors likely prevented necessary care seeking and caused harm and death.
The limitations of our research include the short time period investigated. Looking back at a longer period of time before the pandemic, and also having access to more data since the beginning of the pandemic would make it easier to separate the effects of the pandemic from other general trends. Having only one health system’s data included in the analysis is also a limitation. Results might be more generalizable if a similar analysis would be performed on larger consolidated datasets, such as the National Covid Cohort Collaborative (N3C) [Reference Haendel, Chute and Bennett27].
Future research in this field may include analyzing data from multiple health systems, using a longer time period, and adding more comorbidities in the analysis. Exploring patient behavior related to stress, diet, exercise, and other lifestyle factors is also necessary.
Acknowledgments
This project was supported by the Wright Center for Clinical and Translational Research Biomedical Informatics Core and the Biostatistics Consulting Laboratory, which are partially supported by Award No. UL1TR002649 from the National Institutes of Health’s National Center for Advancing Translational Science.
Disclosures
The authors have no conflicts of interest to disclose.


 Open access