


INTRODUCTION
Books have long been recognized as a source of input for children learning language in cultures with widespread literacy. Investigations into the relationship between books and language development have typically been of two types. One is research showing a relationship between frequency of children's book experiences and broad measures of language development such as literacy or preliteracy skills (see Bus, van IJzendoorn & Pellegrini, Reference Bus, van IJzendoorn and Pellegrini1995, for a review) or vocabulary size (e.g. Lyytinen, Laasko & Poikkeus, Reference Lyytinen, Laasko and Poikkeus1998; Raikes et al., Reference Raikes, Pan, Luze, Tamis-LeMonda, Brooks-Gunn, Constantine, Tarullo, Raikes and Rodriguez2006; see Fletcher & Reese, Reference Fletcher and Reese2005, for a review). Second are studies examining the occurrence of specific linguistic elements in children's books, trying to link them directly to knowledge; for instance, there are recent studies showing that children's books contain more complex sentence structures than naturalistic spoken input (Cameron-Faulkner & Noble, Reference Cameron-Faulkner and Noble2013), and that there exists a correlation between text exposure and the production of more complex syntactic structures (Montag & MacDonald, Reference Montag and MacDonald2015).
This latter kind of investigation ultimately relies on knowing the actual books children are being read. However, examinations of children's books have not typically been done with access to this information. Instead, proxies for this information have been used in selecting the books for examination. Cameron-Faulkner and Noble (Reference Cameron-Faulkner and Noble2013), for instance, used sales information to select books for examination, while Montag and MacDonald (Reference Montag and MacDonald2015) analyzed corpus data (specifically, the Corpus of Contemporary American English, Davies, Reference Davies2008–). Although this way of selecting text for analysis can tell us a great deal about the overall nature of the language that is generally contained in children's books, it is difficult to make any more specific claims, given that the books that children have are not necessarily the books that they are read. One must also take into account the fact that children's books, even ones targeted to the same age range, can differ in the amount and nature of text they contain, sometimes in ways which are predictable due to genre. For instance, storybooks contain complete sentences, whereas word books are often pictures accompanied by single words labelling the pictures, and storybooks expose children to culturally normative narrative structures whereas information books may not. Moreover, genre differences carry with them interactional implications that can further affect input (Nyhout & O'Neill, Reference Nyhout and O'Neill2013; cf. Leech & Rowe, Reference Leech and Rowe2014). For instance, there is evidence that there is more variability in what parents say when reading vocabulary-focused books as compared to storybooks (Price, Van Kleeck & Huberty, Reference Price, Van Kleeck and Huberty2009). Thus, having a more accurate picture of the books children are being read would be useful for researchers interested in the potential role of bookreading activities in language development.
To this end we conducted an Internet survey of parents and caregivers, asking about the English-language books they frequently read to their children. Because of the linguistic features we are ultimately interested in examining in books (the ultimate reason we wanted this information), the survey targeted people reading to children aged 0–36 months, an age group we know relatively little about in terms of bookreading (Fletcher & Reese, Reference Fletcher and Reese2005). This short notice is a description of the resulting dataset, which is available to researchers in multiple formats at the following web-address: <http://linguistics.ubc.ca/ubc-ibdb/>, or by request from the first author. It is hosted by the Department of Linguistics at the University of British Columbia and there is a commitment to retain the link permanently. We ask that people cite this report when using the database.
DESCRIPTION OF THE DATABASE
Data collection
The survey was conducted beginning in January of 2014 through to June of 2015. The invitation to participate was posted on a lab website, which described the study briefly and contained a link to the actual survey at FluidSurveys.com. (FluidSurveys is a Canadian company, and all their data are hosted at a site in Canada, in accordance with the requirements of our IRB.) The study was described as being about children's books in English for parents and caregivers of children ages 0–36 months. It did not specifically mention picture books. The link to the lab webpage was circulated via the lab's Twitter account, and from there it was recirculated via Twitter and Facebook by other Twitter and Facebook users. Although many of the initial recirculaters were friends and family, the invitation was also recirculated by people we did not know, including more generic Twitter accounts (i.e. accounts not associated with a specific person's name).
Overview of survey questions
The survey first asked participants to list the five books they currently most frequently read to their child. There was another place where the respondent could list any other books they frequently read to their child. Then the information about the five most frequently read books was used to populate further questions asking about their reading habits for each book. Specifically, participants were asked how much they stick to the text on the page versus say things not written in the book. They provided this additional information (about reading habits) for each of the five most frequently read books individually. They did not provide this additional information for any extra books they listed.
Participants were also asked questions about the child's age (in 2-month increments), sex, gestational status (full-term or not), and about the occurrence of any hearing, language, or cognitive diagnoses. (We use the term sex here as a child's primary sexual characteristics are more apparent than their gender at this age.) We also asked about the child's language production (which might be expected to influence book choices) to get a very general sense of the child's level of language development. Specifically we asked whether the child was (i) producing any words, (ii) producing more than ten understandable words, (iii) producing any two-word sequences, and (iv) producing any sequences of more than three words. The four language production questions were in a Y/N format.
We also asked questions about the respondent: their gender, age, and level of education. The specific wording of each question appears in Appendix A.
Responses
The database that is posted on-line contains 1,107 responses. 1,058 of these are fully complete (meaning they answered the questions about the child and the respondent, and entered at least one English book title). Thirty-four responses were missing some or all of the information about the respondent, but had complete information on the child. Four were missing some information about both the child and the respondent. All in all, there are 1,091 responses with complete information about the child and at least one book.
We did not restrict the questionnaire to respondents who were in any specific geographic location, but it was clear that we were interested in books in English. IP information (not included in the database) indicates that most of the responses came from North America, although there were numerous responses from people in other countries as well, mostly predominantly English-speaking countries (e.g. Australia, New Zealand), but not entirely. Some respondents included non-English book titles in their five most frequently read books. Those titles are not included in the released data.
Brief overview of the data
The data were not collected from a random sample; rather, respondents tended to be people we knew, people who knew the people we knew, people who knew those people, etc., in addition to being people who read to their children and are interested enough in reading to children that they were willing to participate in a survey on the topic. In some sense, surveys are never conducted with truly random samples as people have to select into the sample voluntarily. However, given the fact that our friends and family were possibly more likely to complete and recirculate the survey invitation and link, at least initially, and given the nature of our immediate circle of friends and family (e.g. high SES), it is important to understand the distributional properties of the data.
Children
Five hundred and ninety-one of the responses were from caregivers of boys and 512 responses were from caregivers of girls. Table 1 shows the age distribution by child sex. Age information was not provided for two children: one boy and one girl. The other questions about the child are incomplete for three boys – one aged 13–14 months, one aged 21–22 months, and one aged 25–26 months – and five girls – two aged 7–8 months, one aged 17–18 months, one aged 25–26 months, and one aged 31–32 months.
Table 1. Number of children in each age category (in months) by sex
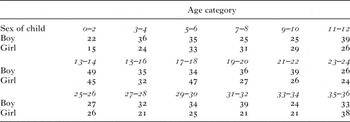
Sex information was not supplied for four children. One was in the 0–2 months age group, one was in the 9–10 months group, one was in the 11–12 months group, and the fourth was in the 31–32 months age group. These children are not included in Table 1. The rest of the child information is complete for these four children.
One thousand and thirty-six of the children were born full-term. Twenty-six had been identified as having a diagnosed hearing, language, or cognitive delay. This information was not provided for two of the children (both girls). Eight hundred and forty-eight of the children were producing at least some words, with 629 producing more than ten understandable words. Two hundred and fifty-seven children were not yet producing any words. Five hundred and eighty-three of the children were producing two-word sequences at the time of the survey, and 433 of the children were producing sequences of more than three words. Some of the language development information was missing for seven of the children (three boys, four girls).
Parents/caregivers
This is the biggest source of missing information, although most of the parents/caregivers did provide this information; some or all of the information about the respondent is missing for only eighteen of the boys and nineteen of the girls, and one child whose sex was not specified. One thousand and seventy-three parents/caregivers provided information about their gender; 1,023 identified themselves as female, 48 as male, and one selected other. Thus, there are not enough non-female respondents in the dataset to be able to carry out meaningful comparisons based on parent/caregiver gender. The ages of the respondents who answered the age question are as follows: 5 parents/caregivers were under 21, 22 were 21–25 years of age, 244 were 26–30, 467 were 31–35, 264 were 36–40, 64 were 41–45, 8 were 46–50, and one was over 50. The educational level of the sample was highly non-representative of the general population in North America – 83% of our respondents who answered the question about education had completed a bachelor's degree or higher, which contrasts with a rate of 25% for the population in Canada (Statistics Canada, 2012) and around 32% for the United States (United States Census Bureau, 2015), the two countries from which most of our responses came. Note that the ages included in the data from the two countries are slightly different, both from each other, and from the age categories we used in our questionnaire. The Canadian data only include adults aged 25–64 from 2009 (Statistics Canada, 2012), while the US data are for adults aged 25 years and above (United States Census Bureau, 2015), whereas our sample includes some caregivers who are younger than 25 years of age. (We do not know the location of all respondents. We did not ask about location; however, the program sometimes, but not always, automatically supplied it, presumably on the basis of the IP address. As we did not ask any questions about location, it is not part of the official dataset, and so information about respondents’ locations is not being shared.) No respondent had only completed elementary school. For 29 respondents the highest level of education completed was high school. One hundred and fifty-four respondents had completed some higher education and 383 had completed a Bachelor's degree. Three hundred and seven respondents had completed a Master's degree of some kind, while 164 had a PhD. A further 38 had completed a professional post-graduate degree.
Books
The book responses appearing in the posted dataset are the result of some data cleaning and organization. First, research assistants went through the survey, looking for book titles that appeared to be the same despite being entered in the survey differently by different respondents. When such examples were found the titles were adjusted to be consistent. An example: some respondents typed “The Very Hungry Caterpillar” and others typed “Very Hungry Caterpillar”. Instances of Very Hungry Caterpillar were adjusted to read The Very Hungry Caterpillar. Then authors’ names were entered into the dataset. Some titles are too generic to definitively associate with an author – there are numerous children's books available with that title and none are common, or there is no title that is a complete match. In such cases, no author name was entered. Occasionally respondents provided author information, but this was the exception rather than the rule. When they did so, this information was retained. In several instances respondents provided authors for titles that would otherwise have been too generic to assign an author to. The result of this is that books with the same title appear in the dataset with and without authors. (In one instance only, these rules resulted in a title being associated with two different authors; it was a well-known children's title and so all instances of the title reported without an author were associated with the well-known version of the title, but the one instance where an author's name was provided was retained. Presumably the respondent provided the author's name because it was not the more common book of the same name.) Sometimes the author information is actually publisher/series information that is part of the title rather than true authorship, e.g. “Usborne” or “Scholastic”, as this was sometimes enough to definitively identify the book. Sometimes respondents entered series names rather than individual book titles. That information is retained, and whenever possible author/publisher names are provided for series. Books entirely in languages other than English were removed from the dataset, as the survey specifically asked about books in English; bilingual books were not removed.
There are 2,227 unique entries, 2,214 of which are either titles of or references to a single book or a series title. (Not every respondent listed five books.) The other thirteen are things like “library book”, “newspaper”, or “custom made book”. One thousand six hundred and seventeen of the titles are uniquely identifiable, at least in terms of their text. A small number of the titles in the dataset do not have accompanying author or publisher information; sometimes their unique identity was clear from the title (e.g. National Geographic's Special Dinosaur Issue), or author/publisher information was difficult to discern but its lack did not make the identity of the book unclear (e.g. Goodnight My Sweet Pea). Within these 1,617 titles, 1,614 are also identifiable as to their likely version, while 3 are not: Cars Look and Find by Disney, Twas the Night before Christmas, and Baby Beluga. This is relevant for researchers interested in illustrations rather than / in addition to text. There are an additional 522 titles that are not identifiable. These include very generic titles like “Planes” as well as titles like “Peek-a-boo Elmo: Puppies” that we could not find a match for. There are seventy-five series or periodicals listed, many accompanied by author information. These range from things like “Little Golden books”, which encompasses a range of stories, and “Touch and feel books”, which again covers a number of books by the same publisher but this time united by a theme, to things like “Maisy book series” and “Sandra Boynton books”, where the author is the same for all books in the series, even though the stories differ. Note that entries are not coded as unidentified or series in the dataset; entries that we are counting as series or periodicals in this description are plural (e.g. “Sandra Boynton books”), and entries that are not identified have no accompanying author or publisher information. Thus, we left the information provided by respondents in the dataset even when it did not refer to a uniquely identifiable title.
While we will not provide much in the way of in-depth analysis of the data here (as our intention is instead to provide the dataset to people who might be interested in doing just that), we did do some exploration of the data to get a sense of broad trends. One of the most striking things about the identifiable titles is how much variation there is in which books children are hearing. Only one book was listed by more than 200 respondents; Goodnight Moon by M. Wise Brown was listed 219 times (19·8% of respondents). Two more were listed more than 100 but less than 200 times: The Very Hungry Caterpillar by E. Carle (128 times) and Brown Bear, Brown Bear, What do you See? by B. Martin and E. Carle (118). Only four books were listed 50–99 times, that is, by at least 4·5% of our sample. Ten books were mentioned 30–39 times, and 15 books were listed 20–29 times. (No books were listed more than 39 but less than 50 times). Note that 20 responses equals just under 2% of our sample. The overwhelming majority of titles – 1,137 of the 1,617 uniquely identifiable book titles – were only listed by one respondent. Figure 1 shows the number of books by the number of times the book was reported in the survey. Note that the x-axis treats numerosities as ordered categories with bins of differing sizes; the intention is to convey the variation without taking up too much space; were it to contain all numerosities from 1–128 as individual bins it would be too large (due to the number of empty categories).
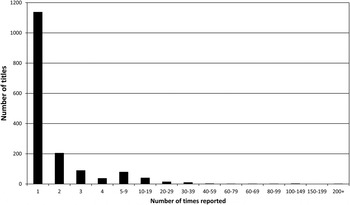
Fig. 1. Number of books by the number of times reported in the survey.
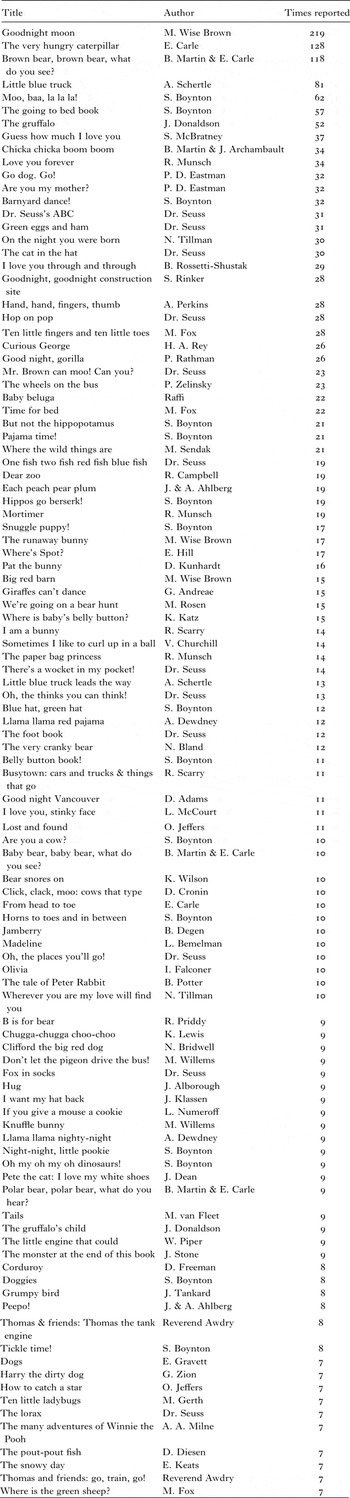
Continuing with an exploration at a database-wide level, we created a “top 100” list. These are the 100 most frequently listed books. It turns out that, to be included in this list, a book only needed to be listed seven or more times. That means that books listed by less than 1% of the respondents are on this list, which appears in ‘Appendix B’. Note that this list is actually the 105 most frequent, since there was no way to non-artificially cap the list at 100 given the number of books – ten – listed seven times.
The top 105 list only considers specific individual books, but there are series or sets of books that are also popular. For instance, fourteen respondents listed specific identifiable (but different) Elmo books, and one listed “Elmo books”, which is counted as a series. Thus, while fifteen children represented in the survey were being read Elmo books at the time, there was some variety in which Elmo book(s) they were hearing. There are several series that show the same pattern; any individual book is listed only once or twice, but more than one book in the series is listed (e.g. Olivia books, Curious George books, Little Critter books.) Given that the writing (and illustrations) tend to be similar within series or sets, if one were interested in books as input, it would be reasonable to include a representative book from a series that is listed frequently even though no single book in the series is listed frequently enough to be included in a ‘most-frequently listed’ list.
The questionnaire was designed to allow for more fine-grained analysis, for instance, by age and sex, and it may be the case that the high degree of variation in books being read is at least partially a function of changes in what children are being read by age. As pointed out by one reviewer, children often get fixated on a set of books, with this set of books shifting over time. (However, if all children are selecting their current favourites from the same larger set of books, which may or may not be the case, we would expect to see more similarity than we do, suggesting this isn't necessarily what is driving the variation.) Moreover, the degree to which the child her- or himself can select the books being read changes over the age range examined: a 4-month-old is read whatever books the parent selects, but a one-year old can be quite insistent about their choices.
To look at this, we examined the percentage of children in each age group being read (i) one of the three most popular books (books listed more than 100 times) and (ii) any book listed 20 or more times (or by at least ~2% of the sample), shown in Figure 2. (Of course, the second number subsumes the first: if a child is being read a book listed more than 100 times they are by definition being read a book listed more than 20 times.) On the first metric there do appear to be some differences in books by age; 50% of the children in the youngest age group are being read one of the three most popular books, in contrast to just over 18% of children aged 35–36 months. The differences are not as large when we consider all the books listed 20 or more times, in contrast. These are quite popular with parents of the youngest children (almost 66% of the youngest children are being read a book listed more than 20 times) and remain quite popular even with the older children (63·4% of the children aged 35–36 months are being read a book listed more than 20 times), who presumably have more personal choice over the books they are being read.
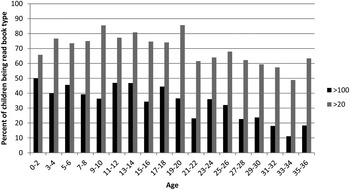
Fig. 2. Percentage of children at each age being read a book reported more than 100 times / more than 20 times.
Although the percentage of children being read books listed more than 20 times is fairly constant, there could of course be a lot of differences in which particular books in that set children are hearing across the age groups. As this paper is not intended as an in-depth discussion of books by age, we will not break this down too finely, but we did look at how much of the ‘over 20’ children are the same or different from the ‘over 100’ children at the two youngest and two oldest age groups. (We grouped two ages together at the youngest and the oldest ranges just to get a larger sample.) Considering the children aged 0–4 months of age, 60·5% of all the children in that age range are being read a book listed more than 100 times plus another book listed more than 20 but not 100+ times. No child in this age range is only being read one of the books listed 100+ times but not another book listed 20+ plus times; however, 28·6% of the children aged 0–4 months of age are being read a book listed more than 20 but not 100 or more times. For children aged 33–36 months, only 26·9% are being read a book listed more than 100 times as well as another book listed over 20 but fewer than 100 times. In this age range as well, no child is only being read a book listed 100+ times but no other book listed more than 20 but less than 100 times.
What does this mean for analyses of children's books? It suggests that any analysis that focuses on only the highly frequently reported books (i.e. those reported 100+ times in this survey) will do a middling job at capturing the younger children's input, as 43·9% of the youngest children in our survey were being read one of those three very frequently reported books. And it will do a poor job at capturing the older children's input, as fewer than 16% of the children in this age group were being read one of the three books listed 100+ times. However, an analysis of the books listed less frequently (i.e. more than 20 but less than 100 times) will capture the input children at all age ranges are receiving. This brief breakout analysis shows that the choice of books to analyze will affect the generalizability of findings in different ways for different ages.
A COMPARISON BETWEEN OUR DATASET AND PREVIOUS SETS OF BOOKS ANALYZED
This leads to the question of how our dataset compares to lists that have been analyzed by recently published work interested in the link between books and language development. Previous lists of books did not include as many titles as we have in our list. Thus, we will present comparisons between their lists and our list overall, but we will also present comparisons between the other lists and the most frequently provided books on our list at a level that makes sense given the number of books on the other list.
Cameron-Faulkner and Noble (Reference Cameron-Faulkner and Noble2013) compiled a database of twenty books from the Amazon UK website bestsellers list to compare sentence types in child directed speech (CDS) and book text. Only two of the titles they analyzed appear in our top 105 titles: One Fish, Two Fish, Red Fish, Blue Fish by Dr Seuss (listed 19 times in our dataset) and Hug by J. Alborough (mentioned 9 times), and only six of their twenty books appeared anywhere in our dataset. One of the books they list is actually a collection of fairy tales and they note which specific ones they analyzed for their study. Of those fairy tales, one is listed as a separate item eight times in our data (Three Little Pigs), another occurred six times in various forms in our dataset (Cinderella), another is listed three times (Little Red Riding Hood), another two times (Sleeping Beauty), and one did not occur at all (The Story of Rumplestiltskin). The generic “Fairy tales” also shows up once in our dataset, “Grimm's fairy tales” once, and “World fairy tales” once as well. Even with these various fairy tale accountings, it appears that the books Cameron-Faulkner and Noble analyzed are not very popular with children aged 0–36 months or their caregivers, and so may not be the best books to analyze if one cares about the input children are actually hearing.
One possible reason for the large discrepancy is the fact that Cameron-Faulkner and Noble (Reference Cameron-Faulkner and Noble2013) were using sales data from the UK Amazon site, whereas most of our respondents came from North America: it is entirely possible that the books which are popular in the two places are different. As mentioned previously, although we did not ask for geographic information, sometimes the survey provider recorded it. Thus, it is possible to examine just the responses of respondents who were known to be in the UK. Keeping in mind that our confirmed UK sample was quite small (N = 11), it is interesting to note that none of the books analyzed by Cameron-Faulkner and Noble were listed by these respondents. Although people are clearly buying those books for children, they may not be ones children are hearing.
Montag, Jones, and Smith (Reference Montag, Jones and Smith2015) compared lexical diversity in CDS and children's books. They selected 100 children's books for analysis (p. 1490) “from lists of librarian-recommended picture books, amazon.com best sellers, and circulation statistics from the Infant and Preschool sections of the Monroe County (Indiana) Public Library”. As with the selection method used by Cameron-Faulkner and Noble (Reference Cameron-Faulkner and Noble2013), this seems to be a reasonable method for selecting a sample of books young children are hearing. However, we again see some mismatches between the books appearing in the IBDb and their sample.
Montag et al.’s (2015) database is larger than Cameron-Faulkner and Noble's (Reference Cameron-Faulkner and Noble2013), including 100 titles, and the overlap between our two datasets is greater. Sixty-two of their 100 books appear in our dataset, but only 30 occur in our top 105 books. An additional four of their titles occur in series that are mentioned in our dataset. So while about 2/3 of the books they analyze are mentioned by the caregivers who responded to our survey, only 1/3 of their books are even relatively frequent in our data (listed seven or more times). Another third were listed very infrequently: 15 of the books in their sample were mentioned once in our survey, a further 8 were mentioned twice, 4 were mentioned three times, and 3 titles were listed by four respondents.
Another way to compare the lists is to start with our list and see whether the books that are listed most frequently by our respondents are on the lists of books other researchers have analyzed. The previous paragraphs provide the information regarding the top 105 books on our list. Here we discuss the top 32. These are books listed 20 or more times by our respondents. Twelve of our top 32 books were also in the Montag et al. (Reference Montag, Jones and Smith2015) list; only one was in the list of books analyzed by Cameron-Faulkner and Noble (Reference Cameron-Faulkner and Noble2013).
We should point out that our survey targeted parents and caregivers of children aged 0–36 months. Cameron-Faulkner and Noble (Reference Cameron-Faulkner and Noble2013) state they were looking at books for two-year-olds, and Montag et al. (Reference Montag, Jones and Smith2015) were targeting books for children aged 0–60 months. So the three datasets are targeted at different aged children. However, there is enough overlap that we do not think it likely that the differing age targets are solely responsible for the differences in books included in the three datasets (e.g. almost 400 of the children represented in our dataset are aged 23–36 months, i.e. more-or-less two-year-olds, and the entire age range is within the age range Montag et al., are concerned with). Note that we cannot look just at the number of two-year-olds given the age ranges in our age categories. The earliest two-year-old category is 23–24 months, including both one- and two-year-olds, and the oldest is 35–36 months, so including new three-year-olds as well.
It is clear, then, that there is not a tremendous amount of overlap between the books in our dataset and those that have been used for previous analyses. Whether or not this is a problem is a separate question, and one we are not going to attempt to answer. Interestingly, the genres of the books are largely the same in all three databases – storybooks. Because they are all primarily of the same type, the books in our dataset and those used in previous analyses may present children with fairly equivalent input, in terms of sentence complexity or lexical diversity, the variables the previous researchers were interested in.
However, we know that children are read other kinds of books, especially word books. Importantly, these other kinds of books do show up in our dataset, in contrast to the other datasets; they are just either not in the top 105 (and so weren't mentioned in the comparisons just reported) or are not uniquely identified. For example, there were eight different identified color/colour books mentioned (accounting for 11 responses in total) and ten different identified word books (accounting for 22 responses in total) (e.g. Richard Scarry's Best Word Book Ever). There were also twenty-eight mentions of colour/color books that could not be identified, and thirty-four non-identifiable mentions of word books (e.g. “First words”). Thus, our dataset can provide a broader picture of what children are hearing in the books they are being read.
Additionally, recall that we also asked parents whether and how much they stick to the text in the book for each of the five books they listed, something that clearly affects the input children are receiving in bookreading sessions. It not clear how reliable this information is, as it was asking people to recall how they typically read a book, something they may not be very good at. In addition, this information was not provided by all respondents, or for every book each person listed. However, it is part of the dataset and so available to researchers interested in how reading practices might differ by age, language development, or book genre.
Another advantage of our dataset is that it is possible to analyze subsets of the data, for example, books being read to preverbal versus verbal children, or boys versus girls. Or one can look at books being read to children at different ages, or by parents with different levels of education. It is these latter possibilities that we feel make the dataset so useful. The brief analysis we conducted above looking at the distribution of ‘popular’ or (somewhat) frequently listed books across age is an example of the potential of this kind of break-out analysis.
One issue raised by the comparisons (and an anonymous reviewer) is the question of representativeness. That is, what does it mean for a sample of children's books to be representative of books children are actually being exposed to? Previous researchers have taken pains to construct what seemed to be reasonable samples of books to analyze, yet their samples do not overlap much with the books listed frequently in our survey, even when ‘frequent’ was defined very minimally (i.e. reported by less than 1% of our sample). But is a book being read by less than 1% of our sample really any more representative than the books in the other lists analyzed? It's not entirely clear how to answer that question other than to say that we would argue it is more representative than a book that no parent or caregiver reports reading, as was the case for fourteen of the books in the Cameron-Faulkner and Noble (Reference Cameron-Faulkner and Noble2013) sample and thirty-two of the books in the Montag et al. (Reference Montag, Jones and Smith2015) sample. Note that we asked about books the caregiver was reading ‘most often’ to the child at the time, that is, books that were being read over and over. Given this, our survey would have missed books that were read once or twice and then left aside. It is possible that the books that are popularly purchased or frequently checked out of the library (i.e. those included in the other analyses) are ones that are read once or twice to children but then not much thereafter. Thus, they would be books that children would receive less exposure to. Whether the books analyzed by Cameron-Faulkner and Noble and Montag et al., are different in any notable or input-relevant ways from the books listed frequently (or at all) in our data is an empirical question but, going forward, it would seem to us to be more prudent to analyze books that we know for certain that at least some children are being read. Although we cannot know that books not listed in our survey are not being read, we do know that books listed in our survey are. It is also worthwhile considering why the discrepancies exist between our sample and theirs. We can only speculate, but our suspicion, based on our experience as parents and therefore book-selectors, is that the best-seller and library lists are books that appeal to adults doing the purchasing as opposed to children. Once children can exert some agency over the books they hear, this distinction becomes increasingly important. Therefore, any analysis concerned with books read to older children needs to consider the nature of the sampling technique more carefully than one looking at books read to younger children.
CONCLUSION
Although we initially created this dataset to conduct our own research on a specific aspect of input and children's books, we quickly realized the potential the dataset had, and so decided to share it with the wider research community. It is our hope that this database (the Infant Bookreading Database or IBDb) will help researchers interested in children's books, language acquisition, and input for many years to come.
Appendix A
The survey questions and response possibilities are listed here in order. They are numbered here for convenience, but note that not all questions were numbered in the survey. The actual survey was separated into six different pages plus the initial consent page (not copied here).
-
1. What is your child's age?
To answer this, the respondent clicked on one of the following choices: 0–2 months, 3–4 months, 5–6 months, 7–8 months, 9–10 months, 11–12 months, 13–14 months, 15–16 months, 17–18 months, 19–20 months, 21–22 months, 23–24 months, 25–26 months, 27–28 months, 29–30 months, 31–32 months, 33–34 months, 35–36 months.
-
2. Is your child a: girl/boy? (each response had its own circle that the respondent clicked on)
-
3. Was your child born full-term (at 37 weeks or more)? Yes/No (For this and all other Y/N questions, Yes and No selections (circles to click on) were placed under the question. Yes was always on top of No.)
-
4. Does your child have any diagnosed hearing, language, or cognitive delays? Yes/No
-
5. Does your child produce any words yet? Yes/No
-
6. Does your child say more than 10 words that you can understand? Yes/No
-
7. Does your child produce any two-word sequences yet? Yes/No
-
8. Does your child produce any sequences of more than three words yet? Yes/No
-
9. List the five books that you currently read most often to your child. Put your child's favorite (or the one you read most often) first, the next favorite (the one you read second most often) second, etc.
For this question there were five empty text boxes labeled Book One, Book Two, Book Three, Book Four, and Book Five. The boxes were arranged vertically, with Book One at the top and Book Five at the bottom. The respondent typed their responses into each box.
-
10. Are there any other books that your child hears frequently? If so, please enter their titles into the spaces below.
-
11. Next we have a question about how you read the books that you listed. Specifically, we are interested in whether you stick to reading the words in the book or do you say things not written in the book. Do you just read the words, or do you do things like point out other parts of pictures, mention other features of the objects in the book not listed, or use different words than those written in the book?
Thinking about “Book One” (field populated by participant's earlier response), do you:
-
– always just read the words printed in the book
-
– mostly just read the words printed in the book but sometimes say other things
-
– read the words in the book and say other things about equally often
-
– sometimes read the words in the book/mostly say other things
-
– never read the words in the book/always say other things.
This was repeated for books 2–5. Each of the options was preceded by a circle that the respondent could click on to make their selection. They could only select one option.
And finally, some questions about you.
-
-
12. Your gender (male/female/other)
-
13. Your age (under 21, 21–25, 26–30, 31–35, 36–40, 41–45, 46–50, over 50)
-
14. Your highest level of education completed: elementary school, HS, some higher education (e.g. trade certificate, some university or college), Bachelors degree, Masters degree, PhD, Professional Postgraduate degree
For these final three questions, each of the options listed after the question was a possible response that the respondent could select.
Appendix B
Top 105 most frequently listed books


 Open access