


Introduction
Water has always been a very important natural resource. The great civilizations of ancient times were established near the water. With the advancement of technology, the increase in the ways and rates of water use, the development of water resources for many purposes such as drinking-utilization, irrigation water and energy production have played a major role in the economic development of countries (Yıldız, Reference Yıldız2014).
One of the most important agricultural inputs is water. Despite the limited production resources, consumption needs are increasing day by day and it is getting harder to meet the demand of human beings. In order to overcome this problem, people are looking for ways to make more production with their scarce resources. In order to meet the consumption by using the water resources, which have an important role in meeting human needs, in an optimum way, it is necessary to obtain the necessary data in order to obtain higher yields from the unit area with the limited water resources allocated for agriculture in the country and local conditions.
Rice is the only cereal grain that has an important place in human nutrition. It germinates in water and its roots can utilize oxygen dissolved in water. As a cultivated plant, it consists of a long root, narrow leaves, compound clusters and spikelets, each of which contains only a single paddy grain. The clusters of this plant, which has a high branching capacity, contain an average of 200 paddy grains. After these grains are processed, they become rice suitable for human consumption. Rice is the second most consumed grain in the world. Rice, which meets 50% of the daily calorie needs of half of the world's population, is a source of magnesium, vitamin B, niacin, phosphorus, vitamin B6, zinc and copper. However, it has very low values in terms of protein (Özer, Reference Özer2019). The most important limiting factor in rice cultivation is the supply and management of irrigation water. Since rice is cultivated under continuously flooded or saturated soil conditions for a significant part of the growing period, it is one of the crops to which the most irrigation water is applied. It is a crop that requires water throughout its growth and development.
Rice has a very important place in human nutrition. Among the cereals, it comes after wheat in terms of cultivation area and corn in terms of production in the world and is the main food of more than half of the world's population (Sürek et al., Reference Sürek, Kahraman and Ünal2016). If the worldwide population growth rate continues, rice production should be increased by 50% all over the world in order to meet the demand in 2030 (FAO, 2022). The rice plant is commonly cultivated in anaerobic conditions and the most important limiting factor in its farming is the supply of water. Approximately 497 million tons of rice was obtained from 162.5 million hectares of land in the world during the 2018/19 production season (Anonymous, 2020). Although rice is cultivated in many regions of Türkiye, 71% of the production is carried out in the Marmara Region, where the experiment was conducted. It is sustainable to cultivate rice in areas flooded by natural precipitation in the Asian continent, but it is not sustainable to use the flood irrigation method, which is widely used in countries that are not rich in water sources, such as Türkiye. Considering our current water availability, it will not be possible to increase rice production with traditional irrigation methods and it will decrease even more in the future. This situation has made it necessary to use properly planned and properly managed irrigation systems in the rice production sector as well as in the entire agricultural sector. However, water, energy and labour costs are very high under flood cultivation of rice, accepted as the traditional irrigation method for the paddy lands. Moreover, the physical and chemical structure of the soil, which is constantly under water, deteriorates. In addition, as a result of surface evaporation and deep percolation, a large part of the applied irrigation water is lost. For all these reasons, it has become necessary to cultivate rice with sustainable production techniques requiring less water, especially in recent years, with climate change and the decrease in water resources and pollution.
Developing irrigation technologies allow systems to be used in agricultural areas, where every drop of water used in agriculture can be calculated, managed and controlled. Pressurized irrigation systems, in which irrigation losses are minimized, have been used extensively in the world and in Türkiye in recent years. In the studies carried out in Türkiye (Tuna, Reference Tuna2012; Özer, Reference Özer2019; Demirel et al., Reference Demirel, Çamoğlu, Tatar, Nar, Boran, Eroğlu and Genç2020) and in the World (Ramulu et al., Reference Ramulu, Rao, Devi, Kumar and Radhika2016; Sharda et al., Reference Sharda, Mahajan, Siag, Singh and Chauhan2017; Padmaja and Malla Reddy, Reference Padmaja and Malla Reddy2018; Natarajan et al., Reference Natarajan, Duraisamy, Thiyagarajan and Manikandan2020), it was determined that the rice plant could be grown under conditions of drip irrigation method, providing significant water savings. In some studies, it was determined that water constraint due to the irrigation methods used (drip irrigation, sprinkler irrigation) in rice cultivation caused yield decreases (Bayrak, Reference Bayrak1986; Dabney et al., Reference Dabney, Breitenbeck, Griffin and Hoff1989; Muirhead et al., Reference Muirhead, Blackwell, Humphreys and White1989; McCauley, Reference McCauley1990; Sürek et al., Reference Sürek, Aydın, Çakır, Karaata, Negis and Kuşku1996; Beşer, Reference Beşer1997; Çakır et al., Reference Çakır, Sürek, Aydın and Karaata1998a; Dunn et al., Reference Dunn, Mathews, Beecher, Thompson and Humphreys2004; Tuna, Reference Tuna2012; Khairi et al., Reference Khairi, Afifah, Jahan and Nozulaidi2015; Özer, Reference Özer2019; Demirel et al., Reference Demirel, Çamoğlu, Tatar, Nar, Boran, Eroğlu and Genç2020). Yield losses due to drip irrigation were cited at different rates in different studies: 50% by Demirel et al. (Reference Demirel, Çamoğlu, Tatar, Nar, Boran, Eroğlu and Genç2020); 20% by Özer (Reference Özer2019), 13% by Tuna (Reference Tuna2012); 14 to 40% by Castaneda et al. (Reference Castaneda, Bouman, Peng and Visperas2002) and 35% by Dunn et al. (Reference Dunn, Mathews, Beecher, Thompson and Humphreys2004). Water savings due to drip irrigation were cited at different rates in different studies: 56% by Beşer et al. (Reference Beşer, Sürek, Şahin, Kaya, Tuna and Çakır2016), Ottis et al. (Reference Ottis, Henggeler and Vories2006) by 80%, Sharda et al. (Reference Sharda, Mahajan, Siag, Singh and Chauhan2017) by 40, 40 and 52% by Castaneda et al. (Reference Castaneda, Bouman, Peng and Visperas2002). This significant amount of water savings allows the expansion of paddy cultivation areas. The highest yields in field trials including irrigation programmes based on the coefficients of the evaporation amount from class A evaporation pan for the rice plant cultivated by the drip irrigation method, were obtained from the applications from pan coefficient of 1.50 (Tuna, Reference Tuna2012; Padmaja, Reference Padmaja2014; Ramulu et al., Reference Ramulu, Rao, Devi, Kumar and Radhika2016; Sharda et al., Reference Sharda, Mahajan, Siag, Singh and Chauhan2017; Natarajan et al., Reference Natarajan, Duraisamy, Thiyagarajan and Manikandan2020), pan coefficient of 0.8 (Sarkar et al., Reference Sarkar, Ghosh and Biswas2018) and 20% of the cumulative pan evaporation at 1-day intervals (Singh et al., Reference Singh, Prajapati and Bhardwaj2018).
The aim of the current study was to investigate the use of subsurface and surface drip irrigation methods instead of the traditional irrigation method requiring huge amounts of irrigation water. In addition, it was aimed to determine the most suitable irrigation programme for paddy lands, among surface and subsurface drip irrigation methods application.
Materials and methods
Materials
Geographical location of the study
Kırklareli is located in the northwest of Türkiye, in the Thrace part of the Marmara Region (41o42′N and 27o12′E). The altitude of the experimental area is 203 m above sea level. Rice cultivation in the region constitutes 71% of Türkiye's overall rice production.
Soil and irrigation water characteristics
The field study was carried out between 2019 and 2020 on the lands of Kırklareli Atatürk Soil Water and Agricultural Meteorology Research Institute covered with alluvial soils. Soil samples were collected from different layers of the experimental land and used to determine some chemical properties of the soil, such as pH, EC, lime, organic matter, plant available P2O5 and K2O amounts and physical characteristic such as soil texture, field capacity, wilting point, bulk density in disturbed and undisturbed soil samples. As a result of the laboratory analyses it was determined that the 0–60 cm layer of the experimental soil had a loam texture (L), while the texture of the 60–120 cm layer appeared as sandy clay loam (CL). The water holding capacities of the soil profile (0–90 cm) at field capacity and wilting point were determined as 230 and 105 mm respectively, while the available water capacity of the same layer was calculated as 125 mm. The 0–30 cm layer of the soil was poor in organic matter, sufficient in potassium and rich in phosphorus (Table 1).
Table 1. Physical and chemical properties of the soil at the experimental site
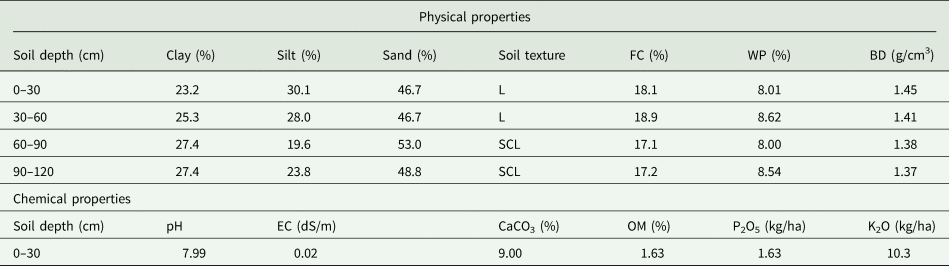
FC, field capacity; WP, permanent wilting point; BD, bulk density; L, loam; SCL, sandy clay loam; EC, electrical conductivity; CaCO3, calcium carbonate; OM, organic matter; P2O5, phosphorus pentoxide; K2O, potassium oxide
Rice variety
The use of imazamox (IMI) rice varieties, which allow the use of imazamox-containing weed herbicides used in dry farming of other crops such as soybeans, chickpeas and beans, is more suitable in terms of the weed control under drip irrigation conditions. For these reasons, the IMI cultivar, Rekor CL, selected in the Thrace Agricultural Research Institute/Edirne/ Türkiye, was used in the study. It is a paddy variety developed by Trakya Agricultural Research Institute from HALILBEYXIMI variety back hybrid and registered in 2018. Plant height is 100 cm. Leaves are horizontal and clusters are semi-recumbent. Paddy grains are yellow and long. Paddy thousand grain weight is 33–34 gr. It matures in 125–130 days and has good yield potential. It can adapt to different conditions. It is a Clearfield variety, resistant to IMI group herbicides. For this reason, it can be used in the control of red paddy by using IMI group herbicides with the effective substance imazamox. Rice grain length is 6.3 mm and width is 2.8 mm. Rice thousand grain weights are 24–25 gr (Anonymous, 2023).
Irrigation system
A joint control unit was used for the subsurface and surface drip irrigation systems used in the trial. The control unit of the irrigation system was composed of hydro-cyclone, fertilizer tank, mesh filter, pressure gauges, valves and fittings. A main pipeline with a diameter of 63 mm and a manifold pipeline with a diameter of 40 mm were used in the system. The laterals applied in the subsurface and surface drip irrigation systems were 20 mm in diameter and equipped with pressure-regulated drippers at 40 cm intervals. The flow rate of the drippers was 2 l/h. Dripper spacing and flow rate were determined by considering the infiltration characteristics of the soil. Specially produced laterals preventing the entrance of the roots in the drippers were used in the subsurface drip irrigation system. The drip irrigation laterals in the subsurface drip irrigated plots were placed at 25 cm depth below the soil surface. In this system, the main line and manifold pipes were placed underground in the trial area. Lateral spacing was applied as 60 cm. The flood irrigated plots were levelled and were surrounded by embankments with a height of 30 cm, in order to provide the control on the applied water. Water applied to the experimental plots was measured using water metres placed on the manifolds of each experimental plot.
Class-A evaporation pan
A standard class evaporation pan was used to determine the amount of water to be applied to the trial treatments. For this purpose, the daily evaporation amount was determined by measuring the water level in the evaporation pan at 09:00 h every day and taking the difference between the measured water level value and the water level measured the previous day. Water level measurements were made at the same point with a micrometre depth metre with 0.01 mm sensitivity. When the decrease in the water level was around 25 mm, water was added so that 5 cm air margin was left on the container. In addition, the water in the container was emptied and cleaned every week. Class A evaporation pan had a diameter of 121 cm and a depth of 25.5 cm and was made of galvanized sheet. In order to determine the amount of irrigation water for any of the experimental plots, the evaporation pan used in the study was located in the trial area. The evaporation vessel was placed on a wooden crate with a height of 15 cm from the ground. The water height in the container was kept 5–7.5 cm lower than the upper level of the container.
Irrigation water characteristics
Irrigation water used in the trial was obtained from the deep well, located on the land of Atatürk Soil Water and Agricultural Meteorology Research Institute. Water samples were analysed following procedures given by Richards (Reference Richards1954). Some characteristics of the water applied in the study are summarized in Table 2.
Table 2. Some chemical properties of irrigation water used in the current research
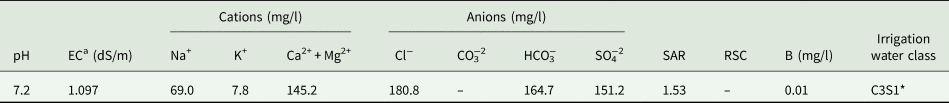
EC, electrical conductivity; Na+, sodium ion; K+, potassium ion; Ca2+, calcium ion; Mg2+, magnesium ion; Cl−, chloride ion; CO3−2, carbonate ion; HCO3−, bicarbonate; SO4−2, sulphate ion; SAR, sodium adsorption ratio; RSC, residual sodium carbonate; B, Boron.
a C3S1: Water classification according to EC and SAR values (Richards, Reference Richards1954).
Methods
Traditional (flooding) irrigation and surface drip and surface drip irrigation methods were used as irrigation methods and the field trial method was based on the comparison of these irrigation methods. The study was carried out in split plots in randomized blocks trial design. The applied irrigation methods were the main treatments, while the irrigation levels (pan coefficients) were considered as the sub-treatments of the drip irrigated plots (Table 3). The t test was applied to compare the results under drip and traditional irrigation.
Table 3. The applied experimental treatments in the current study
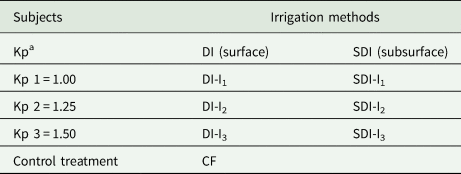
a Kp, Class A-pan coefficient (the k coefficients are the sub-treatments in the trial); DI, drip irrigation; SDI, subsurface drip irrigation; I1, Class A-pan evaporation rate × 1.00; I2, Class A-pan evaporation rate × 1.25; I3, Class A-pan evaporation rate × 1.50.
The plots sizes were arranged as: 20.0 m × 5.0 m = 100 m2, with inter-row distance of 20 cm, lateral and dripper spacing of 60 and 40 cm. The lateral pipes in the subsurface drip irrigation system were placed at 25 cm depth in the soil (Fig. 1).

Figure 1. The layout of the experiment.
Moisture content in 0–30, 30–60, 60–90, 90–120 cm layers was determined by neutron probe (Model 503 DR, Campbell Pacific Nuclear, Martinez, CA) every two weeks in all experimental plots irrigated with drip irrigation method. For this purpose, one aluminium neutron pipe was placed in the middle of each plot to a depth of 120 cm. Before the start of the project, neutron metre calibration for the experimental field soil was carried out using gravimetric soil sampling.
Irrigation applications
In surface and subsurface drip irrigation methods, a 30 cm layer of the soil was kept at a moisture level close to the saturation point until plant emergence. The application of the treatments started after the completing of seed germination. The amount of irrigation water applied to experimental plots with each irrigation was determined by Eqn (1), using the cumulative evaporation values measured. The Class A evaporation pan coefficients of 1.0, 1.25 and 1.5 were the sub-treatments.

where I: Amount of irrigation water (L), A: Area of plot (m2), E pan: Amount of water evaporated from the evaporation tank (mm), k p: Pan coefficient (the k coefficients are the sub-treatments in the trial), P: Percentage of wetted area (%). In calculating the amount of irrigation water applied to the rice plant, the entire plot area was considered as the area to be wetted (P) and kept constant throughout the entire growing period.
In the traditional (flooding) irrigation method, 0–30 cm of the soil was kept close to the saturation point until the rice seed germinated. Following the germination, water was applied to the plots and kept at constant 10 cm depth (height) until the end of the irrigation season. In order to provide oxygen to the plant, the water in the pans was completely emptied once a week and re-ponded with oxygen-rich water. In subjects, where drip irrigation was applied, the irrigations were applied 3 days a week, on Monday, Wednesday and Friday. After the rice plant completed the maturation period, irrigation was terminated approximately 15 days before harvest. In our study, irrigation treatments were started on 14 June and ended on 13 September in 2019, and started on 01 July and ended on 28 September in 2020.
The productivity of water on the basis of irrigation water (I) or irrigation water + precipitation (P + I) applied in different application conditions was determined by the approaches stated by Çakır (Reference Çakır2020).

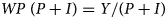
where WP (I): Seasonal irrigation water-based water productivity (WP) applied to the treatment (kg/m3)
WP (I + P): WP based on irrigation water + precipitation total (kg/m3)
Y: Grain yield, t/ha
I: Seasonal irrigation water, mm
(P + I): The sum of the irrigation water applied to the subjects and seasonal precipitation during the irrigation season, mm
Fertilization and weed control
Fertilization was applied according to soil analysis results. Ammonium sulphate fertilizer was used as nitrogen fertilizer, while IMI-tolerant Rekor CL variety was used to provide weed control in the study. The IMI technology was developed as a weed control option that allows the use of imidazolinone herbicides in the cultivation of plants. While conventional seeds are more susceptible to imidazolinone herbicides, IMI-tolerant hybrids have been modified to survive the action of this herbicide. 40 g/l herbicide with active ingredient imazamox was applied at a dose of 1.25 l/ha. Imazamox is effective in controlling weeds such as barn (Echinochloa crus-galli), damson grass (Diplachne fusca), pigeon's foot (Ammania coccinea) and pepper grass (Polygonum lapatifolium). In the trial, besides imazamox herbicide, Bentazone and MCPA active ingredient-containing herbicide were used in the control of broad-leaved weeds such as purslane.
Yield and yield components
Rice was harvested when 80% of the clusters took the colour of straw and the grains in the lower part reached the hard wax stage of maturity. From each plot, the grain yields were obtained by harvesting four replications of 1 m2 each. The grains were weighed with a 0.01 g precision balance, the moisture was measured, and the grain yields for plot and a unit of surface were calculated after the corrections according to the 14% moisture content. Thousand grain weight; 4 × 100 seeds randomly taken from each replication were weighed on precision scales and the mean of the obtained value was multiplied by 10. Number of clusters in m2; fertile clusters were counted in four repetitions in an area of 0.25 m2 randomly selected from each plot during the ripening period and the average was calculated. Number of grains per cluster (piece); the grains in a cluster taken from 25 randomly selected plants from each plot were counted and their averages were calculated. Milled efficiency; Hulled cargo (brown rice, means only husked grain) obtained from 100 g rice sample was processed into rice by passing through a yield machine. The husked rice weight was weighed on a 0.01 g precision scale and the per cent (%) milled efficiency was found. Fracture-free efficiency is the expression as % of the value obtained as a result of the separation of the broken grains from the milled yield.
Normalized difference vegetation index (NDVI) measurements
The Normalized Difference Vegetation Index (NDVI) during plant growth was measured with a Trimble label portable Green Seeker model instrument. Measurements were made with five repetitions for each repetition.
NDVI measurements: Plant growth levels and yields can be estimated using remotely sensed data. Spectral indices are effective tools for detecting plant growth and yield deficiencies caused by water stress, rather than directly determining water stress. Normalized Vegetation Difference Index during plant development period was measured with a Trimble brand portable GreenSeeker model instrument. Measurements were made with five repetitions in each replication at 15-day intervals. NDVI measurements were performed between 11:00 and 14:00 before irrigation and during the day when the stress was highest on days when the weather was cloudless and the wind speed was less than 2 m/s.
In this study, the relationship between the measurements made on the date that coincided with the flowering period, which was statistically significant and the correlation was highest in both years, and the yield values was examined.
Statistical analysis
Data was subjected to analysis of variance (ANOVA) based on the JMP Statistical software developed by SAS (SAS Institute, Inc., Cary, NC, USA). The Student's t test was carried out to compare control treatment with best performing drip treatments. The Least Square Deviation (LSD) test was used to compare the treatment means (Steel and Torrie, Reference Steel and Torrie1980).
Economic analysis
Variable costs consisted of labour, machinery, fertilizer, seed, pesticide costs, irrigation system annual maintenance and repair fee, and revolving fund interest and fixed costs consisted of general administrative expenses, land rent, irrigation equipment-machinery capital depreciation and interest, irrigation systems investment expenses depreciation and interest.
In the calculation of labour force, the daily wages given to the male and female workers in the region were taken and 3% of the total variable cost was considered as general administrative expenses. The revolving interest is a variable cost and it reflects the opportunity cost of capital for production activity. The revolving interest was calculated by subjecting half of the interest rate applied to the vegetable production loans by T.C. Ziraat Bank. Machinery interest was calculated by applying interest to half the value of the machinery. Machinery depreciation was taken as 10% of the total capital (Kıral et al., Reference Kıral, Kasnakoğlu, Tatlıdil, Fidan and Gündoğmuş1999).
The amount of product harvested was multiplied by the selling price of the product to obtain the gross production value. Gross profit was obtained by subtracting the variable costs from gross production value, and the net profit was obtained by subtracting the production costs from the gross production value (Açıl and Demirci, Reference Açıl and Demirci1984; Kıral et al., Reference Kıral, Kasnakoğlu, Tatlıdil, Fidan and Gündoğmuş1999).


The economic analysis was performed for the year of the experiment according to the prices in 2021. The prices and the costs change annually; therefore, the results of the economic analysis reflect the situation of the experiment year.
Results
Irrigation water amounts and water productivity (WP(P+I)-WP(I))
In the first and second experimental years of the study, sowing and harvesting operations were carried out on 15 May and on 27 September; and on 13 May and on 07 October, respectively. During the period when the soil moisture was kept close to saturated conditions from rice sowing until seed germination and reached about 10 cm height, 124 mm of equal irrigation water amount was applied to all experimental plots in 2019, and 172 mm of irrigation water in 2020. The amount of evaporation from the class A evaporation pan from the start of the irrigation applications to treatments until the last irrigation application was measured as 517 mm and irrigation water (equal + treatment application) totals of 641, 770 and 900 mm were applied to I1, I2 and I3 experimental plots, respectively, during the first year of the study. In a similar way, 797, 953 and 1110 mm of total irrigation amounts were applied to the drip irrigated plots, respectively, during the second year of the study, with 625 mm of measured evaporated total water. The total amount of irrigation water amounts established for drip irrigated sub-treatments was applied with 37 and 36 irrigation applications, during 2019 and 2020, respectively. However, 3800 and 3471 mm of seasonal irrigation water, respectively were required for rice culture grown under conditions of traditional flood irrigated plots during the first and second experimental years (Table 4).
Table 4. Irrigation water amounts and irrigation water productivity (WP) values for the experimental treatments
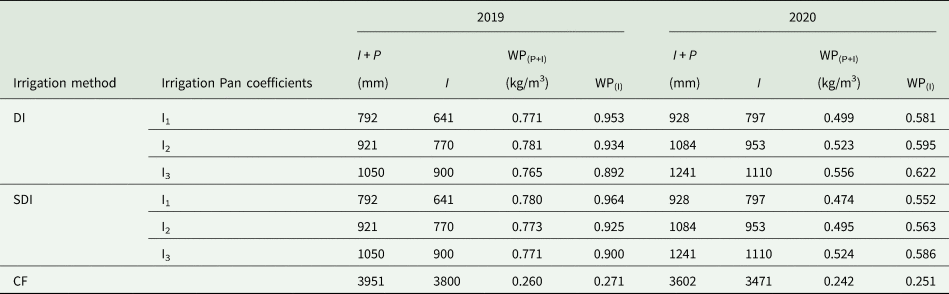
I, irrigation; P, precipitation; I + P: irrigation + rainfall; WP(I), Water productivity based on seasonal irrigation water amount applied to any treatment; WP(I+P), Water productivity based on the sum of irrigation water amount and seasonal precipitation rate; I1, Class A-pan evaporation rate × 1.00; I2, Class A-pan evaporation rate × 1.25; I3, Class A-pan evaporation rate × 1.50.
Irrigation WP values were between 0.765 and 0.781 kg/m3 in drip irrigation in 2019, v. the very low values of 0.260 kg/m3 WP (I+P) and 0.271 WP (I) under conventional (CF) irrigation. A similar situation occurred in 2020, when irrigation WP values under drip irrigation application ranged from 0.495 to 0.556 kg/m3, while much lower productivity values of 0.242 kg/m3 (WP(I+P)) and 0.251 kg/m3 WP(I) were obtained under conditions of CF.
Yield, irrigation water savings and yield losses
The findings related to rice grain losses as result of decreasing of irrigation water amounts are summarized in Table 5.
Table 5. Irrigation water savings and yield losses of rice under various irrigation techniques
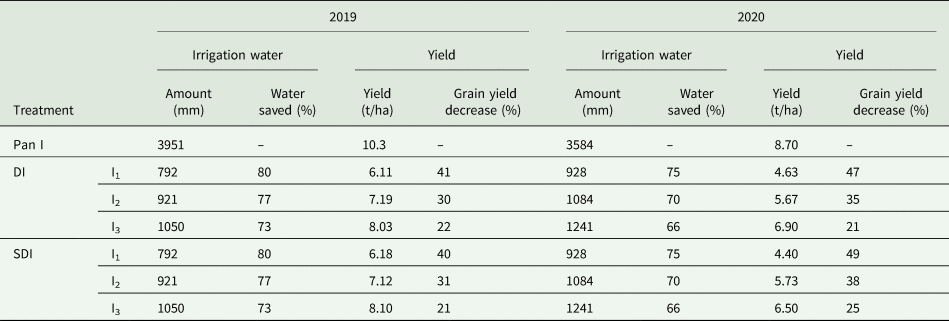
I1, Class A-pan evaporation rate × 1.00; I2, Class A-pan evaporation rate × 1.25; I3, Class A-pan evaporation rate × 1.50.
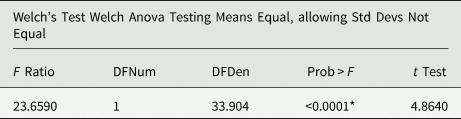
Statistical evaluations of the results for grain yields, obtained during two experimental years showed the prevailing effect of the climatic conditions during the study. According to the variance analysis results (Table 6), the years were not homogeneous (P < 0.01*). For this reason, the yields obtained in 2019 and 2020 were evaluated separately. On the other side, the statistical analyses, for any of the 2 years of experiment pointed out that rice grain yield was significantly (P < 0.01) affected by the amount of the irrigation water (pan evaporation × pan coefficient). No statistical evidence could be determined in terms of the main treatments involving surface or subsurface drip irrigation techniques. In the first year of the experiment (2019), a yield of 10.3 t/ha was obtained from CF irrigated plots, while the highest yield of 8.10 t/ha among the drip irrigation treatments was recorded for the SDI-I3 treatment, with application of the highest water amount based on 1.50 class A pan coefficient, implemented by subsurface drip system. As expected, the lowest grain yields of 6.11 and 6.18 t/ha were obtained under conditions of DI-I1 and SDI-I1 treatments, both comprising the lowest irrigation water amount, due to lowest pan coefficient. The grain yield obtained from the most yielding drip irrigated SDI-I3 treatment was used in the t test procedure with CF and the latest appeared as more yielding at (P < 0.01) significance level.
Table 6. Homogeneity test between years
Similar results as the first year were obtained during 2020 experimental year. The highest rice grain yield of 8.70 t/ha was obtained from the conventional flooding (CF) treatment. Among drip irrigation treatments, the highest grain amount of 6.90 t/ha was recorded for D1-I3, comprising the highest pan coefficient of 1.50 and surface drip irrigation. The lowest yield of 4.40 and 4.63 t/ha was observed under the least irrigation water amount, using subsurface (SDI-I1) and surface (DI-I1) drip systems, respectively. DI-I3 irrigation treatment with the highest yield in drip irrigation method applications and CF were subjected to t test and the difference between the two treatments was found statistically significant.
In general, the yield decrease observed in all the treatments during the second experimental year, probably appeared due to the air temperature drops, which coincided with the germination period and might have caused damage to the rice plant. It could be concluded that the chilling damage in 2020 led to a yield loss of 15–20% in all experimental plots, compared to 2019.
Comparison of the experimental results indicated that water savings up to 80, 77 and 73% and 75, 70 and 66%, were achieved owing to drip irrigation application with water amounts determined using pan coefficients of 1.00, 1.25 and 1.50, during the first and the second experimental years, respectively. Data related to grain yields harvested from drip irrigation application of water amounts based on p coefficients of 1.0, 1.25 and 1.50, using subsurface (SDI) and surface drip irrigation (DI) techniques in the study, testified for 41, 30 and 22% (DI) and 40, 31 and 21% (SDI) yield losses during the first trial year and 47, 35 and 21% and 49, 38 and 25% during the second year, respectively.
The CF application method, provided higher rice grain yields, than surface and subsurface drip irrigation, however WP is much higher in the case of drip systems, owing to much less irrigation water requirements. Water savings in the ranges of approximately 70 to 66% could be provided by drip irrigation application v. acceptable grain yield losses of around 21 to 30%.
Irrigation water amount-yield relations
The relationships between seasonal irrigation water (mm) applied and yields (t/ha) harvested from the treatments during the trial years are plotted on Fig. 2. Evaluation of the figure showed that polynomial relationships (second-order relations) existed between seasonal irrigation water amount and yield. In the first year of the study, R2 was 0.99 and the relationship was statistically proved at P = 0.0001** (P < 0.01) level; and in the second year, R2 was 0.99 and statistically P = 0.0004** (P < 0.01) significant. The same levels of significance were observed for the 2-year averages.
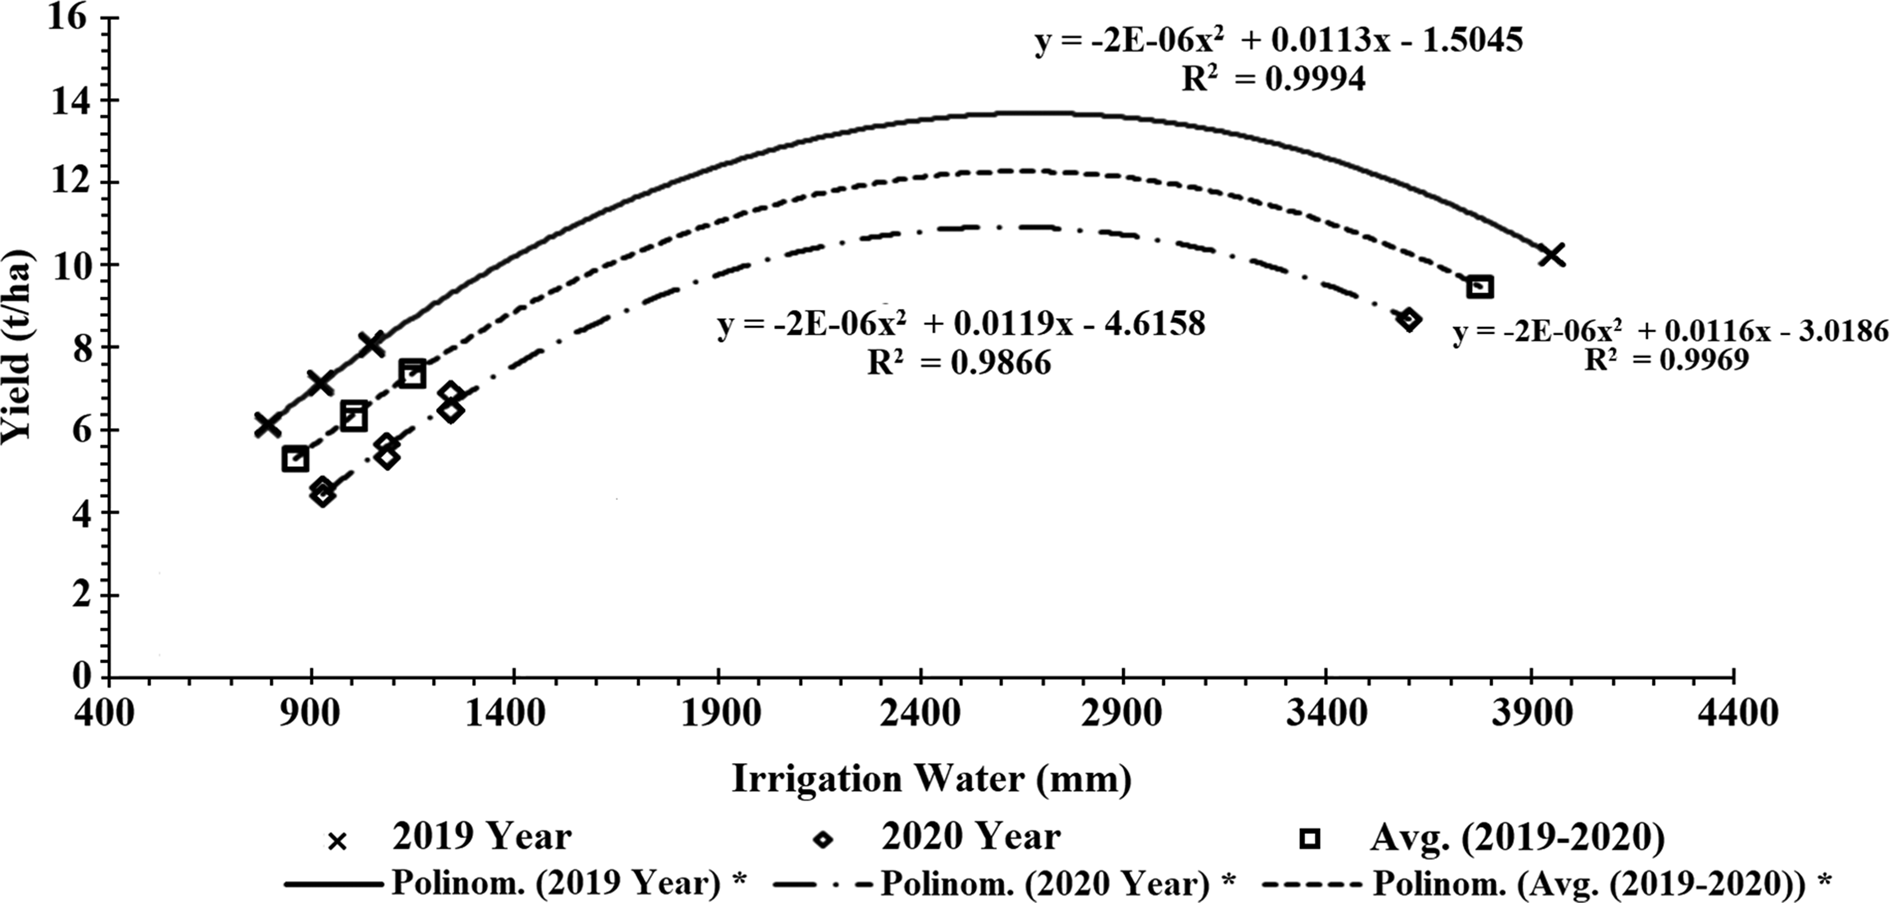
Figure 2. Seasonal irrigation water amount- yield relationship. *Polinom, Polynomial equation.
Normalized difference vegetation index (NDVI) – yield relationship
The relationship between the measurements was performed on the data. The correlation coefficient was found to be at the highest level (correlation coefficient 0.91 for 2019 and 0.94 for the year 2020) and the yield values were evaluated in both years (Fig. 3). The NDVI-yield relationship was obtained with the equation Y = 3343.3X-1588.3 (R2 = 0.82) in 2019 and Y = 1885.5X-565.3 (R2 = 0.88) in 2020. In the equations, X refers to NDVI values, Y refers to yield. The linear relationships between NDVI and yield were significant (P < 0.01). Different water applications affected NDVI and yield values in parallel direction, and NDVI measurements appeared to be an indicator in yield estimations. It allowed yield estimation with NDVI measurements to be made on the dates coinciding with the flowering period when the correlation was highest for the rice plant.
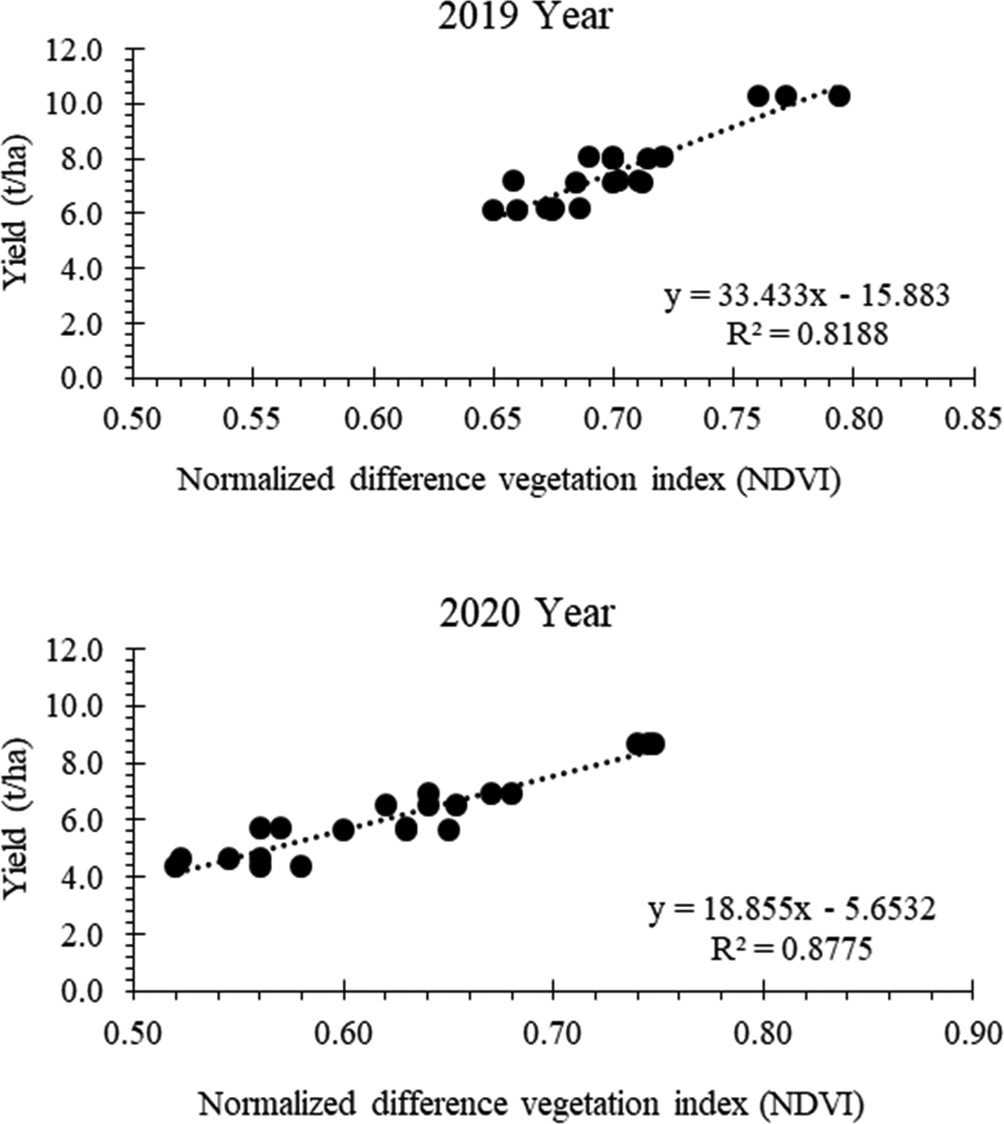
Figure 3. Normalized difference vegetation index (NDVI) – yield relationship.
Yield components
The thousand-grain weight values were found to be between 27.7 and 29.9 g in the treatments that were irrigated with the drip irrigation method in the first year. The highest thousand grain weight was recorded in experimental plots with applied highest pan coefficient of 1.50, under surface drip irrigation system (DI-I3), though the lowest values were recorded for the same coefficient, applied through subsurface irrigation system (SDI-I3). The average weight of thousand grains in the case of CF application was 31.1 g. In the same way, the thousand-grain weight under latest application was determined as 30.8 g, v. 27.2, 28.6 and 29.8 g for drip irrigated sub treatments using 1.0, 1.25 and 1.5 pan coefficients, respectively, during the second trial year. According to the ANOVA results (Table 7), the difference between surface and subsurface irrigation techniques in 2019 was insignificant. However, 99% confidence level was estimated among the three different irrigation coefficients, applied as sub-treatments of the investigation. On the other side, no statistical significance was found as result of the t test comparison between the sub-treatment DI-I3 which provided the highest weight from all drip irrigated plots and conventional flooded application. Similar results were obtained in 2020 (Table 8). While the statistical difference between the irrigation methods (main treatments) was not significant, the difference between the irrigation coefficients (sub-treatments) was statistically proven at P < 0.01 level. Though the result of t test applied on grain weights of drip irrigated DI-I3 and CF was found to be statistically insignificant.
Table 7. Statistical analysis results on grain yield, thousand grain weight, harvest index, number of clusters, number of grains in clusters, milled and head yield of rice under different treatments in the 2019 trial year
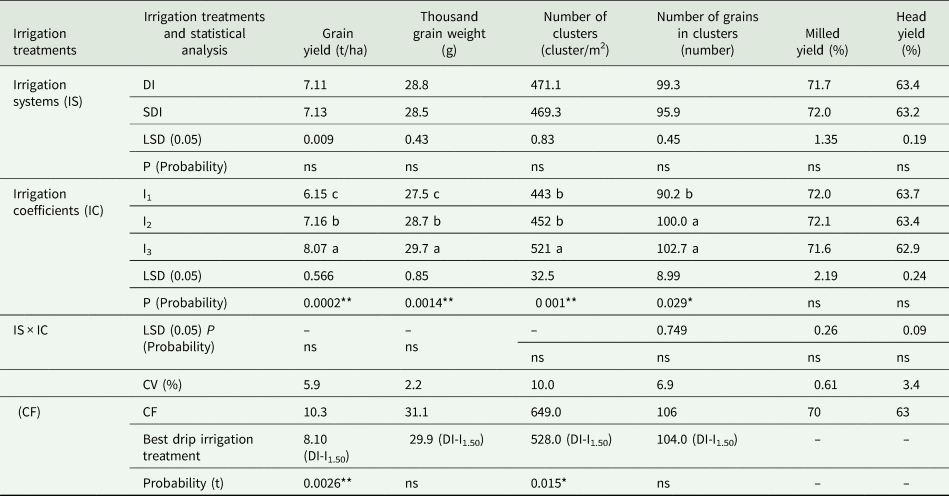
IS, irrigation systems; IC, irrigation coefficients; CV, coefficient variation; DI, drip irrigation; SDI, subsurface drip irrigation; CF, conventional flooding; values followed by different small letters (a, b and c) indicate significant differences at P < 0.01(** %1 significant level); P < 0.05 (* %5 significant level); P > 0.05 ns (not significant); I1, Class A-pan evaporation rate × 1.00; I2, Class A-pan evaporation rate × 1.25; I3, Class A-pan evaporation rate × 1.50.
Table 8. Statistical analysis results on grain yield, thousand grain weight, harvest index, number of clusters, number of grains in clusters, milled and head yield of rice under different treatments in the 2020 trial year
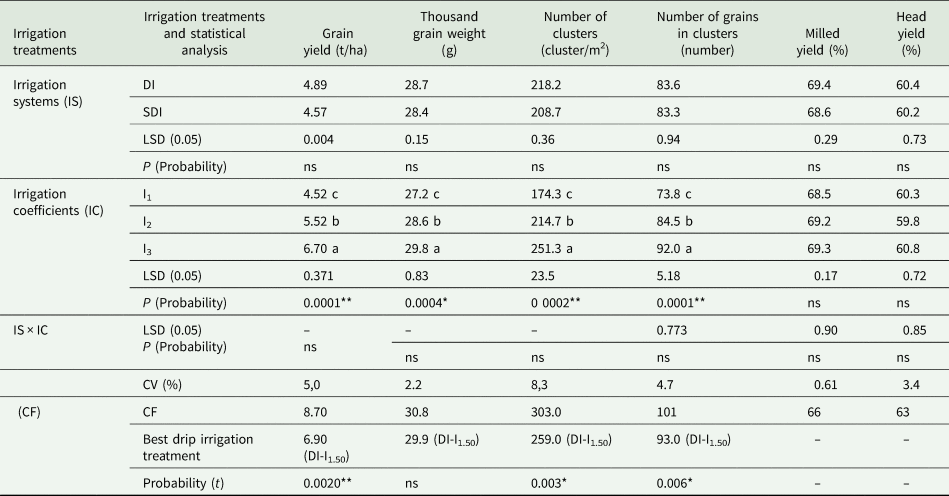
IS, irrigation systems; IC, irrigation coefficients; CV, coefficient variation; DI, drip irrigation; SDI, subsurface drip irrigation; CF, conventional flooding; values followed by different small letters (a, b and c) indicate significant differences at P < 0.01(** %1 significant level); P < 0.05 (* %5 significant level); P > 0.05 ns (not significant); I1, Class A-pan evaporation rate × 1.00; I2, Class A-pan evaporation rate × 1.25; I3, Class A-pan evaporation rate × 1.50
On the other hand, in our trials the number of grains in the cluster determined in the first year was higher than the number of grains determined in the second year. While the number of grains in the cluster in CF plots was determined as 106 in the first year, the figure of mentioned parameter was 101 in 2020. Similarly, the number of grains per cluster in drip irrigated plots was recorded the highest of 104 (DI-I3), and the lowest under SDI-I1 application, in the first year. However, the highest and the lowest numbers of 93 and 73 were recorded in DI-I3 and SDI-I1 sub-treatments, respectively, during the second experimental year (Table 7). According to the ANOVA results, no differences existed between DI surface and SDI subsurface drip irrigation methods in 2019, though the difference was statistically proven at P < 0.05 level among the sub-treatments or pan coefficients. No significant evidence was found as result of t test applied on the findings for grain number of DI-I3 and CF treatments. However no statistically significant differences were found between the two different drip irrigation methods, but the effect of irrigation water amounts (pan coefficients) was proven at 99% probability level in 2020. The t test applied to results recorded for DI-I3, and CF applications, showed the superiority of the latter at P < 0.01 level (Table 8).
In rice farming, high production efficiency is as important, as high grain yields per acreage. There are many parameters that affect the efficiency and yields such as certified seed, climate, fertilization, sowing frequency, blight and high air temperatures after flowering, differences between day and night temperatures during grain filling and dew drop. Head rice yield, which is obtained after drying the paddy and processing it into rice, is as important as the rice taken from the unit area. The abundance of solid grains in the rice product increases its market value. In this study, the effects of different irrigation methods and different irrigation water amounts applications on the milled and head yield values were also investigated. In the first year, the percentage of the milled yield under application of CF treatment was found as 70%, while it was slightly higher (71–72%) in drip irrigated rice. Similarly, the milled yield value of the former irrigation method was 66% v. those in the ranges of 68 to 72% estimated for drip irrigated plots, during the second year of the study (Tables 7 and 8).
Economic analysis
As a result of the economic analysis it was estimated that the costs such as levelling, labour, electricity, water, land rents were higher in CF application compared to drip irrigation applications. The sum of variable costs was found to be higher in CF application than in the DI and SDI applications. This was because the pan method had higher water and electricity costs and involved levelling. The relative profit was 1.66 in DI-I3 application, 1.59 in SDI-I3, 1.41 in CF, 1.46 in DI-I2, 1.39 in SDI-I2, 1.24 in DI-I1 and 1.20 in SDI-I1 applications. The relative profit of 1.41 obtained from the CF application was found to be lower, than the relative profit of 1.66 provided from surface drip irrigated with pan 1.50 coefficient application (DI-I3), 1.59 provided from subsurface drip irrigated with pan 1.50 coefficient application (SDI-I3) and 1.46 provided from surface drip irrigated with pan 1.25 coefficient application (DI-I2).
Discussion
The suitability of subsurface and surface drip irrigation methods for rice plant, which uses a lot of water in its cultivation with traditional irrigation method, was investigated. Irrigation applications were created with alternative sub-surface and surface drip irrigation methods in rice cultivation and it was revealed that with these applications, it was clear that more area could be irrigated with the saved water. Compared to conventional flood irrigation application, water savings of 66 and 73% were achieved by drip irrigation in this experiment. Similarly in previous research carried out in the region and abroad, it was reported that water savings of 50 to 75% were achieved compared to conventional flood irrigation method ( Dunn et al., Reference Dunn, Mathews, Beecher, Thompson and Humphreys2004; Mahajan et al., Reference Mahajan, Chauhan, Timsina, Singh and Singh2012; Tuna, Reference Tuna2012; Ramulu et al., Reference Ramulu, Rao, Devi, Kumar and Radhika2016; Özer, Reference Özer2019; Demirel et al., Reference Demirel, Çamoğlu, Tatar, Nar, Boran, Eroğlu and Genç2020).
Irrigation WP values, which are important parameters in terms of revealing different irrigation applications, were higher in drip irrigation applications compared to conventional flood irrigation application. Similarly in previous research carried out in the region and abroad by Beşer et al. (Reference Beşer, Sürek, Şahin, Kaya, Tuna and Çakır2016), Sharda et al. (Reference Sharda, Mahajan, Siag, Singh and Chauhan2017), Özer (Reference Özer2019), Çakır (Reference Çakır2020), Demirel et al. (Reference Demirel, Çamoğlu, Tatar, Nar, Boran, Eroğlu and Genç2020), it was determined that WP values were higher in drip irrigation applications.
In both years of the experiment, the yield amounts obtained from CF irrigated plots were higher than the yield amounts obtained from the drip irrigation treatments. Similarly in previous research, Özer (Reference Özer2019) carried out a research in the location of the study using a different rice cultivar and determined that higher grain yields were obtained from the conventional flooded plots v. drip irrigated treatment. Similar results were obtained by Tuna (Reference Tuna2012) reporting higher yield values of 8.14 t/ha in CF application v. 7.11 t/ha (pan coefficient 1.50) for drip irrigation with highest E pan coefficient of 1.50. Discussing the yields obtained from another field investigation conducted in Edirne province, Demirel et al. (Reference Demirel, Çamoğlu, Tatar, Nar, Boran, Eroğlu and Genç2020) also concluded that higher grain yields were reachable under flooding and flooding + water barrier application than drip irrigation application. Natarajan et al. (Reference Natarajan, Duraisamy, Thiyagarajan and Manikandan2020) applied three different pan coefficients under aerobic conditions in their studies and obtained the highest yield from pan coefficient 1.50 as 5.07 t/ha.
Unlike the results listed above, in field experiments carried out by Parthasarathi et al. (Reference Parthasarathi, Vanitha, Mohandass and Vered2018), the higher yields of 5.39 t/ha were provided by applications using the subsurface drip method v. a grain yield of 4.18 t/ha obtained from the flood treatment. Results of the investigations on application of different irrigation intervals performed by Borojeni and Salehi (Reference Borojeni and Salehi2013) in Iran, showed that the rice yield values varied between 5.66a and 3.42 t/ha. Kato and Katsura (Reference Kato and Katsura2014) reported more than 9 t/ha yield under aerobic conditions cultivation. Sarkar et al. (Reference Sarkar, Ghosh and Biswas2018) claimed that the highest yield of 3.1 t/ha rice grain was achievable from pan 0.8 coefficient application. Dunn et al. (Reference Dunn, Mathews, Beecher, Thompson and Humphreys2004) obtained 8.3 t/ha yield as a result of the application of surface drip irrigation method and stated that this yield amount was lower at the rate of 35% according to pan irrigation method.
The rice plant is the only plant that can grow under water or under saturated conditions throughout the irrigation season. In many studies, (Bayrak, Reference Bayrak1986; Dabney et al., Reference Dabney, Breitenbeck, Griffin and Hoff1989; Muirhead et al., Reference Muirhead, Blackwell, Humphreys and White1989; McCauley, Reference McCauley1990; Sürek et al., Reference Sürek, Aydın, Çakır, Karaata, Negis and Kuşku1996; Beşer, Reference Beşer1997; Çakır et al., Reference Çakır, Sürek, Aydın and Karaata1998a; Dunn et al., Reference Dunn, Mathews, Beecher, Thompson and Humphreys2004; Tuna, Reference Tuna2012; Khairi et al., Reference Khairi, Afifah, Jahan and Nozulaidi2015; Özer, Reference Özer2019; Demirel et al., Reference Demirel, Çamoğlu, Tatar, Nar, Boran, Eroğlu and Genç2020), it was determined that water constraint due to the irrigation methods (drip irrigation, sprinkler irrigation) in rice cultivation caused yield decreases. In other words, decreases in yield occurred as the applied water restriction increased. In contrast, Bansal et al. (Reference Bansal, Sharma, Soman, Singh, Bhardwaj, Pandiaraj and Bhardwaj2018), Rao et al. (Reference Rao, Gangwar, Keshri, Chourasia, Bajpai and Soni2017) and Sharda et al. (Reference Sharda, Mahajan, Siag, Singh and Chauhan2017) achieved higher yields in drip irrigation method applications compared to the traditional irrigation method.
Though as stated by Çakır et al. (Reference Çakır, Sürek, Aydın and Karaata1998b) in rice farming, the achieved yields were as important as water savings and the goal in rice farming should be achieving maximum water economy with minimum yield loss. In the study, when the yield values obtained in drip irrigation methods were compared with the conventional flood irrigation method, it was determined that yield losses occurred, but water savings were achieved. Similarly in previous research carried out in the region and abroad by Castaneda et al. (Reference Castaneda, Bouman, Peng and Visperas2002), Ottis et al. (Reference Ottis, Henggeler and Vories2006), Tuna (Reference Tuna2012), Beşer et al. (Reference Beşer, Sürek, Şahin, Kaya, Tuna and Çakır2016), Sharda et al. (Reference Sharda, Mahajan, Siag, Singh and Chauhan2017), Parthasarathi et al. (Reference Parthasarathi, Vanitha, Mohandass and Vered2018), Özer (Reference Özer2019) and Demirel et al. (Reference Demirel, Çamoğlu, Tatar, Nar, Boran, Eroğlu and Genç2020), it was determined that water savings against yield losses were achieved by drip irrigation methods.
NDVI measurements in the study were made at different growth stages of the plant. In many studies on rice plants, yield estimation and water stress determination studies were carried out using NDVI. In these studies, it was emphasized that highly correlated relations were obtained between the measured NDVI values and the yield (Sakamoto et al., Reference Sakamoto, Shibayama, Kimura and Takada2011; Zhou et al., Reference Zhou, Zheng, Xu, He, Ge, Yao, Cheng, Zhu, Cao and Tian2017; García Cárdenas et al., Reference García Cárdenas, Ramón Valencia, Alzate Velásquez and Palacios Gonzalez2018; Wang et al., Reference Wang, Wang, Zhang, Hu, Huang and Xie2019). According to the results, NDVI values can be considered for irrigation scheduling.
It could be concluded that a thousand seed grain weight decreased with decreasing water amounts applied to drip irrigated sub-treatments. The same situation was observed in earlier studies carried out with sprinkler or drip irrigation technique as alternatives of the CF (Dabney et al., Reference Dabney, Breitenbeck, Griffin and Hoff1989; Muirhead et al., Reference Muirhead, Blackwell, Humphreys and White1989; McCauley, Reference McCauley1990; Beşer, Reference Beşer1997; Çakır et al., Reference Çakır, Sürek, Aydın and Karaata1998a; Tuna, Reference Tuna2012; Özer, Reference Özer2019). Continuous irrigation caused an increase in the number of grains in the cluster in the investigations of Beşer et al. (Reference Beşer, Sürek, Şahin, Kaya, Tuna and Çakır2016). Demirel et al. (Reference Demirel, Çamoğlu, Tatar, Nar, Boran, Eroğlu and Genç2020) determined also the higher number (75) of grains per cluster under flooding, than those of 63 recorded for drip irrigated plants.
Results of the statistical analysis pointed out that, no statistically significant effect of the irrigation methods or Ep coefficients existed on these two parameters, during any of the years. This conclusion supported the view of Özer (Reference Özer2019), though according to Tuna (Reference Tuna2012), the yield values were higher in the cases when less water were applied. Other researchers (Beşer, Reference Beşer1997; Demirel et al., Reference Demirel, Çamoğlu, Tatar, Nar, Boran, Eroğlu and Genç2020) found that continuous flooding application caused a decrease in yield values.
The highest relative profit was provided by surface drip irrigated with pan 1.50 coefficient application (DI-I3). Economic analysis proved that production costs were higher in CF application than drip irrigated plots due to the high labour costs and large amounts of water used. Similar results were found by Bouman et al. (Reference Bouman, Xiaoguang, Huaqi, Zhiming, Junfang, Changgui and Bin2002), who reported a reduction of 55% in labour requirements for rice farming under aerobic conditions. Besides, it was determined that the income obtained from CF irrigation application was higher than the DI-I1 and SDI-I1 irrigation methods and almost the same as the SDI-I2 application. Similarly, in previous research carried out by Anusha et al. (Reference Anusha, Nagaraju, Sheshadri, Channabasavegowda, Shankar and Mallikarjuna2015), it was reported that net income in some drip irrigation applications was higher than in CF application, while in some drip irrigation applications it was lower. As the reduction in irrigation water caused partial reductions in yield, some decreases in net income occurred.
Conclusion
Evaluation of the results of 2-year field studies pointed out that aerobic rice production using surface and subsurface drip irrigation systems is effective, applicable and reliable, under farming conditions of Thrace Region of Türkiye. It could be concluded that it is possible to increase rice WP under limited water sources. Based on the results of the study, application of surface drip irrigation method and Class A Evaporation Pan coefficient of 1.5 could be recommended as more suitable for rice cultivation in the Thrace Region.
Authors’ contributions
UC, SO and OO conceived and designed the study and conducted data gathering. UC and BA performed statistical analyses. UC wrote and BA translated the article. RC reviewed and edited the study.
Financial support
The article contains data from the research project ‘Investigation of the Use of Subsurface and Surface Drip Irrigation Systems in Rice Cultivation in Thrace Conditions’ supported by the General Directorate of Agricultural Research and Policies and carried out at Atatürk Soil Water and Agricultural Meteorology Research Institute.
Conflict of interest
The authors declare that there are no conflicts of interest.
Ethical standards
Not applicable.


