


Introduction
Today's global food system has a major impact on the environment. It covers over 40% of the global ice and desert-free land, contributes to approximately 25% of anthropogenic greenhouse gas (GHG) emissions, causes one-third of terrestrial acidification and is responsible a significant share of global eutrophication (Poore and Nemecek, Reference Poore and Nemecek2018; Ramankutty et al., Reference Ramankutty, Mehrabi, Waha, Jarvis, Kremen, Herrero and Rieseberg2018). The livestock sector contributes significantly to these environmental impacts. The sector is responsible for about two-thirds of the food systems’ GHG emissions; occupies the majority of all global farmland either as feed or fodder and consumes over 30% of all cereals produced as animal feed (Gerber et al., Reference Gerber, Steinfeld, Henderson, Mottet, Opio, Dijkman, Falcucci and Tempio2013; Mottet et al., Reference Mottet, De Haan, Falcucci, Tempio, Opio and Gerber2017; Poore and Nemecek, Reference Poore and Nemecek2018). Livestock-related production contributes significantly to the crossing of some planetary boundaries and to the pressure on other planetary boundaries (Campbell et al., Reference Campbell, Beare, Bennett, Hall-Spencer, Ingram, Jaramillo, Ortiz, Ramankutty, Sayer and Shindell2017; Bowles et al., Reference Bowles, Alexander and Hadjikakou2019). Despite this substantial share of agriculture's environmental externalities, livestock only supply 25% of global human digestible protein (HDP) (Mottet et al., Reference Mottet, De Haan, Falcucci, Tempio, Opio and Gerber2017). It is clear that the livestock sector has a significant role in agriculture's impact on the environment and we could question if this is in proportion to its share of the food products provided.
If the current food consumption trends continues, the demand for food will increase by 70% over the next 30 years; to secure nutrition demands and bring food production within the planetary boundaries we need to change how we use our livestock systems (Alexandratos and Bruinsma, Reference Alexandratos and Bruinsma2012; Schader et al., Reference Schader, Muller, Scialabba, Hecht, Isensee, Erb, Smith, Makkar, Klocke, Leiber, Schwegler, Stolze and Niggli2015). Traditionally, livestock systems were used to create nutrient-rich food from low-opportunity cost biomass (LCB). Ruminants were traditionally used to create food from inedible fodder, whereas monogastrics were fed undesired by-products, such as the residues of potatoes or other types of food-waste (Naylor et al., Reference Naylor, Steinfeld, Falcon, Galloway, Smil, Bradford, Alder and Mooney2005; Wilkinson, Reference Wilkinson2011). Current livestock systems do not operate in the same way; instead livestock systems are increasingly reliant on feed crops grown on arable land (Mottet et al., Reference Mottet, De Haan, Falcucci, Tempio, Opio and Gerber2017). This engenders feed–food competition as arable land is diverted from crops to produce a lower amount of food from livestock production; reducing the global supply of food (Schader et al., Reference Schader, Muller, Scialabba, Hecht, Isensee, Erb, Smith, Makkar, Klocke, Leiber, Schwegler, Stolze and Niggli2015).
Circular agriculture is increasingly observed as a promising way of ensuring a sustainable future-food system (De Boer and van Ittersen, Reference De Boer and Van Ittersum2018). A core tenet of circular agriculture is to limit feed–food competition. This implies that arable land is used for the production of plant biomass for human consumption. Ruminants create nutritional value from grasslands, especially those that are only suitable for the production of forages of one form or another. Farm animals again up-cycle by-products from the production and consumption of plant-source foods into high-quality food (van Zanten et al., Reference Van Zanten, Mollenhorst, Klootwijk, Van Middelaar and De Boer2016). To assess whether a livestock system is engaged in feed–food competition and contributes to a circular food system, there is need to identify or develop accurate metrics to measure feed–food competition.
Several metrics have been developed to measure the net contribution of livestock to the supply of edible protein, such as the edible protein conversion ratio (EPCR) and the land-use ratio (LUR) (Wilkinson, Reference Wilkinson2011; van Zanten et al., Reference Van Zanten, Mollenhorst, Klootwijk, Van Middelaar and De Boer2016; Laisse et al., Reference Laisse, Baumont, Dusart, Gaudré, Rouillé, Benoit, Remond and Peyraud2019). The EPCR compares the amount of HDP in animal feed over the amount of HDP in the animal product (Wilkinson, Reference Wilkinson2011; Laisse et al., Reference Laisse, Baumont, Dusart, Gaudré, Rouillé, Benoit, Remond and Peyraud2019; Mosnier et al., Reference Mosnier, Jarousse, Madrange, Balouzat, Guillier, Prilo, Mertens, Oriordan, Pahmeyer and Hennart2021). The LUR compares the potential HDP from a crop grown on the land used to produce the livestock feed against the HDP in that livestock produce (van Zanten et al., Reference Van Zanten, Mollenhorst, Klootwijk, Van Middelaar and De Boer2016). Ertl et al. (Reference Ertl, Knaus and Zollitsch2016) clearly showed the necessity of including protein quality in the assessment of above-described metrics. Only a single study has used both metrics to assess the net contribution livestock to the human edible protein supply (van Zanten et al., Reference Van Zanten, Mollenhorst, Klootwijk, Van Middelaar and De Boer2016). This study did not consider the fact that the quality of animal-source protein for humans (i.e. amino acid profile) is generally higher than that of plant-based protein. To our knowledge, a consistent analysis of the net contribution of the main livestock systems to the HDP supply using both metrics, adapted for protein quality, is lacking. The aim of this study, therefore, was to assess the net contribution of the main livestock systems to the HDP supply. To this aim, we used Ireland as a case study.
Ireland serves as an interesting case study for three main reasons. First, Ireland's agriculture sector's emissions are dominated by livestock production; specifically, pasture-based ruminant systems (EPA, Reference Agency2018). Second, over 75% of current arable crops yields are used as animal feed, although this only meets 35% of national feed requirements with feed imported for use in its livestock systems (DAFM, 2018a). Third, the quality of the farmland varies; from land wholly suitable for arable crops to marginal grassland on organic peat soils (Gardiner et al., Reference Gardiner, Radford and Foras1980), with the vast majority of the land being not suitable for arable crops.
The three largest livestock sectors by value in Ireland are the ruminants of dairy and beef cattle systems and the monogastric pig system (Bía, Reference Bía2019). Here, we, therefore, assess the net contribution of these three Irish livestock systems to the net supply of HDP using refined EPCR and LUR in order to include protein quality. Results of this study demonstrate the net contribution of each livestock system to the net HDP supply, and hence their feed–food competition, and as such provides valuable information for future land-use strategies for policy makers.
Materials and methods
In the following sections, we describe or explain the three Irish livestock systems, the computations needed to determine the EPCR, and the computations needed to calculate the LUR. Finally, a sensitivity analysis performed to determine the effects of changing key parameters with high uncertainty is described.
Livestock systems
Dairy production in Ireland is pasture-based, and characterized by spring calving in order to balance pasture yields with feed demand. Replicating the boundaries used in van Zanten et al. (Reference Van Zanten, Mollenhorst, Klootwijk, Van Middelaar and De Boer2016), the dairy beef system includes the dairy cow, producing milk and the associated meat from slaughtered surplus calves and culled cow. It also includes the maintenance of the cow as a non-productive heifer. Table 1 shows the average, annual technical production and feed data required to determine EPCR and LUR for dairy beef livestock systems. These data were sourced from the National Farm Survey, an annual survey with representative samples of Ireland's agriculture sectors. The dominantly dairy breeds are Frisian and Jersey (DAFM, 2018b; O'Brien et al., Reference O'Brien, Moran and Shalloo2018; Donnellan et al., Reference Donnellan, Moran, Lennon and Dillon2020). Data about the rearing and fattening of dairy beef originated from Ashfield et al. (Reference Ashfield, Wallace, Prendiville and Crosson2014). Data about the mortality and live export of calves were sourced from the Department of Agriculture's animal identification and movement database (DAFM, 2018b). The replacement rate of the dairy herd was based on O'Brien et al. (Reference O'Brien, Moran and Shalloo2018). The dairy beef system produces 436 kg of milk solids from approximately 5500 litres/year; and after replacement and premature calf mortality produces 0.6 of a dairy beef calf annually.
Table 1. Protein produced and feed consumed (kg dry matter) by the livestock systems under study

a Protein digestibility-corrected amino acid score.
b Digestible indispensable amino acid score.
Suckler beef production is similar to dairy, being a pasture-based system with spring calving. In contrast to dairy production, where milk is the main product, the primary production of suckler beef production is the beef animal, that is reared and fattened over the 26 month period from birth to slaughter (Foley et al., Reference Foley, Crosson, Lovett, Boland, O'mara and Kenny2011). The required production data were sourced from a National Farm Survey of the suckler beef sector, and therefore reflects the average suckler beef system. Dominant breeds were Aberdeen Angus; Limousine, Hereford and Charolaise (DAFM, 2018b; Donnellan et al., Reference Donnellan, Moran, Lennon and Dillon2020). This study includes the calf fattened to slaughter, the maintenance of its dam while she is suckling the calf and a share of the dam as a non-productive heifer divided across the calves of her lifetime. Table 1 outlines the average, annual diet consumed by the suckler beef system, based on life cycle inventory data from Foley et al. (Reference Foley, Crosson, Lovett, Boland, O'mara and Kenny2011). The suckler beef cow system has a herd cull rate of 18% and annually produces 0.85 beef calf per suckler cow before replacement and mortality (Maher et al., Reference Maher, Good and More2008).
Unlike the two ruminant systems examined, pig production in Ireland is non-seasonal and predominantly reliant on imported human-edible feed (McAuliffe et al., Reference Mcauliffe, Chapman and Sage2016). Similar to the suckler beef system, the pig system's primary product is the meat from the fattened pig. The extent of the pig system is the single pig, the maintenance of its sow across her litters that year, and includes the sow's carcase and the period as non-performing gilt divided across the piglets she produces in her lifetime (Manzanilla et al., Reference Manzanilla, Carrol, Mccutcheon, Mckeon, Quinn, Mccrum, Clarke, Lawlor, Boyle and O'driscoll2018). Table 1 outlines the average, annual diet consumed by the pig system (Edgar Garcia Manzanilla, personal communications, Reference Manzanilla2019). Pig meat and reproduction data were sourced from the 2018 National Herd Performance Report (Manzanilla et al., Reference Manzanilla, Carrol, Mccutcheon, Mckeon, Quinn, Mccrum, Clarke, Lawlor, Boyle and O'driscoll2018). The sow is culled after 2 years of production, producing 26.25 live piglets annually.
Calculating EPCRs
For each livestock system, we determined the refined EPCR, as given in Eqn (1) (Wilkinson, Reference Wilkinson2011; Laisse et al., Reference Laisse, Baumont, Dusart, Gaudré, Rouillé, Benoit, Remond and Peyraud2019; Mosnier et al., Reference Mosnier, Jarousse, Madrange, Balouzat, Guillier, Prilo, Mertens, Oriordan, Pahmeyer and Hennart2021):

where HDPi is the amount of human-digestible protein corrected for quality in feed ingredient i used in the livestock system (i = 1, n). The HDP value of each feed ingredient was corrected for protein quality by multiplying the crude protein value of each product with a digestible indispensable amino acid score (DIAAS; see Table 2). The DIAAS score of a feed/food ingredient reflects the lowest score of the true illeal digestibility of 11 indispensable amino acids that are present in feed or food items (Rutherfurd et al., Reference Rutherfurd, Fanning, Miller and Moughan2015). Hence, the nominator is the sum of HDP in all feeds used in a livestock system, whereas the denominator is the sum of all HDP provided in the animal-sourced food (ASF). A ratio above 1 implies that animals eat more HDP than that they produce. A ratio below 1 does not automatically imply a net HDP contribution, as the EPCR does not include the fact that human-inedible biomass (e.g. grass or maize silage) can be produced on land suitable for human crop cultivation.
Table 2. Crude protein values, HEP and protein digestibility scores (DIAAS1 and PDCAAS2) of plant and animal products
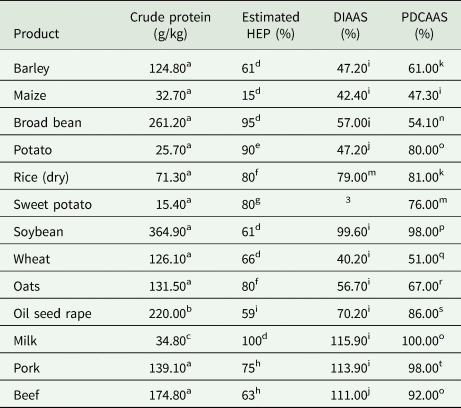
1 Digestible indispensable amino acid score.
2 Protein digestibility-corrected amino acid score.
3 Animal product includes human edible fractions of meat and carcase offal.
a (USDA, 2019), b(Balalic et al., Reference Balalic, Jeromela, Crnobarac, Terzić, Radic, Miklic and Jovičić2017), c(FAO, 2013), d(Laisse et al., Reference Laisse, Baumont, Dusart, Gaudré, Rouillé, Benoit, Remond and Peyraud2019), e(Camire et al., Reference Camire, Kubrow and Donnely2009), f(Wilkinson, Reference Wilkinson2011), g(CAST, Reference Bradford, Baldwin, Blackburn, Cassman, Crosson, Delgado, Fadel, Fitzhugh, Gill, Oltjen and Vavra1999) h(Ockerman and Hansen Reference Ockerman and Hansen1988) i(Ertl et al., Reference Ertl, Knaus and Zollitsch2016), j(Wolfe et al., Reference Wolfe, Baum, Starck and Moughan2018) k(Nitrayová et al., Reference Nitrayová, Brestenský and Patráš2018) l(Hodgkinson et al., Reference Hodgkinson, Montoya, Scholten, Rutherfurd and Moughan2018), m(Ertl et al., Reference Ertl, Knaus and Zollitsch2016), n(Nosworthy et al., Reference Nosworthy, Medina, Franczyk, Neufeld, Appah, Utioh, Frohlich and House2018), o(van Zanten et al., Reference Van Zanten, Mollenhorst, Klootwijk, Van Middelaar and De Boer2016), p(Phillips, Reference Phillips2016), q(Schaafsma, Reference Schaafsma2005), r(Rutherfurd et al., Reference Rutherfurd, Fanning, Miller and Moughan2015), s(Poisson et al., Reference Poisson, Trouverie, Brunel-Muguet, Akmouche, Pontet, Pinochet and Avice2019) and t(FDA, Reference Administration1993).
Calculating the LUR
The LUR as given in Eqn (2) compares the potential HDP from crops grown on land used to produce the livestock feed against the HDP in the livestock produce (van Zanten et al., Reference Van Zanten, Mollenhorst, Klootwijk, Van Middelaar and De Boer2016). To calculate the LUR, the methodology used by van Zanten et al. (Reference Van Zanten, Mollenhorst, Klootwijk, Van Middelaar and De Boer2016) was adopted to also include protein quality:

where LOij is the land area occupied for a year (in m2), to cultivate the amount of feed ingredient i (i = 1, n) in the countries of origin j (j = 1, m) that are needed to produce 1 kg of HDP ASF; HDPj is the maximum amount for human-edible protein corrected for protein quality (using DIAAS) that could by produced per year on area j. We enhanced the LUR of van Zanten et al. (Reference Van Zanten, Mollenhorst, Klootwijk, Van Middelaar and De Boer2016) by determining this HDP for sustainable crop rotations instead of single crops (see later). The numerator of this ratio is the amount of HDP that potentially could be produced from the land area used to produce all feed for the animal, whereas the denominator contains the amount of HDP of 1 kg ASF similar to EPCR, therefore, the LUR is a single value. A ratio <1.0 demonstrates that livestock produce more HDP than crops, and could have a positive role in future HDP supply. We calculated the LUR for our three livestock systems in four steps, see below.
Quantifying land area for livestock feed
To quantify the area of agricultural land used for feed crops; we first needed to determine the country of origin of all feed ingredients. Feed import data from the Central Statistics Office of Ireland (CSO) provide the quantity and country of origin of the animal feed imported and outlines the quantity of feed grown (CSO, 2019). Second, we used the Global Agro-Ecological Zones (GAEZ) tool to verify the country of origin for each feed ingredient (FAO and IIASA, 2019). If GAEZ showed that a country is unsuitable to grow that specific feed ingredient, we redistributed the feed origin proportionally among the other countries that also cultivate that feed. Third, we used yield data from the FAO's corporate statistical database (FAOSTAT) to quantify the land area associated with the feed used in each country by a livestock system (FAO, 2019). As a single-feed ingredient is rarely the sole driver of land-use, economic allocation was used to allocate the area of the crop land (e.g. oil seed rape) used among its different outputs (e.g. rapeseed meal used as feed and oil used as food). We used the Wageningen tool FeedPrint for its economic allocation function (Vellinga and Blonk, Reference Vellinga and Blonk2019).
To calculate the area of pasture used, we used information provided by Teagasc's Pasturebase Ireland tool, which is used to record grass growth at a paddock level (Hanrahan et al., Reference Hanrahan, Geoghegan, O'donovan, Griffith, Ruelle, Wallace and Shalloo2017). This tool provides pasture production data from across Ireland, sourced from self-reported pasture productivity by farmers (Bogue, Reference Bogue2019). This allowed us to calculate a weighed value of average grass utilization rate of 8.4 tonnes of dry matter grass per hectare of pasture, which corresponds to previous studies (Hanrahan et al., Reference Hanrahan, Mchugh, Hennessy, Moran, Kearney, Wallace and Shalloo2018).
Determining suitability of land for human food crop cultivation
To calculate the area of pasture suitable for arable crops, we used an assessment of the soils of Ireland conducted by An Foras Talúntais in 1980 (Gardiner et al., Reference Gardiner, Radford and Foras1980). This study outlined the proportion of all agricultural land suitable for crop production. Data from the CSO's Census of Agriculture provided the current area of arable crop and pasture. The land area currently under crop was subtracted from the total agriculture land, providing the area currently under pasture that is suitable for arable cropping (DAFM, 2016).
We assumed that all land that was used to cultivate feed crops was also suitable for food crops. The suitability of land associated with feed originating from Ireland was estimated for barley, oats, wheat, broad bean and oil seed rape, as these crops are commonly grown in Ireland (Askari and Holden, Reference Askari and Holden2015). The suitability of the land associated with imported feed was estimated for eight common global food crops i.e. barley, oats, sweet potato, sorghum, maize, potato, wheat and rice, and three protein crops (high-protein yield), i.e. broad bean, oil seed rape and soybean (van Zanten et al., Reference Van Zanten, Mollenhorst, Klootwijk, Van Middelaar and De Boer2016; DAFM, 2018a). The GAEZ tool was used to verify whether the potential crops are capable to grow in the country studied (FAO and IIASA, 2019).
Calculating human digestible production from land suitable for crop production
We adapted the approach of van Zanten et al. (Reference Van Zanten, Mollenhorst, Klootwijk, Van Middelaar and De Boer2016) to estimate the HDP from suitable land in Ireland, i.e. grassland and arable land. Unlike van Zanten, who determined HPD for single crops, we determined HDP for specific crop rotations to ensure soil quality over time. Using a previous study of sustainable soil management and crop rotations, we defined five feasible sustainable crop rotations for Ireland, see Table 3 (Askari and Holden, Reference Askari and Holden2015). We then choose the crop rotation with the highest HDP.
Table 3. LUR crop rotations

a DIAAS is preferred baseline study.
To estimate the HDP from suitable land suitable outside Ireland, we first determined HDP yields of all eight global crops and three protein crops, and then averaged the HDP of the highest scoring global crop and the highest scoring protein crop.
To calculate HDP for each crop, we first derived the crop yield from the area of land used using yield data from FAOSTAT and the CSO yields (CSO, 2019; FAO, 2019). Subsequently, we multiplied the crop by its human edible portion (HEP) value to find the quantity suitable as food (Camire et al., Reference Camire, Kubrow and Donnely2009; Wilkinson Reference Wilkinson2011; Laisse et al., Reference Laisse, Baumont, Dusart, Gaudré, Rouillé, Benoit, Remond and Peyraud2019). We then multiplied the yield by the crude protein content of each crop using values from the United States Department of Agriculture's (USDA) Food Data Central Nutritional Database (USDA, 2019). Finally, we calculated the HDP available from the crop yield by multiplying it by a DIAAS score outlined in Table 2 (Consultation, Reference Consultation2011).
Calculating the human digestible production from the livestock
The amount of HDP in ASF was computed by multiplying the amount of livestock products by its HEP, which includes the offal from the carcase in Table 2. Then the crude protein values of the livestock products derived from the USDA Food Data Central Nutritional Database, by their DIAAS value in Table 2 (USDA, 2019).
Sensitivity analysis
Effect of protein quality
Besides DIAAS, the protein digestibility-corrected amino acid score (PDCAAS) is also often used to account for protein quality in food products. Before 2013, the FAO recommended to use the PDCAAS system. In 2013, the FAO changed its endorsement to the DIAAS system as it is considered more representative of true digestibility (FAO, 2013). It assesses true ilieal amino acid digestibility of each indispensable amino acid, compared to the PDCAAS which only corrects for true faecal nitrogen digestibility (Rutherfurd et al., Reference Rutherfurd, Fanning, Miller and Moughan2015). The PDCAAS methodology has been shown to disproportionally overestimate the digestibility of crop-sourced protein compared to animal-sourced protein (Ertl et al., Reference Ertl, Knaus and Zollitsch2016). To demonstrate the effect of the choice of protein quality scoring system used, we also computed our results using PDCAAS instead of DIAAS scores. The PDCAAS scores used for both crop and livestock products are outlined in Table 2.
Effect of pasture suitability for arable cropping
In the baseline situation, we assumed that the pasture suitability for arable crop production was 31%, using data on land-use suitability and current crop area (Gardiner et al., Reference Gardiner, Radford and Foras1980; DAFM, 2011). This assumption affects the level of feed–food competition in ruminant systems. To determine the impact of this assumption on our results, we also calculated the LUR of the livestock production from pasture 100% suitable for arable crops against land completely unsuitable for arable crops (0%), with intervals of 10%.
Effect of crop rotations
In the baseline situation, we estimated HDP from land suitable for crop production using an average of the five different crop rotations (Askari and Holden, Reference Askari and Holden2015). To determine the impact of this assumption on LUR, we also computed HDP using the individual rotations. These rotations and their LUR values are outlined in Table 3 which allows for the comparison of differing crop rotations’ LUR value.
Results
Edible protein conversion ratio
Table 4 outlines the EPCR values of the three livestock systems examined. Both ruminant systems have by a lower than 1 EPCR value and thus create more HDP than they consume. Dairy beef's EPCR of 0.22 implies that 0.22 kg of crop-sourced HDP is consumed to produce 1 kg of animal-sourced HDP. Similarly, the EPCR of the suckler beef system is 0.29, which demonstrates that a suckler beef system consumes 0.29 kg of crop-sourced HDP to produce 1 kg of animal-sourced HDP. In contrast to the two feed-use efficient ruminant systems, the EPCR for the monogastric pig system is greater than 1. It's EPCR value of 1.51 shows that 1.51 kg of crop-sourced HDP is needed to produce 1 kg of animal-sourced HDP.
Table 4. EPCR and LUR of Ireland's three livestock systems, based on two protein digestibility scores (DIAAS and PDCAAS)

Land use ratio
Table 3 demonstrates the LUR of three livestock systems; it includes each sustainable rotation for each livestock system and an average of the five sustainable crop rotations on the land used.
The average LUR of the dairy beef system is 0.58. This demonstrates that the land required to produce 1 kg of HDP from dairy beef production (milk and associated meat) could yield directly 0.58 kg of HDP from sustainable crop rotations. Unlike for dairy beef, the LUR for the suckler beef and pig system are larger than 1 (i.e. 1.34 for beef; 1.73 for pigs), implying that the land required to produce 1 kg of HDP from suckler beef or pigs could yield directly more HDP from sustainable crop rotations.
Sensitivity analysis
Effect of protein quality
As observed in Table 4, EPCR values based on DIAAS are lower than EPCR values on PDCAAS scores, implying that they value HDP from animal-source food relatively better. Similarly, LUR values based on DIAAS value livestock systems as more land efficient than LUR values based on PDCAAS (see Table 2). For example, the LUR in the dairy beef system scores changes from 0.78 in the PDCAAS score to 0.58 using the DIAAS methodology. Compared to the PDCAAS column, the DIAAS column has a higher digestibility value for animal protein and has lower values for the digestibility of plant protein (Table 2).
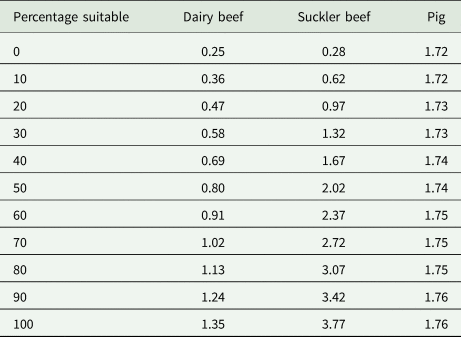
Effect of pasture suitability for arable cropping
Table 5 demonstrates that when the pasture of the ruminant system grazes is 0% suitable for arable crop production, dairy beef and suckler beef systems’ LUR are 0.25 and 0.28, respectively. When both ruminant systems are confined to marginal pasture then they are land-use efficient, the remaining feed–food competition comes from the arable land used for feed. In contrast in Table 5 where the ruminant systems are sourcing their grass from land that is 100% suitable for arable crop production, the LUR value of dairy beef becomes 1.35 and of suckler beef systems 3.77. Therefore, if the current ruminant systems are sourcing their grass from pasture that is 100% suitable for arable crop production, both livestock systems are land-use inefficient and are net losses to the supply of HDP.
In the baseline study as observed in Table 4, we observe that with 31% of pasture suitable for crop production, the dairy beef system is land-use efficient. It takes an increase in pasture suitability to 68% before the dairy beef system's LUR rises to 1. In regards to the suckler beef system, arable pasture needs to decrease to 21% before an LUR below 1 is achieved. The only change in the pig system comes from the piglet feeds which contain dairy products (e.g. whey); the rest of its feed already originates from arable crop production and its land is already fully engaged in feed–food competition with humans. Being a monogastric system reliant on human edible product for food, no change in pasture suitability will change the pig production system to an LUR of 1.
Effect of crop rotations
When we consider an LUR based on one crop rotation instead of the collective average (see Table 3), it is clear that the highest HDP yielding crop rotation is the wheat and broad-bean crop rotation. The LUR for the dairy beef, suckler beef and pig systems is 0.66, 1.56 and 1.80, respectively. The lowest HDP yielding crop rotation is the wheat and potato crop rotation. The LUR for the dairy beef, suckler beef and pig systems is 0.47, 1.02 and 1.64, respectively.
Discussion
This study aimed to determine the net contribution of three Irish livestock systems to the human edible protein supply, by quantifying enhanced EPCRs and LURs. We, therefore, first discuss the potential of the enhanced metrics to determine the net contribution of livestock systems to human protein supply and subsequently evaluate results and their implications for the development of future-food systems.
Potential of enhanced metrics
Our EPCR results indicate that ruminant systems reliant on pasture, especially dairy systems, are more feed-use efficient and positive HDP producers compared to the monogastric concentrate fed pig system. These results confirm the finding of others, such as Wilkinson (Reference Wilkinson2011), van Zanten et al. (Reference Vellinga and Blonk2016), Laisse et al. (Reference Laisse, Baumont, Veysset, Benoit, Madrange and Peyraud2018), Laisse et al. (Reference Laisse, Baumont, Dusart, Gaudré, Rouillé, Benoit, Remond and Peyraud2019) and Mosnier et al. (Reference Mosnier, Jarousse, Madrange, Balouzat, Guillier, Prilo, Mertens, Oriordan, Pahmeyer and Hennart2021). They also demonstrated that cattle fed with inedible fodder are efficient producers of ASF (Wilkinson, Reference Wilkinson2011; van Zanten et al., Reference Van Zanten, Mollenhorst, Klootwijk, Van Middelaar and De Boer2016; Laisse et al., Reference Laisse, Baumont, Veysset, Benoit, Madrange and Peyraud2018; Mosnier et al., Reference Mosnier, Jarousse, Madrange, Balouzat, Guillier, Prilo, Mertens, Oriordan, Pahmeyer and Hennart2021). Wilkinson. (Reference Wilkinson2011) Laisse et al. (Reference Laisse, Baumont, Dusart, Gaudré, Rouillé, Benoit, Remond and Peyraud2019) and Mosnier et al. (Reference Mosnier, Jarousse, Madrange, Balouzat, Guillier, Prilo, Mertens, Oriordan, Pahmeyer and Hennart2021), for example, compared pasture-based cattle systems with concentrate-based cattle systems and concluded that unlike pasture-based cattle, concentrate-based cattle are inefficient protein producers. Their results on monogastric pigs also correspond to ours whereby, pig systems fed with HDP intense grains are demonstrated to be inefficient HDP producers (Wilkinson, Reference Wilkinson2011). Consequently, we can observe that the EPCR methodology endorses feeding livestock with human inedible products and therefore favours the position of placing cattle on fodder as an efficient use of land.
The methodology of the EPCR, however, fails to account for the potential of the land used to produce food crops for humans directly. In other words, it does not account for the potential alternative land-use in which the feed and fodder crops used, replaces human edible crops. Consequently, the EPCR cannot accurately reflect whether livestock production systems are potentially net producers of food (van Zanten et al., Reference Van Zanten, Mollenhorst, Klootwijk, Van Middelaar and De Boer2016).
Our results from the LUR show that using the EPCR metric to advise how to optimize food production may lead to incorrect recommendations for land-use and land-use change. When we compare the EPCR of the three livestock systems in Table 4 with their LUR values, we observe substantial differences in the livestock systems efficiency values and their efficiency rankings. According to the LUR, the dairy beef and suckler beef systems are significantly less efficient than their EPCR values suggest. This is especially apparent with suckler beef being considered by the EPCR to be feed-use efficient, while considered to be land-use inefficient when applying the LUR. Our results confirm the findings of van Zanten et al. (Reference Van Zanten, Mollenhorst, Klootwijk, Van Middelaar and De Boer2016) who demonstrated a dairy-beef system which is feed-use efficient, i.e. EPCR <1, but land-use inefficient, i.e. LUR >1 (van Zanten et al., Reference Van Zanten, Mollenhorst, Klootwijk, Van Middelaar and De Boer2016). Hence, we cannot consider the EPCR alone to be a suitable metric for developing future-food systems.
The LUR appears the most inclusive metric to understand the net contribution of livestock systems to the human protein supply. We enhanced the LUR by including protein quality and crop rotations. When considering which digestibility score should be used to include protein quality, the ramifications of the choice can have significant impacts. The DIAAS methodology more accurately outlines the dietary uptake of HDP as it calculates digestibility at the end of the small intestine which better reflects the true amount of amino acids absorbed. The PDCAAS instead represents the uptake of protein from a faecal sample which then includes all gut micro flora activities, which affects its accuracy (FAO, 2013). This is why the PDCAAS methodology considers crop-sourced protein to have a higher digestibility value than it may truly have. Consequently, comparing crop-sourced and animal-sourced HDP using PDCAAS would be inaccurate as it does not compare the true amount of amino acids absorbed (Ertl et al., Reference Ertl, Knaus and Zollitsch2016). As observed in Table 2 the PDCAAS value for potatoes of 80% declines to 47% with DIAAS compared to milk which remains fully digestible. Our results demonstrate that the PDCAAS scores skew results to crop-sourced protein. Further to this, the inaccuracies altered the recommended alternative crops, providing incorrect land use recommendations. Hence, the DIAAS system is preferable as when we are meeting future dietary demands and the ability for future-food systems to meet demand, accurate metrics are needed to ensure demand can be met efficiently.
We, moreover, were the first to consider crop rotations in the LUR. Van Zanten et al. (Reference Van Zanten, Mollenhorst, Klootwijk, Van Middelaar and De Boer2016) used a single crop, either wheat or potatoes (see Table 6) which are not usually included in the human diet for their protein content but are common crops cultivated in the Netherlands (FAO and IIASA, 2019). However, mono-cropping can lead to soil exhaustion and may reduce soil productivity (Askari and Holden, Reference Askari and Holden2015). Our results showed that accounting for crop rotations reduced the LUR value of about 30% in the dairy beef system compared to the single highest HDP yielding crop as done in earlier LUR studies. Crop rotations are not only relevant to maintain soil quality, but to also provide a diverse set of food to fulfil nutrition requirements (Willett et al., Reference Willett, Rockström, Loken, Springmann, Lang, Vermeulen, Garnett, Tilman, Declerck, Wood, Jonell, Clark, Gordon, Fanzo, Hawkes, Zurayk, Rivera, De vries, Majele Sibanda, Afshin, Chaudhary, Herrero, Agustina, Branca, Lartey, Fan, Crona, Fox, Bignet, Troell, Lindahl, Singh, Cornell, Srinath Reddy, Narain, Nishtar and Murray2019). Hence, we argue that the use of a crop rotation that does not exhaust the soil but includes protein intensive crops with the aim to deliberately replace the livestock HDP is an important innovation of the LUR.
Table 6. Alternative LUR calculated with differing methodologies

a (van Zanten et al., Reference Van Zanten, Mollenhorst, Klootwijk, Van Middelaar and De Boer2016) Dairy beef on peat soils replaced with potatoes, (van Zanten et al., Reference Van Zanten, Mollenhorst, Klootwijk, Van Middelaar and De Boer2016) dairy beef on arable spoils replaced with wheat, c(van Zanten et al., Reference Van Zanten, Mollenhorst, Klootwijk, Van Middelaar and De Boer2016) laying hen system, d(van Hal et al., Reference Van Hal, Weijenberg, De Boer and Van Zanten2019) laying hen with economic allocation, e(van Hal et al., Reference Van Hal, Weijenberg, De Boer and Van Zanten2019) laying hens optimized to limit feed–food competition with economic allocation, f(van Hal et al., Reference Van Hal, Weijenberg, De Boer and Van Zanten2019) laying hens with food-based allocation, g(Tichenor et al., Reference Tichenor, Van Zanten, De Boer, Peters, Mccarthy and Griffin2017) including protein crops mainly soybean as the alternative crop.
Implications for future-food systems
It is clear in our baseline study of Ireland that as it exists currently the dairy beef system is land-use efficient unlike its suckler beef counterpart. The results show that when the ruminant systems are on marginal pasture wholly unsuitable for arable crops; the feed–food competition between crops and livestock only occurs on the land used for cultivating livestock's concentrate feed (see Table 5). In that scenario, the dairy beef and suckler beef system's LUR values are 0.25 and 0.28, respectively. In the scenario where pasture is wholly suitable for arable crop production it is clear that the ruminant system's LUR changes from being land-use efficient to being land-use inefficient. This demonstrates that both ruminant systems when sourcing its pasture from marginal land are net producers of HDP, although the dairy beef system is a more efficient use of pasture.
It could be argued that the role for livestock in Ireland's future-food system is confining them to marginal land which in Ireland can be highly productive pasture due to the favourable soils and climate (Hanrahan et al., Reference Hanrahan, Geoghegan, O'donovan, Griffith, Ruelle, Wallace and Shalloo2017). This can minimize feed–food competition and maximize food production from Ireland's agricultural land. Furthermore, when considering the agriculture sector in Ireland from a feed–food competition perspective, the trend of land-use change from arable production to pasture increases the average LUR (CSO, 2020). One could even argue from a feed–food perspective that pasture on arable land should be converted to arable crops. If this arable land is instead used in the crop rotations used in this study; then more HDP could be produced with some potential for livestock feed from LCB. This could significantly increase the amount of HDP produced in Ireland. However, one should not forget that such a land-use change results in the GHG emissions and biodiversity loss and based on the most recent National Farm Survey Results would result in reduced farm profitability on average (Taube et al., Reference Taube, Gierus, Hermann, Loges and Schönbach2014; Donnellan et al., Reference Donnellan, Moran, Lennon and Dillon2020).
When considering Ireland's pig system that is land-use inefficient, it could be argued that if the pig system is reliant on LCB then the LUR values should decrease as the land area needed for feed production would decline. This has been studied in Zu Ermgassen et al. (Reference Zu Ermgassen, Phalan, Green and Balmford2016) who has demonstrated that including food-waste in a pig's diet can reduce the area of arable land needed as feed by about one-fifth (Zu Ermgassen et al., Reference Zu Ermgassen, Phalan, Green and Balmford2016). Hence, opportunity exists to modify a monogastric system towards land-use efficiency.
This argument applies to our ruminant system's LUR; there is an option to limit its feed to marginal pasture and LCB which could increase its land-use efficiency. Van Zanten et al. (Reference Van Zanten, Mollenhorst, Klootwijk, Van Middelaar and De Boer2016) calculated that if we feed livestock only with leftover streams and grass we could produce about a third of our daily dietary protein requirements (van Zanten et al., Reference Van Zanten, Mollenhorst, Klootwijk, Van Middelaar and De Boer2016). Considering that currently Ireland is a net exporter of ASF, limiting livestock production to LCB would mean a reduction of protein produced and exported.
Finally, Godfray (Reference Godfray2015) argued that although livestock numbers need to be reduced globally, they should be increased where they are most efficient to maximize food production efficiency. Future-food demands cannot be met with land extensification but can be met from land-use optimization (Schader et al., Reference Schader, Muller, Scialabba, Hecht, Isensee, Erb, Smith, Makkar, Klocke, Leiber, Schwegler, Stolze and Niggli2015). The LUR could allow policy makers to choose which livestock system to use and where it should be placed on the future landscape. It could be used to calculate where it is most efficient to place livestock for the global future-food systems. However, as pointed out by Mosnier et al. (Reference Mosnier, Jarousse, Madrange, Balouzat, Guillier, Prilo, Mertens, Oriordan, Pahmeyer and Hennart2021), land-efficient grass-based ruminant systems not only contribute to food supply, but can also deliver other ecosystem services, such as nutrient cycling, carbon sequestration or biodiversity conservation. Hence, if the LUR is utilized with other metrics that quantify nutrient flows and GHG emissions in a multi-criteria framework; then, it could be used as a more holistic tool for planning optimal future-food systems within planetary boundaries at regional, national and global levels.
Conclusion
The enhanced LUR appears the most inclusive metric as it addresses both feed-use and land-use efficiency. It, however, requires knowledge on the suitability of land for arable production, crop rotation and pasture yields, and protein evaluation scoring systems. The enhanced LUR appeared 0.58 for dairy beef, 1.34 for suckler beef and 1.73 for pig production in Ireland. Therefore, the dairy beef system is the most efficient livestock system examined and the only livestock system that is a net positive contributor to the global supply of HDP as it currently exists and on marginal land is still significantly more efficient than suckler beef production.
Financial support
This research has received funding from the ERA-NET Cofund FACCE ERA-GAS which is co-funded by the European Union's Horizon 2020 research and innovation programme under Grant Agreement No. 696356.
Conflict of interest
There is no conflict of interest.


 Open access