


Introduction
Traditional fertilizers have been used in-furrow in winter wheat production systems for decades (Olson and Fitts, Reference Olson and Fitts1949), but with increased popularity in their use, farmers now have the choice of a variety of new starter fertilizer products that may have yet to be evaluated for use in wheat. In-furrow fertilizers appeal to producers because they allow for applying fertilizer with the seed at planting, which can supply requisite nutrients during germination and emergence, increasing root and plant growth, and lead to increased yields, while reducing the number of field passes (Randall and Hoeft, Reference Randall and Hoeft1988; Unsworth, Reference Unsworth1991; Rhoads and Wright, Reference Rhoads and Wright1998; Kaiser, Reference Kaiser2003). The primary pre-plant fertilizer application method in many no-till production systems is surface broadcasting. Unincorporated surface applications require time to absorb into the soil solution while applying in-furrow offers increased seedling availability, as well as nutrient retention in the soil (Kaiser, Reference Kaiser2003; Grahmann et al., Reference Grahmann, Govaerts, Fonteyne, Guzmán, Soto, Buerkert and Verhulst2016). By applying nutrients in-furrow there is the potential for growers to increase efficiency, while also decreasing production costs (Mallarino et al., Reference Mallarino, Bergmann and Kaiser2011). Often times these fertilizer products are promoted as beneficial as in-furrow applications even when soil test recommendations require no fertilizer application. With increasing fertilizer costs the ability to increase efficiency and reduce costs has become a major emphasis of fertility management throughout crop production regions. While the use of in-furrow fertilizer products are an option, their ability to increase winter wheat yield beyond soil test recommendations has not been observed and could result in an economic production loss and decrease fertilizer efficiency.
Winter wheat fertility management such as in-furrow nitrogen (N), phosphorus (P) and sulphur (S) has been evaluated heavily for improving grain production. Work in Ontario, Canada has shown a positive response to in-furrow fertilizers in wheat (Hall, Reference Hall2013). In Oklahoma, USA, the most commonly used in-furrow fertilizers are urea, di-ammonium phosphate (DAP) and mono-ammonium phosphate (MAP) (Zhang et al., Reference Zhang, Raun and Arnall2017). Bushong et al. (Reference Bushong, Arnall and Raun2014) found increases in winter wheat yields when N and P fertilizers are broadcast incorporated as a pre-plant as compared to when pre-plant P is applied alone and followed by the top-dress N application. While Goos and Johnson (Reference Goos and Johnson2001) observed a 15% increase in winter wheat yields with the application of P fertilizer in-furrow; however, the addition of S had no impact. The use of in-furrow placed fertilizers in historical wheat varieties (1920–2016) has resulted in an average increase of yield of 200–400 kg/ha regardless of the variety release year (Maeoka et al., Reference Maeoka, Sadras, Ciampitti, Diaz, Fritz and Lollato2020).
However, in recent years, a variety of dry and liquid fertilizer products and formulations have become available that are designed to be applied in the seed furrow, and in effect, act as an incorporated application of nutrients. These products contain macro- (N, P and K) and micro-nutrients that are advertised to promote crop growth and development often regardless of soil test analysis recommendations, while at a low enough concentration to prevent salt damage to seedlings when applied correctly. While micronutrients are important and necessary for plant growth, micronutrient deficiencies in Oklahoma, USA are generally uncommon in winter wheat production (Warren et al., Reference Warren, Raun, Zhang, Arnall, Penn, Bushong and Abit2022).
The impacts of in-furrow fertilizer products have been evaluated in several row crops, with a specific emphasis on corn (Zea mays L.) production. Increases in corn yield have been observed in soils with 300 and 500% of critical levels of P and K, respectively (Quinn et al., Reference Quinn, Lee and Poffenbarger2020). The in-furrow application of P fertilizers in Oklahoma, USA in grain sorghum [Sorghum bicolor (L.) Moench] has shown similar grain yields and plant stands compared to a fully fertilized surface broadcast application (Nisly, Reference Nisly2018). While the impact of in-furrow fertilizer on grain yield impacts are not always greater than that of traditional broadcast fertilization method, the number of equipment passes through the field are reduced by applying with the grain drill. Although these products have a history of use in row-crop production the evaluation of these products for use in winter wheat has not been a major focus of fertilizer research.
Comparable or higher yield levels in conjunction with an ease of application may justify the use of in-furrow fertilizers, but due to limited research on new in-furrow fertilizer products in small grains, yield benefits from them are uncertain. A study conducted in Michigan noted increases in winter wheat yields of up to 2.1 Mg/ha when micro-essentials SZ (MES-Z) was used at rates of 140 and 280 kg/ha of the product (Thomas and Steinke, Reference Thomas and Steinke2021). However, this study along with prior research on in-furrow fertilizer applications only evaluates the influence of a minimal number of products. Previous research evaluating starter fertilizer application in the Great Plains has led the authors to hypothesize the use of in-furrow starter fertilizers will not improve winter wheat grain yield or nutrient concentration when soil nutrients are non-limiting. Therefore, the objective of this study was to quantify the effects of in-furrow fertilizer products and combinations on winter wheat grain yield, N and mineral concentrations. If in-furrow fertilizer products are proven to improve winter wheat grain production while reducing the cost of application for growers, this could reduce the number of trips required across a field and reduce the overall cost of production.
Materials and methods
Field trials were conducted during the 2014–15 and 2015–16 winter wheat growing seasons at three locations in central Oklahoma, USA: Cimarron Valley Research Station (Perkins) (35°59′N, 97°02′W, 291 m a.s.l.), North 40 (N40) research field (36°08′N, 97°04′W, 292 m a.s.l.) and Lake Carl Blackwell (LCB) research farm (36°08′N, 97°17′W 291 m a.s.l.). The Perkins site was located on a Teller fine sandy loam a fine-loamy, mixed, active thermic Udic Agriustoll. The N40 location was located on a Kirkland silt loam a fine, mixed, super active Udertic Paleustolls. The LCB site was located on a Port silt loam a fine silty, mixed superactive, thermic Cumulic Haplustolls. Climatic conditions of the three trial locations were very similar due to their proximity to one another. Climatological data were collected from Oklahoma Mesonet Stations located 0.60, 0.75 and 2.27 km from the trial locations for Perkins, LCB, and N40 respectively (Figs 1–3) (Brock et al., Reference Brock, Crawford, Elliott, Cuperus, Stadler, Johnson and Eilts1995; McPherson et al., Reference Mcpherson, Fiebrich, Crawford, Kilby, Grimsley, Martinez, Basara, Illston, Morris and Kloesel2007). Average cumulative rainfall for the 3 years of the trial was 832, 820 and 833 mm at LCB, N40 and Perkins, respectively. Trials were moved each year to avoid the residual impact of the previous seasons' treatments.

Fig. 1. Cumulative rainfall (mm) (left) and average daily temperature (°C) (right) for each year of the growing season as well as the 14 year running average for the LCB location.
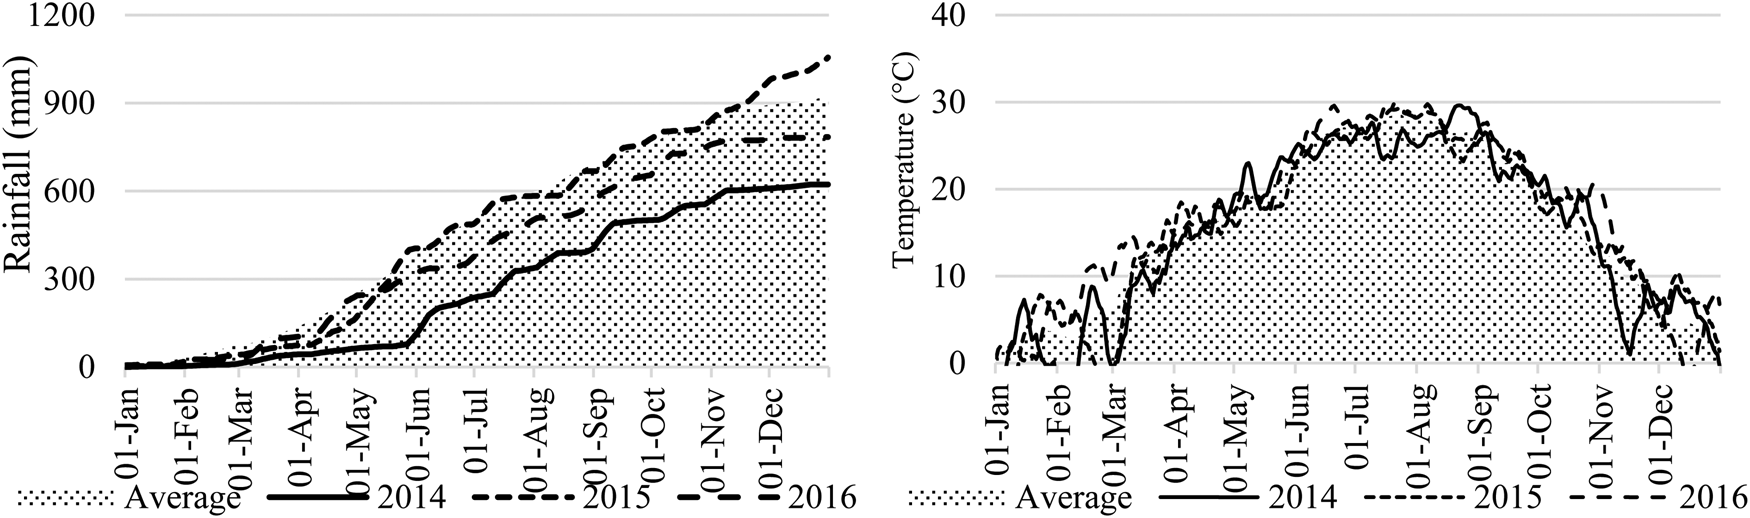
Fig. 2. Cumulative rainfall (mm) (left) and average daily temperature (°C) (right) for each year of the growing season as well as the 14 year running average for the N40 location.

Fig. 3. Cumulative rainfall (mm) (left) and average daily temperature (°C) (right) for each year of the growing season as well as the 14 year running average for the Perkins location.
Treatments were arranged in a randomized complete block design with three replications at each location, consisting of 11 fertilizer product treatments and control (Table 1). The fertilizer products that were tested are commercially available to Oklahoma wheat producers and include dry and liquid mixes, derived from both generic and proprietary products. All products used, guaranteed analysis and application rates can be found in Table 1. Three treatments were commonly used commercially available N and P fertilizer sources: DAP, MAP and ammonia poly-phosphate (APP); applied in-furrow at 15 kg P/ha. The MES-10 (12-40-0-10S) and MES-Z (12-40-0-10S-1Z) treatments (Mosaic Co., Plymouth, MN, USA) were sulphur and sulphur plus zinc-containing MAP products, respectively, applied at 14.7 kg P/ha. The MOP (0-0-60) treatment and Aspire (0-0-58-0.5B) (Mosaic Co. Plymouth, MN, USA), a boron-containing MOP product, were both applied at a rate of 18.6 kg K/ha. Nachurs (6-22-6-1S) (Nachurs Alpine Solutions, Marion, OH, USA) product, a liquid starter derived from urea, ammonium hydroxide, phosphoric acid, potassium hydroxide and ammonium thiosulphate, was applied at 15 kg P/ha. Nachurs plus CornGrow (Nachurs Alpine Solutions, Marion, OH, USA) had an additional liquid starter, which contains copper, manganese and zinc, at 15 kg P/ha (Nachurs) and 2.33 litres/ha (CornGrow). Awaken ST (Loveland Products, Loveland, CO) was applied directly to the seed before planting at a rate of 3.9 ml/kg of seed, while Awaken ST (3.9 ml/kgseed) was also used in combination with a 15 kg P/ha rate of DAP. All treatments were applied at the time of planting at each location using a Great Plains 1006NT end wheel drill (Great Plains Mfg.; Salina, KS, USA) equipped with a dry fertilizer box, double-disc opener and Schaffert rebounder seed cover (Schaffert Mfg.; Indianola, NE, USA), with CO2 to deliver liquid.
Table 1. Winter wheat in-furrow fertilizer treatment structure, guaranteed analysis in per cent of nutrient, rate of product and nutrients applied in kg/ha unless otherwise noted, and salt index of fertilizer treatments

a Mosaic Company (Plymouth, MN).
b Nachurs Alpine Solutions (Marion, OH).
c Product application in litres/ha.
d Loveland Products (Loveland, CO).
Plots measured 3 m × 6 m and were planted to Oklahoma Genetics' Iba winter wheat variety at a calibrated rate of 96 kg/ha. All plots received N application of 34 kg N/ha in the late fall, during the last week of November. Spring N applications were made at all locations at a rate of 90 kg N/ha in early February of the 2014–15 growing season. In the 2015–16 growing season two spring applications were made to all locations at a rate of 67 kg N/ha in February and another at 67 kg N/ha in March. Thus 2015–16 received an additional 44 kg N/ha.
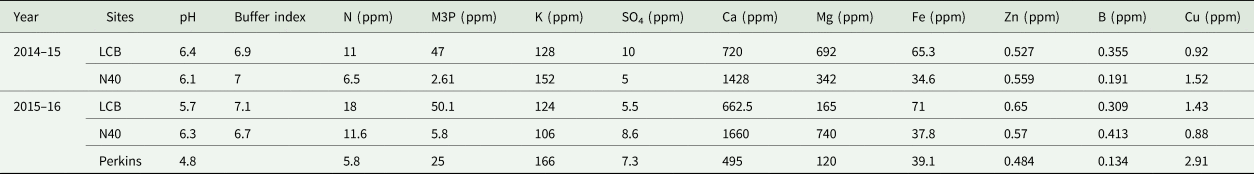
Each field was composite soil sampled to a depth of 15 cm with an average of 20 cores from a 2.5 cm diameter probe prior to planting. Soils were dried in a forced-air oven at 65°C for 12 h and ground to pass through a 2-mm screen. Soil pH was determined by pH electrode measurement of a 1 : 1 soil: water solution after a 30-min equilibration period, if pH was <6.2, 10 ml of Sikora buffer solution was added, shaken for 1 h and measured using the pH meter to determine buffer index. Nitrate–nitrogen (NO3−–N) was extracted using KCl extraction solution and analysed in a flow injection auto-analyser using cadmium reduction. Phosphorus, K, calcium (Ca) and magnesium (Mg) were extracted using Mehlich 3 extraction solution. Sulphate–sulphur (SO4–S) was extracted using calcium monophosphate (Ca(H2PO4)2), while Iron, zinc and boron were extracted using DTPA-sorbitol extraction solution. All extractions were analysed using inductively coupled plasma-optical emission spectrometry (ICP-OES; SPECTRO Analytical Instruments; GmbH, Kleve, Germany) (Zhang and Henderson, Reference Zhang and Henderson2016). Soil analysis results for each site year are presented in Table 2.
Table 2. Pre-plant soil test analysis results for all site years were taken as a 0–15 cm composite at each location
Grain harvest was achieved using a Massey Ferguson 8-XP combine (Kincaid Equipment Manufacturing; Haven, KS) with a 1.52 m header and Harvest Master Grain gauge (Juniper Systems; Logan, UT) to collect plot yield, test weight and grain moisture content. All sample weights were corrected to 125 g/kg moisture before statistical analysis. Grain sample moisture was determined gravimetrically after 12 or more hours of drying in a forced-air oven at 85°C, the samples are then ground to pass through a 1-mm screen and dried overnight at 105°C and a final weight was noted. Grain N concentration was determined using a dry combustion nitrogen/carbon analyser, and mineral concentrations are analysed using an ICP-OES (SPECTRO Analytical Instruments; GmbH, Kleve, Germany) following nitric acid digestion at 115°C for 2.5 h (Westerman, Reference Westerman1990).
Statistical analysis was conducted using PROC GLM with Dunnett's multiple comparisons with a control (Dunnett, Reference Dunnett1955) test using SAS software version 9.4 Copyright© 2020 (SAS Institute; Cary, NC). Dunnett's test was used to detect differences between each treatment and the control. Replication was used as a random factor to remove any effect of block in the model. Each site year was analysed independently after the PROC GLM model reported a year by location by treatment significance in the model. Single degree of freedom contrasts were used to further investigate significant treatment impacts on yield, contrasts for significant treatments can be found in Table 3. Significant differences were noted when the reported P-value was less than the alpha of 0.1.
Table 3. Statistical contrast analysis was conducted for treatments with significantly higher grain yield than the control at all locations with a significant response
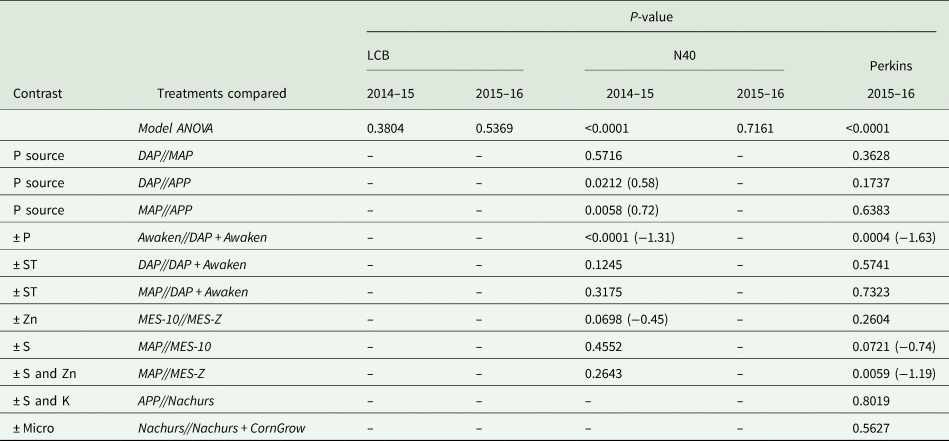
First row Model ANOVA denotes significant locations. Contrasting elements in the first column; phosphorus (P), P source, zinc (Z), Awaken seed treatment (ST), sulphur (S), potassium (K) and CornGrow micronutrients (Micro). Significant treatments containing respective contrast in the second column, and contrast P-value for the respective site in the final five columns. Value in parentheses represents the difference in Mg/ha between the contrasting elements, in the listed order.
Results
Pre-plant soil nutrients
Pre-plant soil analysis provided that all nutrients, with exception of N, were sufficient at the LCB location each year of the study (Table 2). Soil analysis displayed a P deficiency at both Perkins and N40 site years, as well as Perkins having a below recommended soil pH (4.8) (Johnson and Zhang, Reference Johnson and Zhang2003). The N40 location showed P concentrations of 2.6 and 5.8 ppm in 2014–15 and 2015–16, respectively, which is below 50% sufficiency for winter wheat production. The Perkins location P in 2015–16 was 25 ppm, which is only 94% sufficiency for winter wheat production (Zhang et al., Reference Zhang, Raun and Arnall2017). Potassium levels at all site years are above a 95% sufficiency for winter wheat production, all other nutrients for all locations fall above minimal thresholds for winter wheat production.
Winter wheat yield
In-furrow fertilizer application did not have any impact on yield in either growing season at the LCB location (Fig. 4). Soil test analysis did not indicate any deficiencies of nutrients, which suggests that when soil nutrients are adequate, the application of nutrients through in-furrow fertilizers would not increase wheat grain yield compared to an N-only control.

Fig. 4. Winter wheat grain yield (Mg/ha) at 12.5% grain moisture at the LCB location for 2014–15 (top) and 2015–16 (bottom). Error bars depict one standard error of the mean and the dashed line represents the mean of the check to which all treatments were compared.
Soil test analysis of the N40 location in both growing seasons reported soil test phosphorus (STP) levels below the critical threshold of 32.5 mg/kg (Table 2) (Warren et al., Reference Warren, Raun, Zhang, Arnall, Penn, Bushong and Abit2022). Yet, in-furrow fertilizers containing P, only increased yield in the 2014–15 growing season (Fig. 5). In 2014–15 MAP, DAP + Awaken and MES-Z treatments, containing 40–52% P w/w, improved grain yield by at least 0.65 Mg/ha when compared to the control plot (2.1 Mg/ha(d.f. 22, s.e. 0.2030)). Further investigation into the significant treatment contrasts reported the use of APP as a P source decreased winter wheat by 0.59 and 0.73 Mg/ha compared to DAP and MAP, respectively, which were not different from one another (P = 0.5716). The addition of Awaken seed treatment to DAP did not increase yield over either MAP (2.8 Mg/ha(d.f. 22, s.e. 0.2030)) or DAP (2.6 Mg/ha(d.f. 22, s.e. 0.2030)) used alone (P ≤ 0.1245). However, the DAP and Awaken combination resulted in 1.3 Mg/ha more winter wheat grain yield than only the Awaken seed treatment. The application of Zn by the MES-Z product resulted in a yield increase of 0.45 Mg/ha, compared to the MES-10 fertilizer (2.6 Mg/ha). While MES-10 and MES-Z were no different from the base fertilizer product MAP (2.8 Mg/ha) (P ≤ 0.2643), MES-Z was numerically greater at 3.0 Mg/ha. No impacts on grain yield, protein or mineral concentrations were observed in the 2015–16 season at the N40 location, regardless of low STP.

Fig. 5. Winter wheat grain yield (Mg/ha) at 12.5% grain moisture at the N40 location for 2014–15 (top) and 2015–16 (bottom). Error bars depict one standard error of the mean and the dashed line represents the mean of the check to which all treatments were compared to.
Grain yield at Perkins in 2015–16 was increased due to the application of DAP, MES-10, MES-Z, Nachurs + CornGrow and DAP + Awaken by up to 2.2 Mg/ha greater than the control (Fig. 6). Each of these products is supplying the crop with similar quantities of N and P early in the season. Significant treatment contrasts revealed no difference in P source (DAP, MAP and APP) with an average yield of 4.1 Mg/ha(d.f. 22, s.e. 0.3911) (P ≤ 0.1737). The application of DAP and Awaken seed treatment together yielded 3.8 Mg/ha which was 1.6 Mg/ha greater than the Awaken seed treatment applied alone, but no greater than DAP (P = 0.5741) or MAP (P = 0.7323) applied alone. The addition of S by MES-10 and S and Zn by MES-Z yielded similar to one another at 4.4 and 4.9 Mg/ha(d.f. 22, s.e. 0.3911), respectively, but greater than the base product MAP which yielded 3.7 Mg/ha. The addition of S and K by Nachurs (3.6 Mg/ha(d.f. 22, s.e. 0.3911)) resulted in no yield increase over APP (3.5 Mg/ha(d.f. 22, s.e. 0.3911)), which is a similar liquid P fertilizer (P = 0.8019). The combination of Nachurs with CornGrow, which added a series of micro-nutrients, yielded 3.8 Mg/ha but was not different than Nachurs when applied alone (P = 0.5627).

Fig. 6. Winter wheat grain yield (Mg/ha) at 12.5% grain moisture at the Perkins location for 2015–16. Error bars depict one standard error of the mean and the dashed line represents the mean of the control to which all treatments were compared.
Winter wheat grain nutrient concentrations
Nutrient concentrations in grain were influenced by a variety of treatments. The greatest number of affected nutrient concentration by applied treatments was observed at N40. The P and K concentrations of winter wheat grain was increased by three treatments (DAP, MES-Z and DAP + Awaken) and K was also increased by an additional source (MES-10) at the N40 location in 2014–15 (Table 4). MES-Z increased the uptake of Mg and Ca; however, Zn grain mineral concentrations were decreased at N40 due to the application of DAP, regardless of seed treatment application. At the Perkins location, Zn was increased with the application of MES-Z compared to the control (Table 4). The Perkins location also had reductions in Cu and N in the grain, where grain mineral N represents the all N in the grain, including the grain protein concentration.
Table 4. Winter wheat grain nutrients are significantly affected by the use of an in-furrow fertilizer product are in bold font
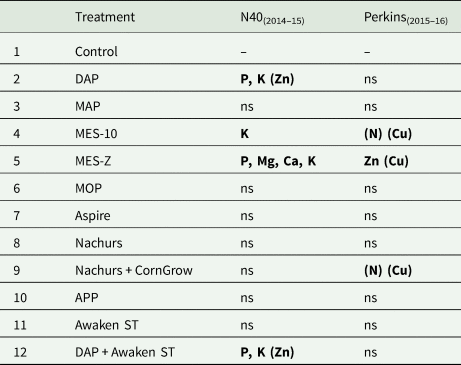
a = 0.10. Nutrients within parentheses are significantly lower than the control.
Discussion
These results displayed that yield increases with in-furrow fertilizers occurred only in nutrient-deficient soils observed at the Perkins and N40 sites. Grain moisture content and grain test weight were not impacted by in-furrow fertilizer treatments when compared to the control at any location. The low STP found at N40 and Perkins locations corresponded with yield increases with some P-containing fertilizers when compared to the control treatments (Figs 2 and 3). However, these products are often promoted to yield benefits to grain producers even when soil test results document a lack of need for additional nutrients.
In-furrow fertilizer applications in non-nutrient-limited soils did not improve grain yield, N or mineral concentration of winter wheat, compared to the N-only control. These findings are similar to Nisly (Reference Nisly2018), who reported in-furrow fertilizer applications in grain sorghum also did not increase grain yields, as well as with Karamanos et al. (Reference Karamanos, Stonehouse and Flore2003) who showed no difference between broadcast and in-furrow applications of P. Yet, when soil nutrients were limited, in-furrow applications may be more capable of managing limitations than traditional broadcast applications, such as the application of P-containing fertilizers in-furrow in low P or low pH soils similar to the N40 and Perkins locations in this study. Bushong et al. (Reference Bushong, Arnall and Raun2014) and Franzen (2020) also found similar results, where utilizing MAP or DAP sources applied in-furrow in low P soils increased the grain yield of winter wheat compared to broadcasting P fertilizers.
Some P-containing fertilizers, such as MAP and DAP, can cause chemical reactions near the prill that could further impact the availability of nutrients. When applied in the soil, MAP generates an acidifying reaction around the prill, while DAP results in an alkaline reaction (Fernández and Hoeft, Reference Fernández and Hoeft2009). These reactions then result in variations in soil pH levels near the prill that could alter the availability of nutrients. All products used in this study contain a base P of either MAP or DAP, except for Nachurs which is an APP-based product. The lack of difference between MAP and DAP can be attributed to the influences being reported to only last for a short period and resulting in no agronomic differences (Fernández and Hoeft, Reference Fernández and Hoeft2009).
Increases in winter wheat grain yield, beyond the application of P, were observed at two nutrient-deficient sites indicating that although P is limiting, it was not the only limiting nutrient. Numeric response to P-containing products at the N40 location, was increased by the addition of Zn, although soil test levels of Zn were sufficient for Oklahoma, USA winter wheat production (>0.3 ppm Zn) (Warren et al., Reference Warren, Raun, Zhang, Arnall, Penn, Bushong and Abit2022). At Perkins in 2015–16, the application of S, Zn and micro-nutrient combinations along with P resulted in increased yields as well. Increased application of P at N40 in 2014–15 resulted in a decrease in Zn concentration in the grain; similar to results found by Smith et al. (Reference Smith, Janzen and Ellert2017).
The application of many P-containing fertilizers increased yield, yet not all increases in yield could be directly attributed to the application of P, since responses were not similar across all fertilizers. The lack of response to P fertilizers under the low STP conditions at the N40 location has been reported by Reed et al. (Reference Reed, Watkins, Souza and Arnall2021) but the cause remains unknown. The limited responses to P fertilization in P-deficient soils are unique, as other studies have reported increases in yield by correcting P deficiencies (Bushong et al., Reference Bushong, Arnall and Raun2014; Chatterjee and Franzen, Reference Chatterjee and Franzen2020). The Perkins location was also reported to be acidic with a pH of 4.9 (Table 3) along with the low soil P concentration. Research on long-term P-managed fields has proven that when pH falls below a suitable level (<6.0 pH), P removal in grain is much lower than ideal in winter wheat, winter barley and sugar beets (von Tucher et al., Reference von Tucher, Hörndl and Schmidhalter2018).
Soil acidity can have impacts on availability of other nutrients as well, such as aluminium (Al3+). In acidic conditions, Al3+ precipitates P in the soil solution, resulting in P becoming unavailable to the plant (Rutter et al., Reference Rutter, Arnall and Watkins2017; Penn and Camberato, Reference Penn and Camberato2019). High Al3+ soluble soils can be toxic to small-grain crops (Hetrick and Schwab, Reference Hetrick and Schwab1992; Reed et al., Reference Reed, Watkins, Souza and Arnall2021), reducing plant stands and grain yield. Aluminium concentration was not measured at any site; therefore no conclusions can be drawn regarding the relationship between soil Al3+ concentration and limited P responses observed at Perkins in 2015–16. However, a short-term solution, recommended by Oklahoma State University is applying 34 kg/ha DAP in addition to M3P recommendations to alleviate Al3+ toxicity in soils between pH of 5.5 and 5.1, and 67 kg/ha in soils with a pH lower than 5.1 (Rutter et al., Reference Rutter, Arnall and Watkins2017; Reed et al., Reference Reed, Watkins, Souza and Arnall2021).
Two of the three low STP site years produced a response to P-containing fertilizers, some of which contained micro-nutrients. However, responses to a single product applied in-furrow were irreproducible across research locations or years. This could be attributed to the spatial variability of P within a single location, as reported by Watkins (Reference Watkins2017), who found broad ranges in STP within locations across the state of Oklahoma, USA. However, it can be inferred that in-furrow application of some of these products that include P can not only overcome P limitations in the soil, but also can combat low pH-related toxicity when present.
This research leads to the interest in other available products and their ability to increase wheat productivity while reducing field passes. It is, however, unclear why some P-containing products overcome P deficiencies, while others did not, but this phenomenon could be a factor of spatial variability of STP. This research does provide information that shows the use of in-furrow fertilizer products can be beneficial in fields where the soil test nutrients, specifically P, are low. However, the products tested in this study are a small number of available in-furrow fertilizers, and these results cannot convey the impacts of these other products. These fields used in this study also represent a small amount of the variability in soil conditions across small-grain production regions and do not represent extreme soil pH which could potentially lead to responses to P source, Fe and Zn. The possibility to increase yields on marginal soils has been reported by this study and others, but when soils are within optimal pH range and not deficient in nutrients these products have not been shown to impact yields of winter wheat.
This study has found when pre-plant soil nutrients are adequate neither wheat grain yield nor nutrient concentrations were influenced by the in-furrow application of fertilizer products. In contrast, winter wheat yields on nutrient-limited soils were improved by the in-furrow application of a few products that contained a limiting nutrient as well as some containing other, non-limited, micro-nutrients. Therefore, nutrient levels should be monitored through soil testing to prevent and correct the occurrence of deficiencies. In the event of a deficiency, in-furrow application of some products may be useful to mitigate these impacts for a single crop season.
Conclusion
This research was designed to evaluate the potential of in-furrow applications of commercially available products to improve winter wheat production and mineral concentrations in comparison with traditional fertilization practices. Due to these findings the authors support the hypothesis, while recognizing the opportunity of these in-furrow applied starter products to improve production on nutrient-limited soils. However, the data suggest the correction of soil deficiencies is more important than the source of correction. While these results represent a limited range of growing conditions in which crop production takes place, they support the need for soil testing and following recommendations.
Author contributions
B. A. Finch: formal analysis, writing – reviewing and editing, V. T. Reed: writing – review and editing, J. E. Williams: investigation, methodology, writing – original draft, R. L. Sharry: writing – review and editing, D. B. Arnall: conceptualization, data curation, funding acquisition, investigation, methodology, project administration, resources, supervision, writing – review and editing.
Financial support
This study was supported by Oklahoma Fertilizer Check-off and the Oklahoma State Field and Research Service Unit.
Conflict of interest
The authors declare there are no conflicts of interest.


 Open access