


Introduction
Nowadays, dairy cow welfare is a major concern for both producers and consumers. Welfare is defined as good nutrition, housing, health status and behaviour of the animal. Changes in animal welfare can cause a decrease in productivity, particularly milk production (Islam et al., Reference Islam, Sharma, Ahsan, Mazumdar, Rudra and Phillips2020). Milk production is related to the intake of necessary nutrients in dairy cows (Conrad et al., Reference Conrad, Pratt and Hibbs1964). The diet of ruminants often includes not only corn silage which has a high concentration of starch but also digestible neutral detergent fibre (aNDFom). The content of fibre creates satiety in the animal, so much so that feed intake is limited. The concentration of aNDFom and the digestibility associated with it play a key role in the animal's diet (Krämer-Schmid et al., Reference Krämer-Schmid, Lund and Weisbjerg2016). Fibre, in addition to being responsible for ruminal filling, promotes chewing and peristaltic activity, contributing to proper digestion. During digestion, a more homogeneous environment is created and there is control of retention or escape of particles from the rumen. Ruminal filling is related to rumination because during this phase pressure and stretch receptors are activated in the wall of the reticulum, depending on the particle size of the different foods. To measure physical filling, it is also important to measure the indigestible NDF content. This parameter represents the fibre that is not digested and is estimated through fermentation for 240 h (Fustini et al., Reference Fustini, Palmonari, Canestrari, Bonfante, Mammi, Pacchioli and Formigoni2017).
It is of paramount importance to analyse the digestibility of feeds. There are two types of digestibility: true digestibility and apparent digestibility. The former is defined as the percentage of feed that is excreted in the faeces and thus has been absorbed by an animal; whereas the latter is lower than true digestibility because faeces contain endogenous proteins and fats and secretions of the digestive system. The compound that limits digestibility is lignin, due to bonds with cell wall polysaccharides (González Torres, Reference González Torres2012). It is well known that (Jung et al., Reference Jung, Mertens and Payne1997) dry matter (DM) and NDF digestibility are negatively correlated with lignin content.
Manure or faeces analysis can be performed by obtaining information on the digestibility of diets and on fermentative processes. There are several factors that influence the characteristics of faeces. Higher intake of DM determines an increase in the size of the particles present in the faeces, the same is evident when diets are low in effective fibre (peNDF) and high in non-structural carbohydrate content; this is because inadequate consumption of peNDF causes inadequate ruminal fibrous mass formation, which is not effective enough to retain small particles in the rumen (Mertens, Reference Mertens1997). This similarly occurs if the decrease in peNDF is accompanied by a reduction in feed particle size (Poppi et al., Reference Poppi, Norton, Minson and Hendricksen1980).
To be analysed, the faeces should be washed with hot or cold water to allow the operator to check if the state of digestion is optimal. Next, they should be sieved, observing the particles found in each sieve. Diets with low levels of forage and detergent acid have been found to have a high DM content in the faeces and a low faecal score (Ireland-Perry and Stalling, Reference Ireland-Perry and Stalling1993).
Another important parameter in faecal analysis is colour. It depends on the type of feed, bile concentration and average digesta transit. Usually, it has a dark green colour when cows eat fresh forage and an olive-brown colour if the animals eat hay in their diet. If cows eat large amounts of grain, the faeces are olive-yellow in colour (Kononoff and Heinrichs, Reference Kononoff and Heinrichs2003). Another important value in faecal analysis is pH. This is negatively correlated with the starch content of the ration, the starch content of the faeces and the DM content of the faeces. In addition, diets with low forage content and 170 g/kg of acid detergent fibre (ADF) show low pH, compared to diets characterized by an ADF equal to 250 g/kg (Ireland-Perry and Stalling, Reference Ireland-Perry and Stalling1993). Cows fed an abundance of grain showed a more acidic pH, compared to grass-fed cows (Cook et al., Reference Cook, Dadour and Ali1996). Measurement of faecal pH is a good indicator of small intestinal pH (Wheeler and Noller, Reference Wheeler and Noller1977; Nordlund et al., Reference Nordlund, Cook and Oetzel2004).
Imaging analysis can be used to assess stool consistency and colour. In recent years, RGB imaging is widely used because of its colour rendering and simple hardware structure. RGB images are captured using digital cameras, webcams or scanners. This technology also features a lighting system, a camera and image analysis software via a computer, so colour information can be obtained from the images in the form of RGB pixel ribbons. RGB imaging makes it possible to determine the overall colour and visually evaluate the analysed samples. Generally, RGB imaging is very beneficial, although it provides limited information (Fan and Su, Reference Fan and Su2022). To overcome this problem, RGB image analysis is often combined with deep learning. Using deep learning with artificial intelligence (AI) allows for the elimination of subjectivity in sample evaluation. Image processing and convolutional neural networks (CNNs) are the key components of deep learning; this approach has already been used in stool detection and classification (Choy et al., Reference Choy, Hu and Chen2021).
CNN technology is used as an algorithmic tool to analyse data from sample images acquired with RGB cameras. CNNs can learn the representation and can perform shift-invariant classification on the input information according to a hierarchical structure. Normally, CNN is most often used as a tool to analyse images, such as in the case of white meat classification (Fan and Su, Reference Fan and Su2022). CNN models have already been trained on forest data sets and shown to perform well (Egli and Höpke, Reference Egli and Höpke2020).
The CNN technology consists of an input layer, a convolution layer, a pooling layer and an output layer. The input layer receives pixels from the image. The convolution layer uses the convolution kernel to extract features from the image. The pooling layer is followed by the convolution layer, with the purpose of reducing the pixels to be processed and formulating the abstract features. The output layer allows classification based on the considered categories (Gao et al., Reference Gao, Huang, Wang, Sun, Hussain and Yang2017).
The literature shows few works regarding the analysis of RGB images on animal faeces, also using a deep learning system for classification.
Therefore, the aim of the present work was to evaluate and classify dairy cow faeces by RGB image analysis, using an AI (CNN) algorithm. A visual faecal analysis was performed. To standardize data analysis, a faecal score index (FCI) was assigned on an empirical basis.
Materials and methods
Farms and sampling
The study was carried out on four dairy farms located in central Italy (Viterbo and Roma provinces). The herds were selected because they were representative of the production area in terms of production system adopted (intensive), average milk yield per cow and barn design and management (total confinement-free barn housing with no time at pasture, Total Mix Ration (TMR) and feeding practices based on corn silage). The herd size was 60, 105, 290 and 510, lactating and dry cows (herds A, B, C and D, respectively). All herds were freestall barns. Lactating cows were fed TMR once a day, in the morning. The study was carried out from January 2021 until the end of December 2021.
Faecal condition scoring
Faecal condition scores and faecal colour provide information on how a diet is being digested and the state of gastrointestinal health. Manure change is a guide when making feed changes for evaluating rations. Fresh, undisturbed piles of faeces or droppings may provide valuable clues and should be part of your toolbox when evaluating the nutritional status of the dairy herd. Currently, there are five faecal scores to assess faecal consistency and thus digestibility in ruminants. Consistency is dependent on water and fibre content of the manure, type of feed and passage rate. A scale of 1–5 is listed below with a score 3 optimal (Ireland-Perry and Stalling, Reference Ireland-Perry and Stalling1993):
• Score 1: Very liquid stool, pea soup consistency: excess protein or starch can lead to this score. Excess urea in the large intestine can generate an osmotic gradient that increases the water content of the stool.
• Score 2: Very liquid stool that sprays when it hits the ground or concrete floor; cows on pasture or fed low-fibre diets or lacking effective fibre may exhibit this score.
• Score 3: This is the ideal score. Faeces take on a cake shape on the ground, can be stacked up to 1.5 or 2 inches thick, with several concentric rings and a small depression in the centre; they make a plopping sound when they hit the floor.
• Score 4: On the ground, faeces take on a thickness greater than 2 inches; dry cows may have faeces with this type of score; may reflect feeding poor quality or protein deficient forages. Addition of grain and protein or better forage quality may lower the stool score.
• Score 5: Stool appears as solid pellets; straw feeding or excessive dehydration contributes to this rating; cows in digestive block may exhibit this score.
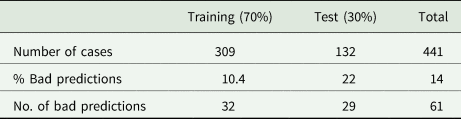
The scoring was validated before starting the trial. Some authors of this article individually scored several faecal samples in two farms until there was a difference between evaluators lower than 0.5 point. The details of the data set used for the calculations are reported in Table 1 which includes the total number of samples (441) taken without replicates.
Table 1. Numerosity of the data set subdivided per FCI class based on a faecal score, from 2 to 4, that grows as the water content in the faeces decreases
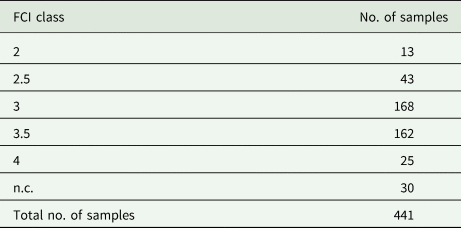
n.c., not classified.
Data acquisition and data set construction
Images were on purpose acquired with different smartphones under several environmental light conditions.
Most of the images were taken using the rear camera of a Samsung Note 9 acquiring a 12 megapixel image, shot at 4.3 mm focal length (26 mm in 35 mm equivalent format), manual exposure and with flash on. Another portion of the images was taken using an iPhone X rear camera also working at 12 megapixel resolution at 4 mm focal length (28 mm in 35 mm equivalent format). Remaining images were taken with an Oppo A9 2020 model, manual exposure at 2.34 mm focal length.
This was done to increase the variability and to strengthen the final developed model. As a result, zoom level and pixel dimensions are not uniform across the data set. Figure 1 shows four samples of images of the data set belonging to the class 2, 3, 4 and n.c., respectively, where n.c. stands for ‘not classifiable’.
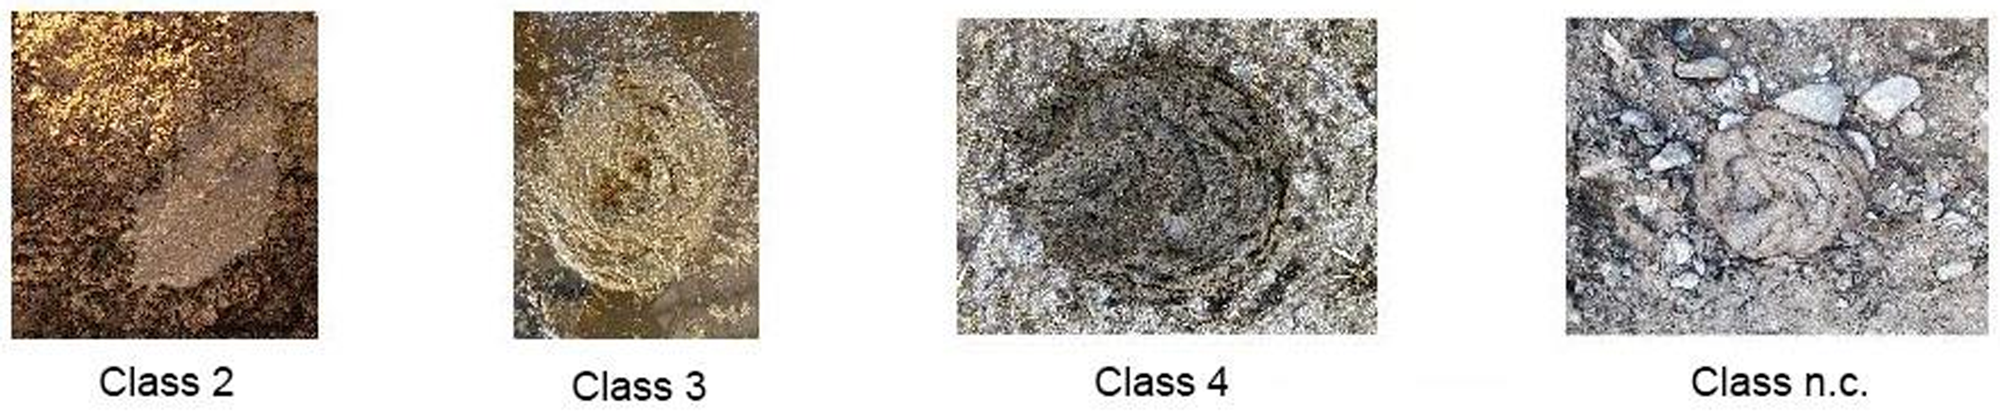
Fig. 1. Example of RGB images from the faecal data set. Ground truth labels are assigned by eye inspection.
The data set considered in this preliminary work was made of five classes plus an additional class where we put all the samples for which FCI is not well defined, namely: 2, 2.5, 3, 3.5, 4 and n.c. The FCI was visually assessed by an expert operator identifying the correct values through the pictures. The original FCI was based on seven classes: 1.5, 2, 2.5, 3, 3.5, 4, 4.5 and n.c. representing not classifiable faeces, since they do not fall in any of the standard faecal score values ranging from 1 to 5. The class was anyway included in the analysis to better test the generalization of the model.
However, class 1.5 and class 4.5 were composed by an insufficient number of samples each. For this reason, the number of classes was reduced including the samples owing to class 1.5 in class 2 and the samples owing to class 4.5 in class.
CNN architecture and training
The CNN was trained adopting two separated strategies, called in the following (A) and (B). In both cases transfer learning on a pre-trained CNN known as ‘googlenet’ (ImageNet, 2020) (www.image-net.org), trained on the ImageNet data set (Krizhevsky et al., Reference Krizhevsky, Sutskever and Hinton2017; Szegedy et al., Reference Szegedy, Liu, Jia, Sermanet, Reed, Anguelov, Erhan, Vanhoucke and Rabinovich2015) was applied as implemented in the deep learning MATLAB (R2019b) toolbox. The obtained network was named ‘transfernet’. In the first case – case (A) – a one-step training strategy was adopted, and the CNN was trained for ten epochs and saved as ‘transfernet1’. In the second case – case (B) – the obtained CNN was trained for six epochs and named ‘transfernet2’. Afterwards, ‘transfernet2’ was retrained for six epochs more, and saved as ‘fecalnet’.
In both strategies a minibatch of ten iterations (30 iterations per epoch) was adopted during the training process. The stochastic gradient descent with momentum optimizer was used with a learning rate of 10−4. Data augmentation was not applied due to the significant class imbalance.
The final output is obtained by means of a softmax function and is a six-dimensional probability vector p whose components represent the output probability of the corresponding class. The output class is given by the lager component of the vector p.
The 441 samples have been split into proportions of 0.7 for the training set (309 samples) and 0.3 for the evaluation set (132 samples). Being the data set formed by unstructured data (i.e. undefined features) it is not possible to define a metrics for optimal splitting of the data into training and test sets. For this reason, the partitioning of the data sets was conducted with a fully random procedure.
Results
Figure 2 illustrates the total number of faecal piles scored across. The great majority of the faeces received a score of 3 and 3.5. Results were different compared with data reported by Melendez and Roy (Reference Melendez and Roy2016) who found greater frequency of score 2.5 in Holstein lactating cows in Florida. Figure 3 shows the results obtained with a one-step and a two-steps training strategy. Training ‘transfernet’ with six epochs gives a validation accuracy of 54%. Keeping training for ten epochs in total (‘transfernet1’) improves the accuracy by ≈15% but it ends up in the so-called ‘overfitting’ region where the training accuracy (78%) was significantly larger than the validation accuracy (68%). Adopting a two-steps training strategy (training ‘transfernet’ for six epochs, saving the weights, initializing the parameters and then training again for six epochs) prevents overfitting and improves the validation accuracy by ≈44% bringing the training accuracy up to ≈90% and the validation accuracy up to 78%. Results are summarized in Table 2 and Fig. 2.
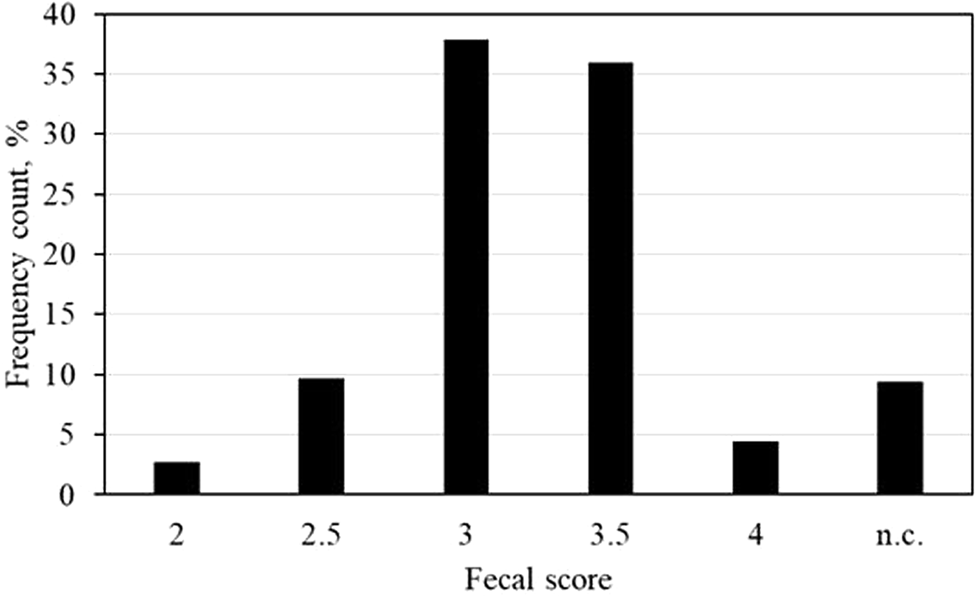
Fig. 2. Frequency count for each faecal score (n = 441). n.c., not classified.
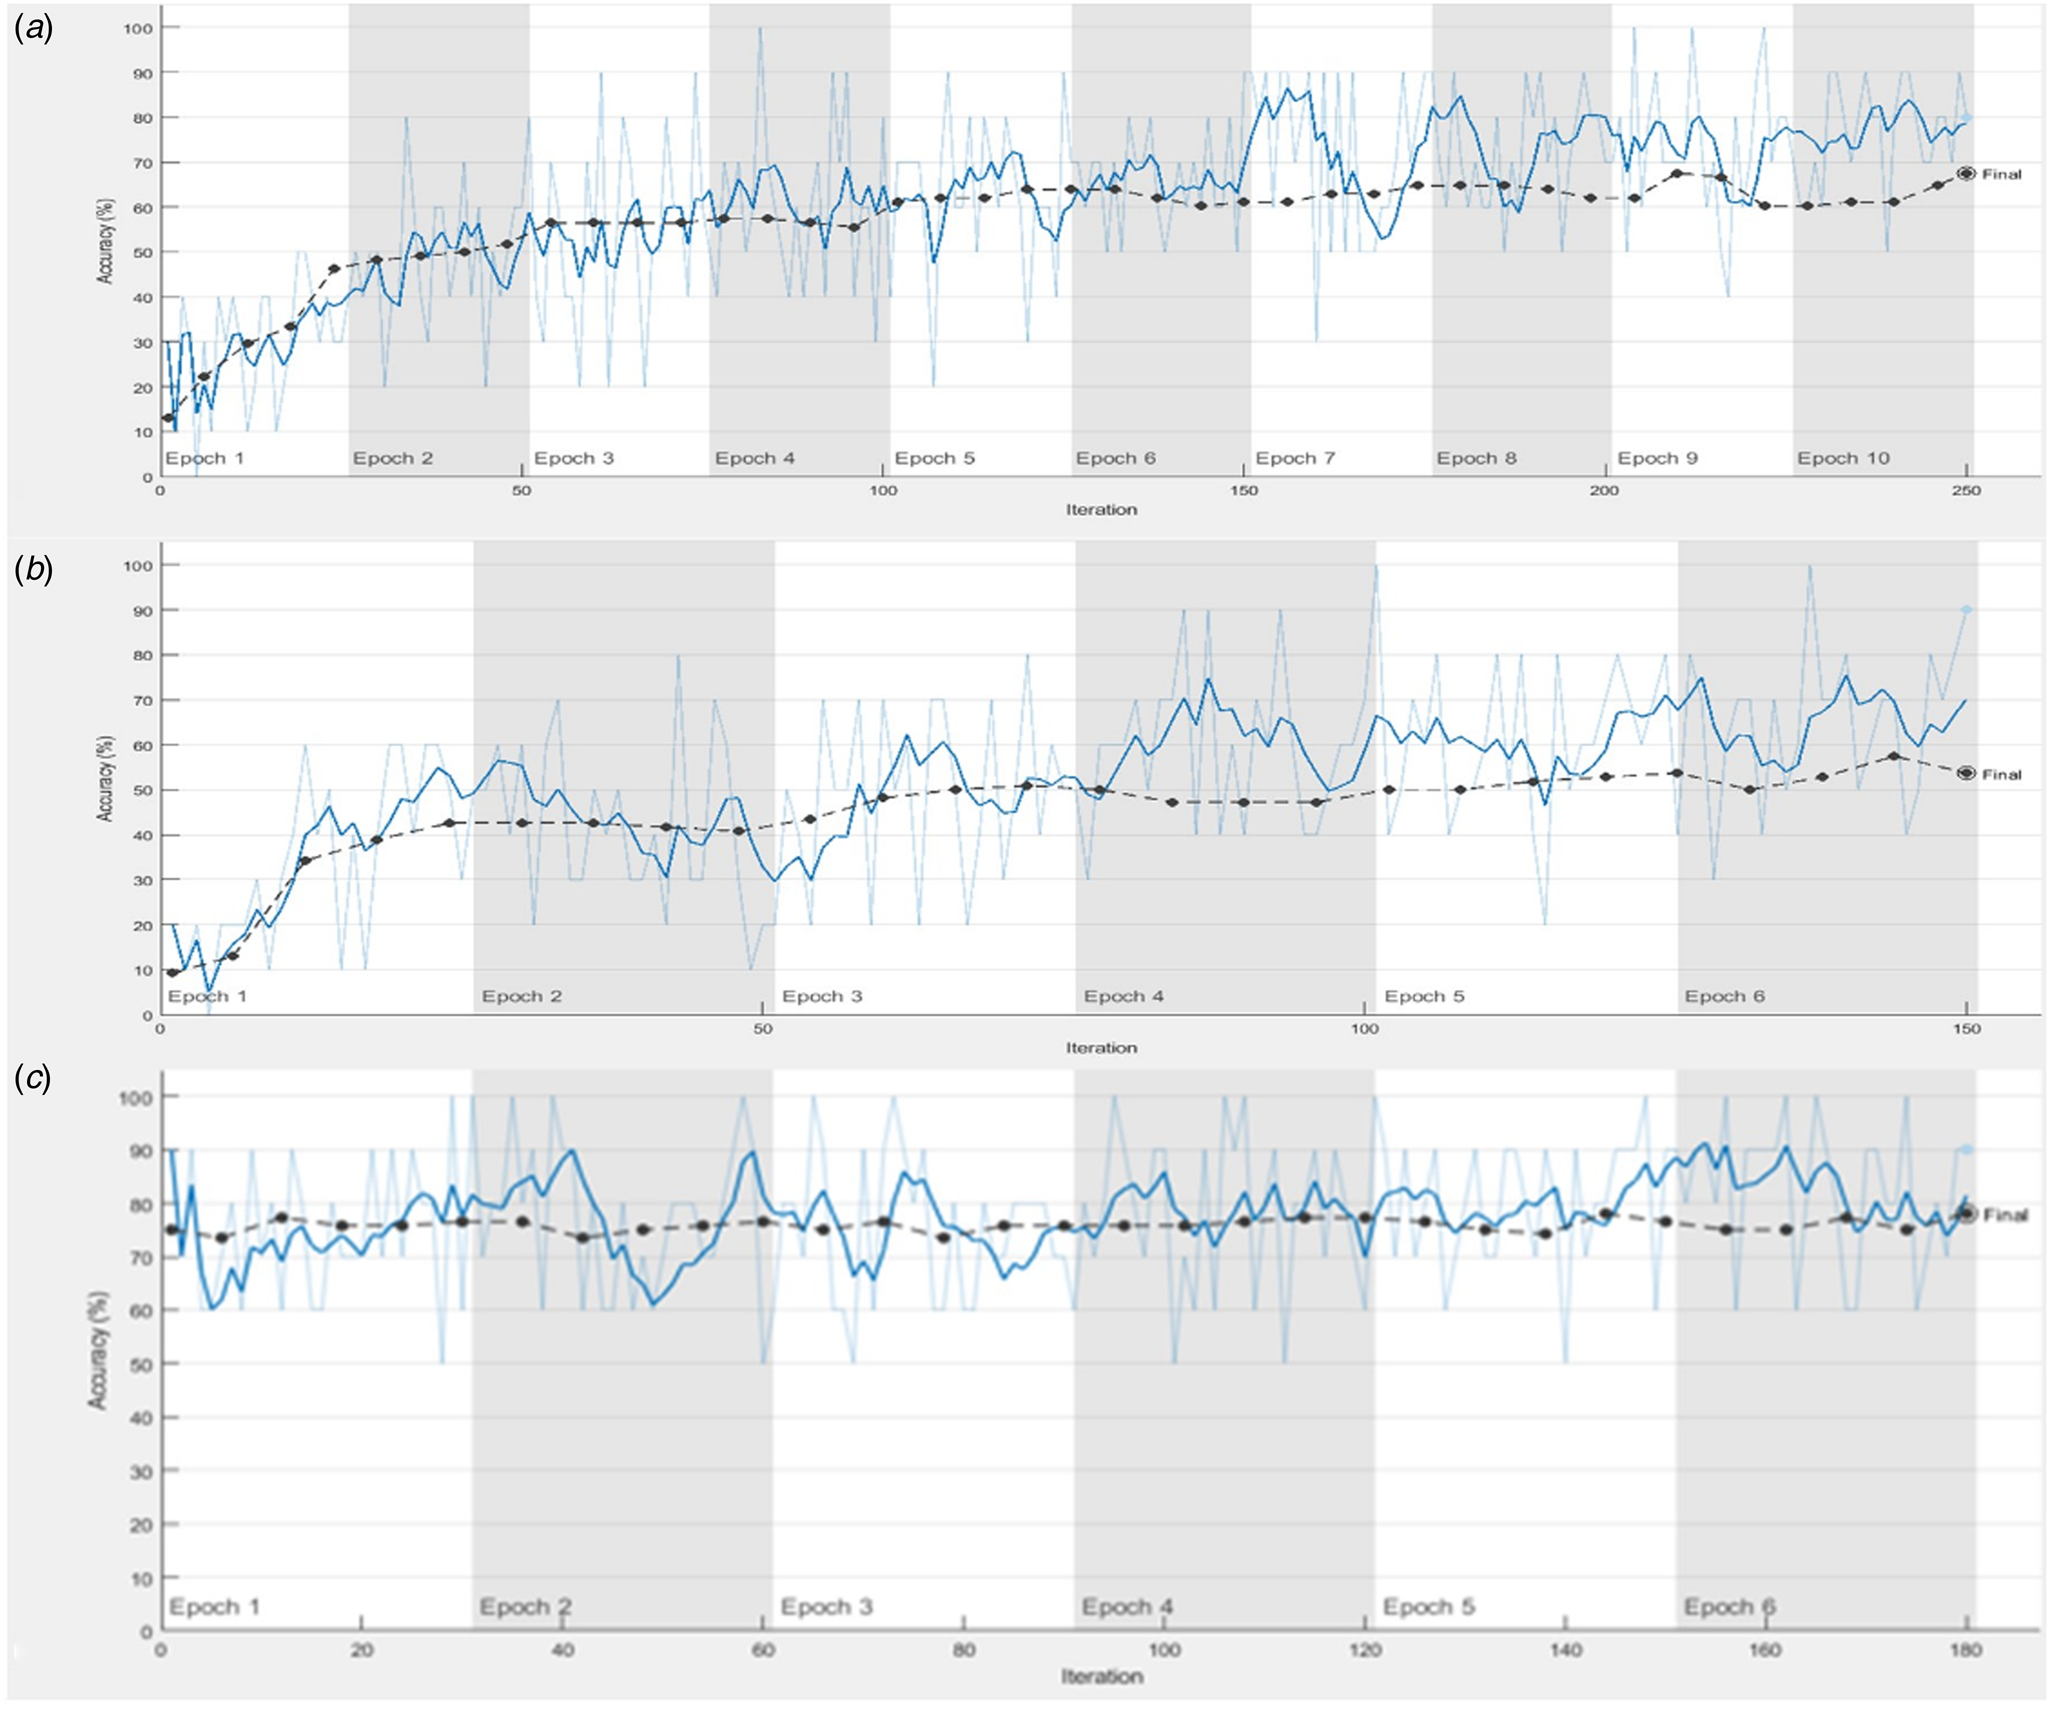
Fig. 3. Training (light blue line) and validation (black dashed-dotted line) accuracy for one step (a) and two-steps (b) and (c) training strategies. Dark blue lines represent the training accuracy smoothed by means of a moving mean over ten iterations.
Table 2. Principal results of CNN ‘faecal net’
As reported by Atkinson et al. (Reference Atkinson, Smith, Smith, Reynolds, Humphries, Moorby and Kingston-Smith2020), it is possible to detect the presence of undigested fibre and corn kernels (approximately 90%) using a deep learning approach. This indicates the importance of this system in monitoring the digestive health of ruminants, allowing for rapid intervention to change feed if digestibility issues arise. Figure 4 shows training and test confusion matrices and an example of the classification obtained on the four samples of the data set used (Fig. 5). It is possible to observe that the classification overall accuracy is high (86%), but, considering the single classes, the errors are mainly distributed on the adjacent classes and not randomly. Increasing the data set size, the discrimination ability between two adjacent classes is expected to increase significantly.

Fig. 4. Training and test confusion matrices of ‘fecalnet’ obtained with the two-steps training strategy described in the text.
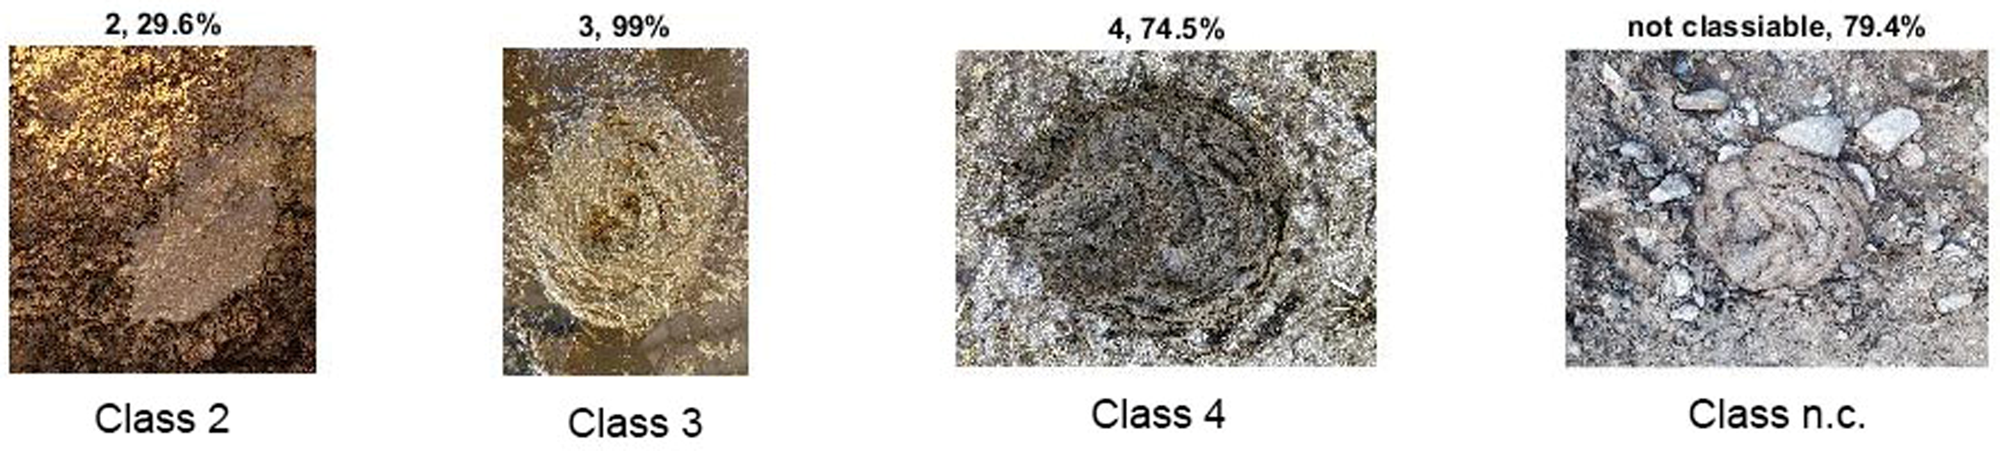
Fig. 5. Example of FCI assignment based on faeces image classification by the CNN. Class and probability, and ground truth labels are also reported on top and bottom of the single image, respectively.
Discussion
Faeces’ colour and consistency evaluation gives important information about hindgut fermentation of consumed feeds to observe cattle nutrition and health. This method represents a useful diagnostic tool for investigating what might be happening during the digestive process. Many authors have shown the relationship between diet composition and faecal consistency. For example, studies have shown that cows from intensive breeding produce more liquid faeces and restricted water, or protein intake and severe dehydration could result in firmer faeces (Varga, Reference Varga2003). The ration composition influences the consistency and the colour of manure. A high-protein diet or that experience high levels of rumen degradable protein, causes liquid or loose manure. Conversely, cows eating diets poor in proteins, or with lower water intake excrete firmer faeces (Kononoff et al., Reference Kononoff, Heinrichs and Varga2002). When animals are fed excessive starch lower faecal consistency may occur (Hall, Reference Hall2002). Moreover, Hall (Reference Hall2002) reported that the high presence of faeces in the first two score classes was directly related to unbalanced rations in terms of protein. On the contrary, an increase of categories 4 and 5 (high consistency) was observed in farms characterized by fibre excess and low water intake (Adduci et al., Reference Adduci, Labella, Musto, D'Adamo, Freschi and Cosentino2015). The consistency of manure is a function of the feed moisture content and the mean retention time of the feed in the digestive tract of the animal (Varga, Reference Varga2003). For example, more consistent faecal scores may indicate a lower by-pass of undigested feeds (carbohydrate in particular) to the lower gut (Bagheri Varzaneh, Reference Bagheri Varzaneh2022). A normal faecal consistency consists in a medium porridge-like with a shape in a range between 2.5 and 5.0 cm (Varga, Reference Varga2003). This is probably because of increased water consumption to excrete excess nitrogen through the urine. When animals are fed diets high in carbohydrates, faeces are bright, yellowish, with a sweet-sour smell (Kleen et al., Reference Kleen, Hooijer, Rehage and Noordhuizen2003), foamy with gas bubbles and contain more undigested fibre or grain (Hall, Reference Hall2002). Manure of animals nourished with fresh forage is normally dark green while animals nourished with more hay forage in the ration produce brown olive faeces. Dark manure colour indicates the presence of haemorrhagic events in the intestinal tract. Finally, the evaluation of manure characteristics together with other information on physical and chemical characteristics of the diet may be useful for better understanding the feeding management of dairy cows.
Other factors can be responsible for a change in FCI. The phase of lactation affects the consistency of faeces. Early lactation cows have faeces more liquid than late lactation cows. This is probably also due to the different diet fed in early and late lactation (Ward et al., Reference Ward, Hughes, Faull, Cripps, Sutherland and Sutherst2002).
Faecal score was also related to cleanliness scores of the udders, flanks and legs of lactating cows (Ward et al., Reference Ward, Hughes, Faull, Cripps, Sutherland and Sutherst2002). Those authors have observed a significant correlation between the consistency of faeces and cleanliness score of early lactation score, when cows produce large quantities of liquid faeces it is not easy to maintain clean surface.
Conclusions
The present work was an attempt to evaluate and classify dairy cow faeces by advanced RGB image analysis based on an AI (CNN) algorithm called ‘fecalnet’. Considering the results obtained we can define the methodology as a very promising approach to an often-subjective field evaluation. This is also true considering the low sample number used. Future studies may increase the data set to strengthen the already good performances. Moreover, this kind of model can be easily extracted and adapted through a Java script to build an Android app. This will represent a powerful yet easy to use tool for in field direct evaluation of the faecal score which is normally visually evaluated. Thus, the app may be used by both, farmers and technicians for providing correct faecal score determination.
Author contributions
L. O., S. Vi., F. P. and C. C. conceived and designed the study. S. F., S. Vi., S. V., F. T., F. P., C. E., L. B., U. B. and C. C. conducted data gathering. C. C. and L. O. performed deep learning analyses. S. Vi., L. M., L. O., C. C. and F. P. wrote the article.
Financial support
Project INNOVALAT: tecnologie innovative per l'alimentazione del bovino da latte. MipaaF (Italian Ministry of Agricultural, Food and Forestry Policies) DM no. 16843 del 11/04/2019.
Conflict of interest
The authors declare there are no conflicts of interest.


 Open access