


1. Introduction
Food safety, security, and resilience are the primary objectives of several key government agencies. At the federal level, the U.S. Food and Drug Administration (FDA), the U.S. Department of Agriculture Food Safety Inspection Service (USDA-FSIS), the Environmental Protection Agency (EPA), and Centers for Disease Control and Prevention (CDC) regulate and monitor food safety and production. At the state and local level, there are over 3,000 agencies whose main objective is regulation and oversight of food retail (FDA, 2020). Regulatory constraints—such as mandatory food labeling laws, safety and quality inspections, and establishment licensing—protect consumers, mitigate environmental hazards, and moderate industry and economic growth (Dawson and Seater, Reference Dawson and Seater2013), albeit at the risk of unintended consequences (Malone and Stack, Reference Malone and Stack2017) and higher consumer prices (Chambers, Collins, and Krause, Reference Chambers, Collins and Krause2019).
In this article, we explore regulatory variation across supply chains at the federal and state level for animal protein products, including beef, pig, poultry, sheep, goat, and seafood. We focus on these foods because animal protein makes up nearly 50% of total protein intake in U.S. adults (Pasiakos et al., Reference Pasiakos, Agarwal, Lieberman and Fulgoni2015), and nearly 80% of U.S. adults consume meat as a protein source while 30% consume seafood (Shahbandeh, Reference Shahbandeh2018). Indeed, beef, poultry, and seafood are among the most-consumed protein sources in the United States (USDA-ERS, 2019). Supply chain sustainability and resiliency have been brought to center stage given meat shortages partially driven by COVID-19 outbreaks at meat-packing plants (Lusk, Tonsor, and Schulz, Reference Lusk, Tonsor and Schulz2021; Mallory, Reference Mallory2021; Martinez, Maples, and Benavidez, Reference Martinez, Maples and Benavidez2021), environmental concerns linking meat consumption to climate change (Hunter and Röös, Reference Hunter and Röös2016), and increased consumer sentiment for animal welfare (McKendree, Croney, and Widmar, Reference McKendree, Croney and Widmar2014; Ortega and Wolf, Reference Ortega and Wolf2018). Indeed, relaxing regulatory restrictions on agricultural systems has been one recommendation for increasing supply chain resiliency (Malone, Schaefer, and Lusk, Reference Malone, Schaefer and Lusk2021; Thilmany and Malone, Reference Thilmany and Malone2020). As such, our objective in this article is to compare regulatory restrictions across animal producer types and industry supply chains.
Many studies examine the effects of regulations in the food sector (Bovay and Alston, Reference Bovay and Alston2018; Escalante, Luo, and Taylor, Reference Escalante, Luo and Taylor2020; Mojduszka and Caswell, Reference Mojduszka and Caswell2000; Zago & Pick, Reference Zago and Pick2004), but few have explored regulations within an industry across states or across whole supply chains as we do here. Fewer still have sought to compare regulatory constraints between industries (Al-Ubaydli and McLaughlin, Reference Al-Ubaydli and McLaughlin2017). To accomplish these tasks, we utilize novel data made available from the Mercatus Center’s RegData and State RegData. These databases utilize machine-learning techniques to count instances of words that indicate binding restrictions in federal and state laws. We use these counts and input–output (I–O) modeling to assess the number of regulatory restrictions at the federal level affecting animal producers, as well as the number of federal and state regulatory restrictions affecting animal protein supply chains.
Our contribution to the literature is threefold. First, we complement existing research (Al-Ubaydli and McLaughlin, Reference Al-Ubaydli and McLaughlin2017; Dawson and Seater, Reference Dawson and Seater2013; Djankov et al., Reference Djankov, La Porta, Lopez-de-Silanes and Shleifer2002; Stigler, Reference Stigler1971) by examining the number of federal regulatory restrictions affecting the beef, pig, poultry, sheep, goat, and seafood industries, which reveals the potential for important differences in U.S. animal production regulations. Comparisons across industries allows us to assess calls to reduce regulatory costs in certain industries, for example, aquaculture in the United States (Engle et al., Reference Engle, van Senten and Fornshell2019).Footnote 1 If regulatory restrictions closely approximate regulatory burden, then one would expect that industries with greater relative concerns about regulatory burden have more regulatory restrictions.Footnote 2 Second, we examine the number of regulatory restrictions at the federal level “downstream” of animal producers, including processing, wholesale distribution, and retail sales, to assess the amount of regulation across agricultural supply chains and animal protein sources. Examining regulations across an entire supply chain is important because regulation directed at one part of the chain can affect activity in another part. Third, we examine state regulatory heterogeneity associated with animal protein products by measuring the number of restrictions at the state level. We examine this heterogeneity for animal producers as a whole, without disaggregating by animal type, because of insufficient granularity in the data at the state level. Nevertheless, these results reveal stark differences in the amount of restrictions by state.
In making these contributions, we also seek to introduce a novel dataset to the agricultural economics literature. The restriction counts in RegData offer a number of advantages over other, previously used metrics quantifying regulation at the macrolevel. For example, prior research has used pages published in the Federal Register to proxy regulations, except the Federal Register includes parts that actually remove regulations and thus make it a poor measure (Al-Ubaydli and McLaughlin, Reference Al-Ubaydli and McLaughlin2017). Other metrics include the size of a statute document or the number of federal employees assigned to regulatory activities (GAO, 1996). Another key advantage to RegData is that the restrictions are an annual, industry-specific panel, which makes it possible to track the accumulation of regulations across industries. In contrast, prior research has tended to rely on cross-sectional proxies (Al-Ubaydli and McLaughlin, Reference Al-Ubaydli and McLaughlin2017). RegData covers the Code of Federal Regulations (CFR) from 1970 to 2019, so we can use the restriction counts to assess relative changes in animal protein industry regulations over nearly a half century.
The remainder of this article is structured as follows. In Section 2, we provide background on food regulations and the CFR. Section 3 introduces the methodology used to quantify regulatory restrictions across supply chains. In Section 4, we present the results, and Section 5 discusses these results. Section 6 concludes.
2. Background
From the onset of U.S. food safety standards and regulations, most meat products have been regulated differently than other food products. The first major federal food policy initiatives were the Pure Food and Drug Act of 1906 and the Meat Inspection Act of 1906. Whereas the Pure Food and Drug Act established the U.S. Food and Drug Administration (FDA) and gave the agency overarching authority to regulate food products, the Federal Meat Inspection Act—signed into law the same day—gave the USDA the jurisdiction to inspect cattle, hog, poultry, sheep, and goat slaughtering and processing (Fortin, Reference Fortin2017).
Advancements in refrigeration technology shifted consumption patterns and raised the standard of living in the United States, leaving the Pure Food and Drug Act obsolete shortly after it was passed. In 1938, Congress passed the Food, Drug, and Cosmetic Act (FD&C Act) of 1938, which still serves as the foundation for food law. The FD&C Act has been amended over 100 times since it was passed in 1938 (Fortin, Reference Fortin2017), with the most significant amendment being the Food Safety Modernization Act (FSMA) of 2011. The FSMA offered seven substantial changes to the FD&C Act of 1938, including measures to prevent foodborne outbreaks, subdue intentional adulteration of food products, and improve sanitary transportation requirements (Strauss, Reference Strauss2011; Thatte, Reference Thatte2019). Other significant amendments to the FD&C Act include the Food Additive Amendment of 1958, the Color Additive Amendment of 1960, and the Nutritional Labeling and Education Act of 1990 (Fortin, Reference Fortin2017).
The Federal Meat Inspection Act of 1906 has also been amended significantly. Most notably, the Wholesome Meat Act of 1967 was introduced to prevent the adulteration and misbranding of meat products and to ensure the slaughter and processing of meat and meat products occurred in sanitary conditions (Fortin, Reference Fortin2017). Additional food policies governing the regulation of the meat industry include the Poultry Products Inspection Act of 1957, the Egg Products Inspection Act of 1970, and the Humane Methods of Livestock Slaughter Act of 1978 (USDA-FSIS, 2016).
Importantly, while most cattle, hog, poultry, egg, sheep, and goat products are regulated by the USDA-FSIS, aquaculture and seafood fall predominantly under the FDA’s jurisdiction; and the FDA is currently a sub-division of the Department of Health and Human Services (HHS)—not the USDA-FSIS. Thus, while the overarching goals of the FDA and USDA-FSIS are nearly identical, aquaculture is subject to different regulations than most other protein sources. In other words, amendments made to the FD&C Act affect the aquaculture industry, but do not directly restrict the other meat industries, for which amendments must be made to the USDA-FSIS policies (e.g., Federal Meat Inspection Act). In addition, the regulatory jurisdiction does not always fall entirely on one agency. Indeed, the overlapping framework may be intentional, mitigating regulatory loopholes and capturing the decentralized expertise amongst various agencies. For example, in addition to regulation from the FDA under the Department of HHS, the aquaculture industry is regulated by the USDA, the EPA, the National Oceanic and Atmospheric Administration (NOAA), the U.S. Fisheries and Wildlife Service (FWS), the Animal and Plant Health Inspection Service (APHIS), and others (FAO, 2021b).
It is also critical to summarize how statutes passed by Congress and signed into law by the President are converted into the regulations. When federal policy is signed into law, the statutes are codified into the United States Code. These statutes are then announced as regulations, subject to the interpretation of the federal agency with presiding jurisdiction. These regulations must then be codified into the CFR. However, prior to final publication of the regulations, an initial ruling is published in the Federal Register. The initial ruling outlines the agency’s interpretation of the statute and describes the rules, protocols, and procedures for compliance. Once the initial ruling is posted, industry stakeholders and the general public are given notice of the proposed regulations. There is then a period for comment and clarification, after which the initial ruling is revised. Following revisions, the final ruling is published, an effective date is declared, and the regulation is officially codified in the CFR. Thus, while the statutes receive significant media attention when they are signed into law, codifying the regulations enforcing these statutes into the CFR can take several years.
In addition to federal laws enacted by Congress and the regulations authorized by these administrative agencies, states can legislate food policy. This authority is generally granted under the police powers provided to states by the Federalist system (Fortin, Reference Fortin2017), which ensures states are allowed to enact legislation to protect consumer health and welfare. However, state laws may be deemed unconstitutional if they interfere with interstate commerce, an authority given to the federal government (Sumner, Reference Sumner2017). In other words, if the state policy is shown to affect the production, distribution, or market prices outside of the state, the policy could be struck down by the courts (Fortin, Reference Fortin2017). Legal battles over policies such as California’s Assembly Bill 1437 for cage-free eggs (Carter, Schaefer, and Scheitrum, Reference Carter, Schaefer and Scheitrum2021) and Vermont’s call for mandatory labeling on genetically engineered food (Kolodinsky and Lusk, Reference Kolodinsky and Lusk2018) have reinvigorated the discussion surrounding the Commerce Clause. Nonetheless, since states have the ability to enact legislation on health, safety, and consumer welfare as it relates to food, food regulations are likely to vary across state borders.
The federal policies regulating food systems are complex and interconnected in an effort to protect the consumer and prevent regulatory loopholes. Further, state and local governments may regulate food systems more stringently than the federal government. Thus, there is significant merit in understanding the evolution of regulations as they pertain to food systems, comparing regulations across different supply chains, and examining the heterogeneity in regulations at the state level.
3. Data and Methods
We measure regulatory restrictions as the accumulation of words in federal and state law that indicate restrictions and requirements in a particular industry. Within the scope of our analysis, these “regulatory restrictions” come from two datasets of industry-specific regulations produced by the Mercatus Center: State RegData 2.0, and RegData 3.2. State RegData 2.0 counts each instance of a binding restriction that appears in the published rules and guidelines contained in the laws of 43 states plus the District of Columbia. RegData 3.2 is very similar, except that it counts each instance of a binding federal restriction that appears in the U.S. CFR. Each time a word indicating a restriction or requirement appears in the regulatory text (i.e. the words shall, must, may not, prohibited, and required), that word is counted as a regulatory restriction. RegData 3.2 also contains an index of restrictions at the four-digit North American Industry Classification System (NAICS) level, constructed by multiplying the number of restrictive words by a measure of industry relevance. Industry relevance is itself measured using a machine-learning algorithm trained on industry-specific publications in the Federal Register, which includes documents labeled with the relevant NAICS code and a writing style similar to the CFR. The algorithm identifies words, phrases, and other document features most closely associated with an industry’s NAICS code or name, which helps determine when a unit of text is relevant to an industry. The association between a NAICS industry and document features is modeled using a logistic function. When applied to the CFR, this function calculates the probability that a federal law is relevant to a NAICS industry. Regulatory restrictions are thus probability-weighted by their industry relevance and summed by industry. For further details on the methodology of calculating restrictions and industry relevance, see McLaughlin & Sherouse (Reference McLaughlin and Sherouse2019).
The restriction counts in RegData offer a number of advantages over previously used metrics quantifying regulation at the macro level such as counting the total number of pages published in the Federal Register to proxy regulations, examining the size of a statute document, or calculating the number of federal employees assigned to regulatory activities (Al-Ubaydli and McLaughlin, Reference Al-Ubaydli and McLaughlin2017; GAO, 1996). Further, RegData provides an annual, industry-specific panel rather than a cross-sectional proxy, allowing researchers to track the accumulation of regulations across industries. RegData covers the CFR from 1970 to 2019, so we can use the restriction counts to assess relative changes in animal protein industry regulations over the past half-century.
Using RegData, we examine the accumulation of federal regulatory restrictions down the animal production industry’s value chain. We mean “downstream” in the sense that processed animal protein is an intermediate input that increases in value (as measured by wholesale and retail margins) as it moves through the value chain from the rancher or farmer to the consumer. We refer to the restrictions associated with these activities as direct restrictions.
We calculate direct restrictions at the federal level in six animal protein industries: cattle ranching and farming, hog and pig farming, chicken and egg production, sheep and goat farming, aquaculture, and other animal production. These industries correspond to NAICS codes 1121, 1122, 1123, 1124, 1125, and 1129, respectively. We then calculate direct restrictions in the animal processing, wholesale distribution, and retail sales industries, which correspond to NAICS codes 311X (which includes sectors 3116 and 3117), 4244 and 4451, and through which most animal protein products pass before reaching consumers. This is similar to the approach of Malone and Chambers (Reference Malone and Chambers2017), who measured federal regulatory restrictions that apply to both the three-tier beer distribution system (i.e., brewing, wholesale distribution, and retail distribution). In a follow-up study using a similar methodology, Staples et al. (Reference Staples, Chambers and Malone2021) extended this analysis to the regulations promulgated by individual states, using State RegData to measure state regulatory restrictions that apply to both the beer value chain and the inputs needed to produce these goods and services.Footnote 3 This article expands on this methodology to study regulations in animal protein production, counting direct restrictions across four-tier animal protein distribution systems (i.e. production, processing, wholesale distribution, and retail sales).
It is also possible to use RegData to estimate the “upstream” regulations that apply to an industry’s supply chain. We refer to these as indirect restrictions because they affect inputs to animal production rather the animal producers or processors themselves. Following Chambers et al. (Reference Chambers, Collins and Krause2019), Footnote 4 Malone and Chambers (Reference Malone and Chambers2017), and Staples et al. (Reference Staples, Chambers and Malone2021), we calculate upstream regulations using I–O commodity weights from the Bureau of Economic Analysis (BEA) to weight the regulatory restrictions that apply to each industry that produces the inputs required by that industry’s supply chain. Specifically,
 $${\rm{Reg}}_{j,t}^{{\rm{indirect}}} = \sum\nolimits_i {{\alpha _i} \cdot \,} {\rm{Reg}}_{i,t}^{{\rm{direct}}}$$
estimates the total indirect federal restrictions that apply to industry j (i.e., animal protein production, processing, wholesale or retail distribution) in year t; i is the index of supply chain industries that supply inputs to industry j; ${\alpha _i}$
are I–O commodity weights from the BEA renormalized to sum to one; and
${\alpha _i}$
are I–O commodity weights from the BEA renormalized to sum to one; and ${\rm{Reg}}_{i,t}^{{\rm{direct}}}$
are the direct federal restrictions for industry i in year t as reported by RegData.
${\rm{Reg}}_{i,t}^{{\rm{direct}}}$
are the direct federal restrictions for industry i in year t as reported by RegData.
Next, we use State RegData and the input-output parameters to estimate the number of direct and indirect restrictions at the state level. The granularity of the industry regulation data provided by State RegData is limited to the NAICS three-digit level. We therefore use NAICS code 112 (“animal production and aquaculture”), which aggregates the four-digit industries of interest. State RegData is limited to regulations in 2020 only. Thus, all of the state-level regulations are limited to the aggregate animal production industries in 2020. The state indirect restrictions that apply to industry j (i.e., animal protein production, processing, wholesale, or retail distribution) in state h are
 $${\rm{Reg}}_{j,h}^{{\rm{indirect}}} = \mathop \sum \nolimits_i {\alpha _i} \cdot {\rm{Reg}}_{i,h}^{{\rm{direct}}}$$
where i is the index of industries that supply inputs to industry j; ${\alpha _i}$
are the I–O commodity weights; and
${\alpha _i}$
are the I–O commodity weights; and ${\rm{Reg}}_{i,h}^{{\rm{direct}}}$
are the direct state restrictions for industry i in state h as reported by State RegData. For the sake of comparison, we also estimate the direct and indirect federal restrictions of all animal production and aquaculture (NAICS 112) as of 2019.
${\rm{Reg}}_{i,h}^{{\rm{direct}}}$
are the direct state restrictions for industry i in state h as reported by State RegData. For the sake of comparison, we also estimate the direct and indirect federal restrictions of all animal production and aquaculture (NAICS 112) as of 2019.
The BEA data are derived from the economic census (latest data are from 2012; see BEA, n.d.b) and are reported as “The Use Table (Supply-Use Framework), 2012,” which records the dollar value of inputs from private and public entities and industries used as intermediate inputs to produce the output of an industry.
Footnote 5
After removing inputs from all non-private sector industries (i.e., federal, state, and local government enterprises)
Footnote 6
that provided less than 1.11% of all inputs, we normalized the remaining inputs to add to one (i.e. expressed as value-weighted inputs).
Footnote 7
Each industry’s final inputs weights, ${\alpha _i},$
are presented in the Appendix accompanying this manuscript.
Footnote 8
${\alpha _i},$
are presented in the Appendix accompanying this manuscript.
Footnote 8
Regulatory restrictions should be interpreted as a proxy rather than a full measure of regulatory cost. Counting restrictions provides no information on the intensity of a particular regulation, which could be restrictive or lax in practice. For example, our approach treats a regulation stating “the maximum line speed is 1,106 pigs per hour” as equivalent to a regulation stating “the maximum line speed is 2,212 pigs per hour,” even though the former is more restrictive than the latter.Footnote 9 Due to the paucity of research tying measures of regulations to actual regulatory costs, it is not possible to measure how closely regulatory restrictions correlate with regulatory burden. However, research on RegData finds that the number of restrictions declines in industries going through a period of deregulation, including air transportation and the Airline Deregulation Act of 1978, which shows that regulatory restrictions parallel actual regulatory trends and, by implication, regulatory costs (Al-Ubaydli and McLaughlin, Reference Al-Ubaydli and McLaughlin2017).
4. Results
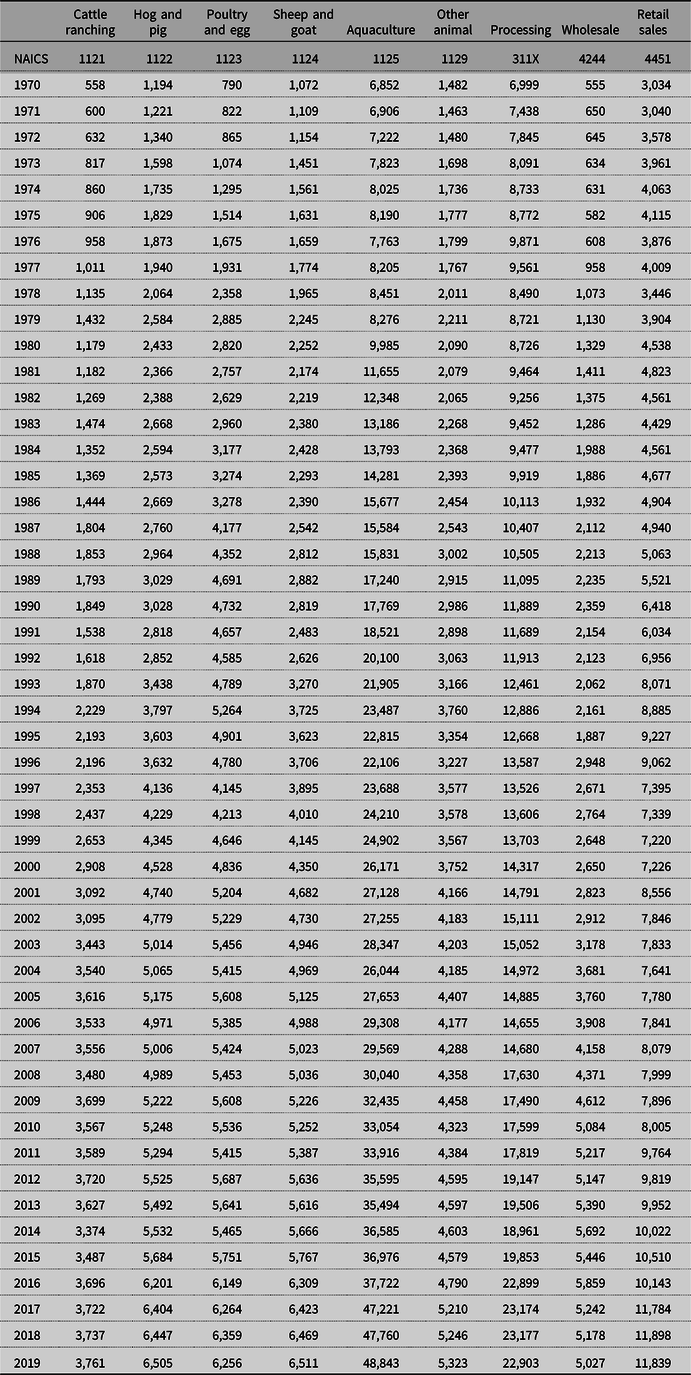
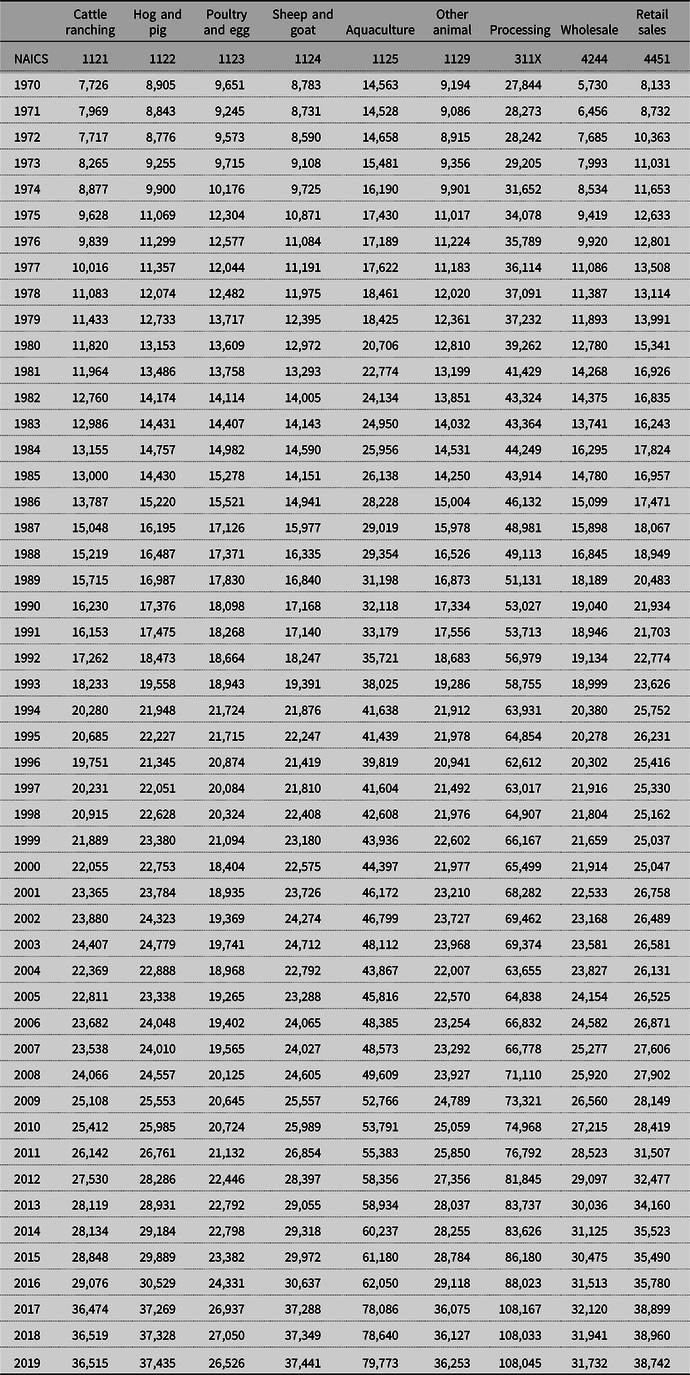
Table 1 presents the number of direct restrictions at the federal level over time. Column one presents the regulatory year, columns two through seven correspond to the individual production industries, and columns eight through ten present the number of downstream restrictions in the processing, wholesale, and retail sales industries, respectively. These estimates show that in 1970, cattle ranching was subject to 558 direct restrictions, 1,194 restrictions in hog and pig farming, 790 restrictions in poultry and eggs, 1,072 restrictions in sheep and goat farming, 6,852 restrictions in aquaculture, and 1,482 restrictions in other animal production. In 2019, there were 3,761 direct restrictions in cattle ranching, 6,505 restrictions in hog and pig farming, 6,256 restrictions in poultry and eggs, 6,511 restrictions in sheep and goat farming, 48,843 restrictions in aquaculture, and 5,323 restrictions in other animal industries. Thus, between 1970 and 2019, the estimated number of direct restrictions increased substantially in every production industry. If we pool industries based on three-digit NAICS codes to reduce double-counting regulations, then over this period regulatory restrictions in animal protein value chain increased 330%.
Table 1. Number of direct restrictions across animal protein value chains
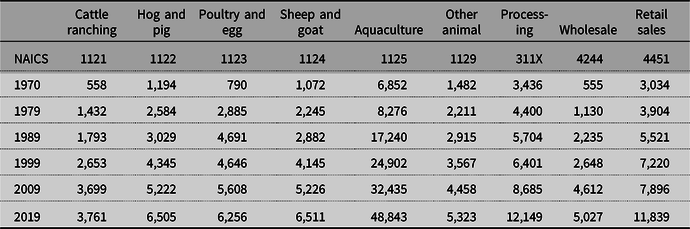
Note: Yearly federal direct regulatory restrictions for each industry are presented in Table A2 of the Appendix accompanying this manuscript.
The largest change in regulatory restrictions occurred in the aquaculture industry. We find an increase of more than 40,000 regulations between 1970 and 2019, more than a 600% increase. Additionally, aquaculture has the largest share of federal direct restrictions, and this share is growing. Figure 1 shows direct restrictions in each production industry as a share of the total number of regulations across all six industries. As the figure illustrates, since 1970, on average, more than 50% of direct restrictions associated with animal protein production can be linked to aquaculture, and since 2017 the share linked to aquaculture has exceeded 60%.
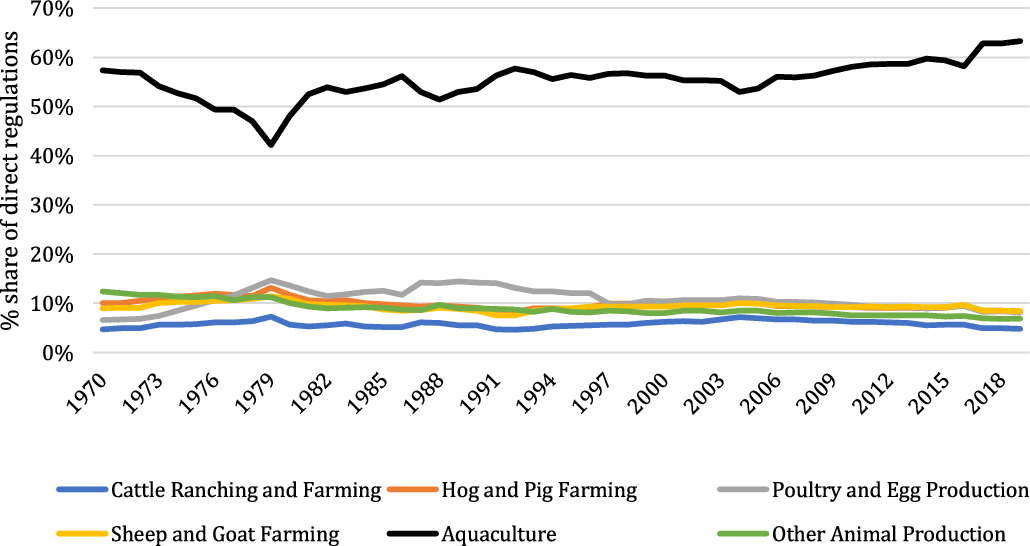
Figure 1. Estimated share of direct restrictions in federal law in different animal protein industries.
There are also important relative changes among the other industries. Focusing on producers, the largest proportional increase—nearly 700%—in direct regulations between 1970 and 2019 is associated with poultry. Downstream, however, direct regulations associated with wholesale distribution increased 800%. Thus, when considering the entire value chain, federal direct regulations increased the most in the wholesale industry.
These trends change little when assessed in terms of the total number of regulatory restrictions, including direct and indirect regulations. Table 2 presents the total number of regulatory restrictions at the federal level for each industry, while Figure 2 plots the changes in restrictions over time for each of the six animal industries (four-digit NAICS code).
Table 2. Total number of direct and indirect restrictions across animal protein value chains
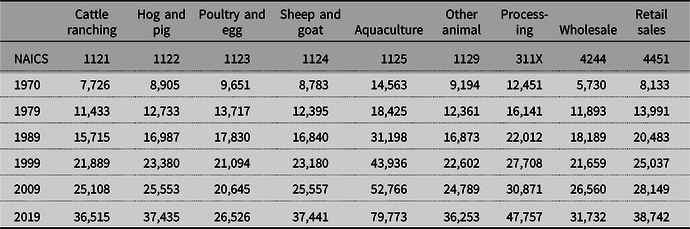
Note: Yearly federal direct and indirect regulatory constraints for each industry are presented in Table A3 of the Appendix accompanying this manuscript.
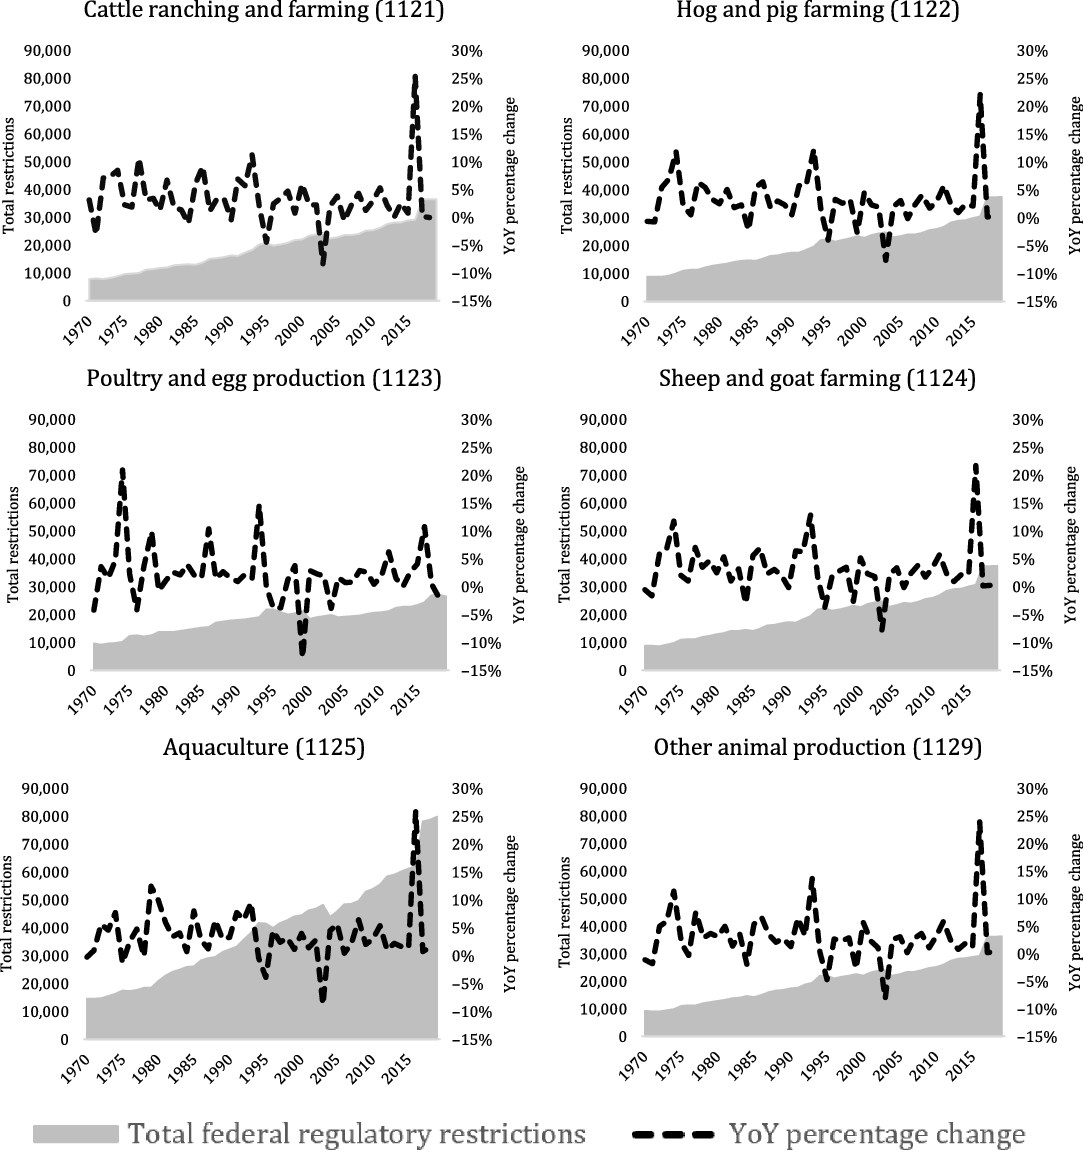
Figure 2. Regulatory restrictions by animal industry (four-digit NAICS) over time and year-over-year (YoY) percentage change by industry.
In general, total regulatory restrictions follow similar patterns of regulation and deregulation across industries over time. For instance, each industry sees significant increases—as much as a 25% increase year-over-year—in regulatory restrictions in 2017, coinciding with the final rulings on Mitigation Strategies to Protect Food Against Intentional Adulteration (21 CFR 11; 21 CFR 121) and Sanitary Transportation of Human and Animal Food (21 CFR 11), two components of the FDA Food Safety Modernization Act passed in 2011.Footnote 10 As before, the largest overall increase in restrictions across the 50-year period is associated with aquaculture, although there is also a large relative change in the wholesale industry. However, the relative increase in restrictions associated with poultry is less pronounced than before, which indicates that indirect restrictions associated with poultry production have changed relatively little over the period of study. In contrast, the relative increase in restrictions associated with aquaculture is greater than before, which indicates that indirect restrictions associated with aquaculture production have increased more than restrictions in some other production industries (e.g. poultry).
Considering restrictive regulatory language at the state level, Table 3 presents the number of direct restrictions associated with animal production, animal processing, wholesale distribution, and retail sales. Recall, we cannot estimate the direct restrictions in each production industry (e.g. cattle ranching, pigs, and poultry) because State RegData only records regulatory restrictions at the three-digit NAICS level, while the production industries are at the four-digit level. The estimates thus provide a sense of the variability in direct restrictions associated with animal production at the state level, which appears to be substantial. Table 3 shows that the number of direct restrictions associated with all animal production ranges from a low of 64 to a high of 12,324—a relative difference of nearly 2,000%. The average is 3,939, with a standard deviation of 2,199. There is modest correlation between the number of direct restrictions associated with animal production and the numbers associated with animal processing (ρ = 0.186), wholesale distribution (ρ = 0.211), and retail sales (ρ = 0.525), which implies that states with a relatively large number of direct regulations in one industry tend to have relatively more regulations overall. This pattern of heterogeneity suggests important differences in how states have written their laws. Generally, these differences are less pronounced between neighboring states and correlate with population and the level of economic activity. For example, South and North Dakota have the lowest numbers of direct regulations associated with animal production, compared to Oregon, Washington state, and California with the highest numbers.
Table 3. Number of direct regulations by industry (3-digit NAICS code) at the state and federal level
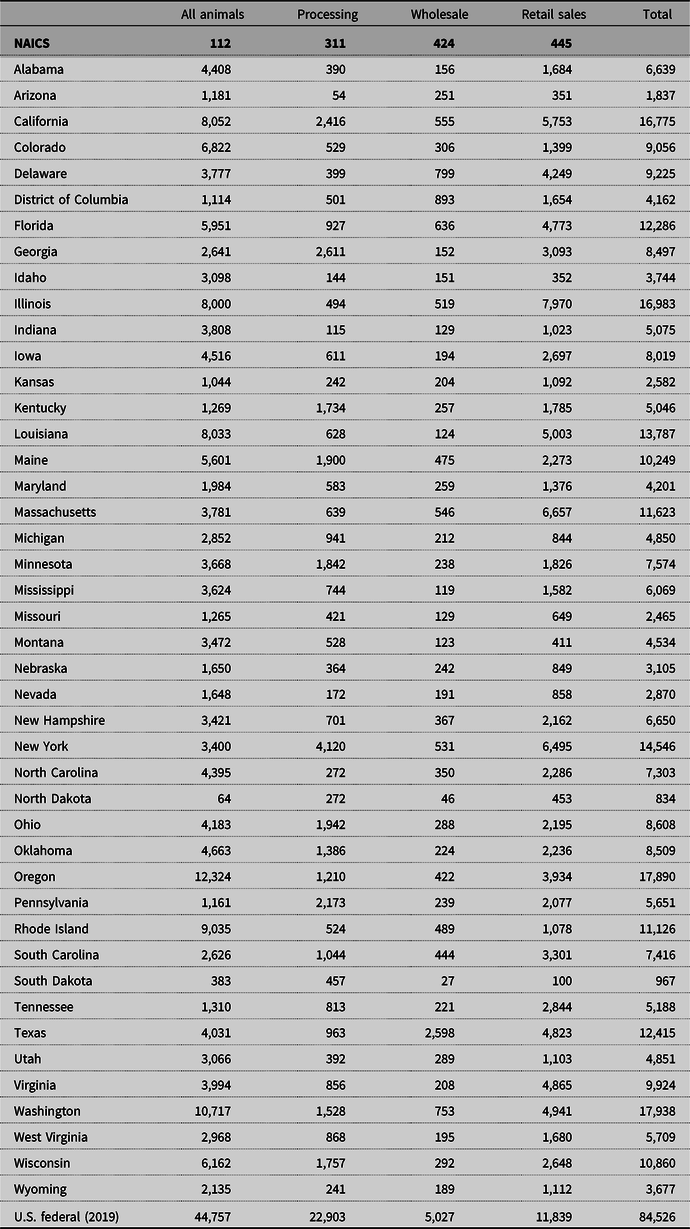
Table 4 presents the total (direct and indirect) restrictions by industry (3-digit NAICS code), and Figure 3 presents these results graphically. The range of total restrictions associated with animal production is between 715 (North Dakota) and 18,010 (Oregon); between 885 (North Dakota) and 21,570 (Oregon) for processing; between 246 (South Dakota) and 8,221 (Texas) for wholesale; and between 325 (South Dakota) and 12,234 (Illinois) for retail. The estimates reveal that states with a lower number of direct regulations tend to have fewer total regulations. Indeed, if we ranked states by regulatory restrictions associated with animal production, the rankings would change little if we used direct rather than total restrictions, as there is a high degree of correlation between direct and indirect restrictions (ρ = 0.983). Setting aside animal processing, for which animal production is a key input, the total number of regulatory restrictions associated with animal production is greater than that of wholesale distribution and retail sales. Further, 73% of states in our data set (32 of 44 jurisdictions) have more restrictions associated with animal production than wholesale and retail sales. However, there are more total regulatory restrictions associated with animal processing than any of the other three-digit industries, although this is driven mainly by indirect restrictions.
Table 4. Number of total direct and indirect restrictions by industry (3-digit NAICS code) at the state and federal level

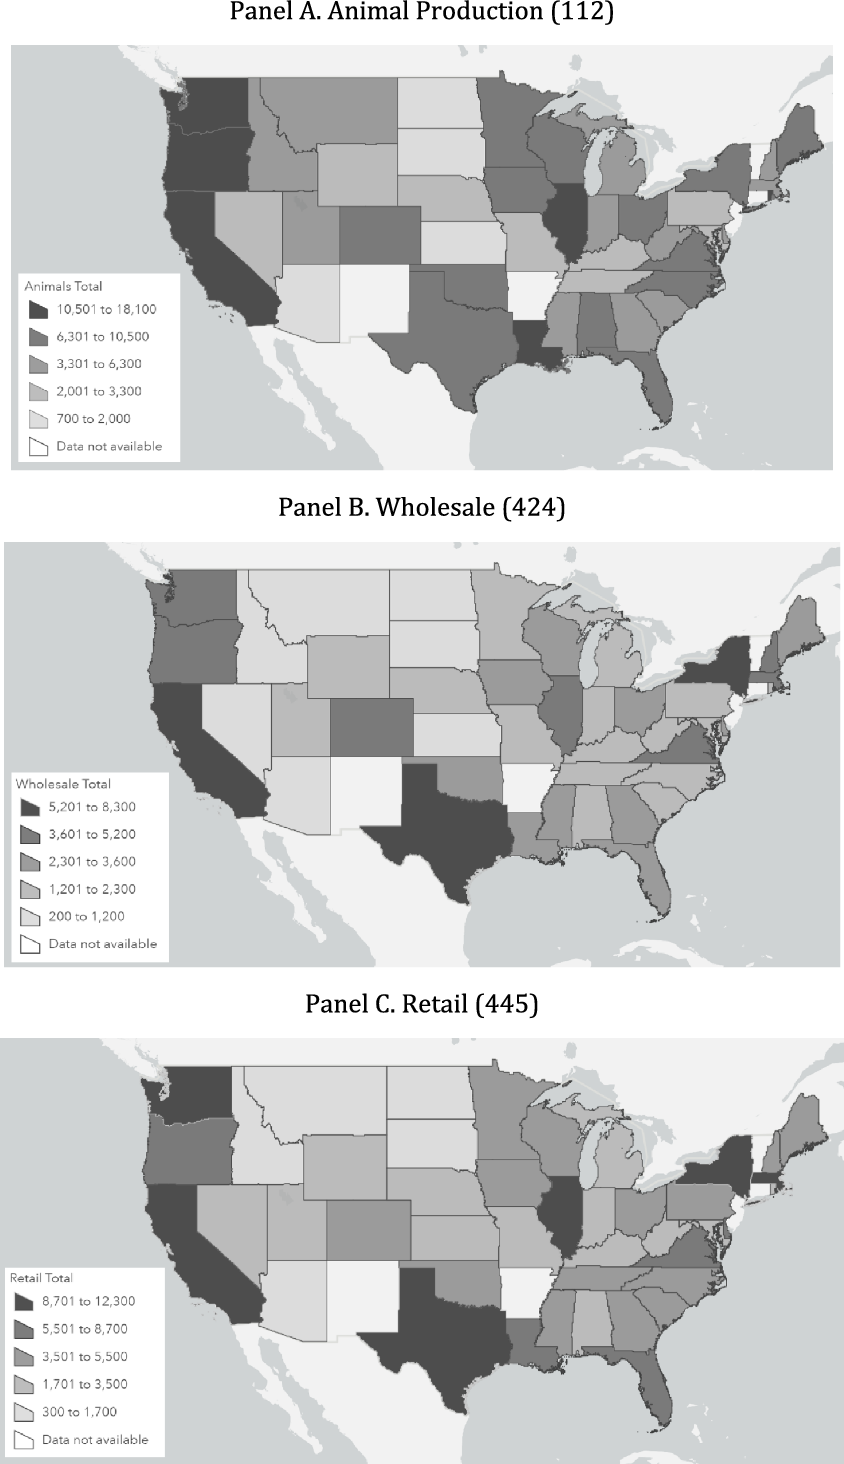
Figure 3. Total direct and indirect regulatory restrictions by industry (3-digit NAICS code) by state.
Our estimates indicate a larger number of restrictions at the federal level than at the state level. The last row of Tables 3 and 4 include the estimates of direct and total restrictions at the federal level for each of the three three-digit NAICS industries, respectively. In every industry category, the number of federal restrictions exceeds the number of restrictions in any state, including direct and total restrictions.
5. Discussion
The result that direct restrictions associated with the animal protein value chain have increased by more than a factor of three needs to be taken in context. When computed on an annualized basis, this result implies a 3% per year increase in direct restrictions across the value chain. This exceeds the increase in overall regulatory restrictions in the CFR since the 1970s, which have grown about 2% per year, although it is lower than the increase in EPA-related regulations, which have grown 5% per year (McLaughlin and Sherouse, Reference McLaughlin and Sherouse2019). Nevertheless, there can be substantial variation in regulation growth between individual industries, and comparison with prior research suggests that regulation in the animal protein value chain as a whole is intensifying faster than in many other industries (Al-Ubaydli and McLaughlin, Reference Al-Ubaydli and McLaughlin2017; Malone and Chambers, Reference Malone and Chambers2017). Moreover, by breaking down regulatory restrictions by industry sector, our results show that restrictions are growing fastest in the wholesale distribution, poultry, and aquaculture industries, while restrictions associated with animal processing and retail sales growing at rates closer to the overall average.
The results reveal differences in the numbers of regulatory restrictions at the federal level associated with animal production industries, numbers that appear relatively modest in the context of one exceptionally striking case. The number of federal restrictions has risen steadily since 1970, across all animal production industries, which likely reflects a general increase in the body of federal law with ties to agriculture and food production. Between cattle ranching, pig farming, poultry and egg production, sheep and goat farming, and other animal industries, there are an estimated 3,701–6,511 direct restrictions, depending on the industry, as of 2019. These differences may be important, but they appear modest when compared to an estimated 48,843 direct regulations associated with aquaculture in 2019. Indeed, we find that for nearly the last half a century, the number of direct and total regulations associated with aquaculture has been approximately double the number of regulations in the other five: cattle ranching, pig farming, poultry and egg production, sheep and goat farming, and other animal industries.
These estimates lend credibility to calls to reduce regulatory costs in aquaculture (Engle et al., Reference Engle, van Senten and Fornshell2019). In federal law, more regulatory restrictions are associated with aquaculture than with other industries, including downstream industries associated with consumer safety (i.e., retail sales) and animal production industries that, like aquaculture, have raised concerns about environmental impact (e.g. poultry and egg production). The disparity in these estimates is consistent with claims by some aquaculture industry stakeholders and public officials that overlapping federal agency responsibilities make aquaculture regulations difficult to navigate. While we lack the data to investigate whether this is also true for aquaculture at the state level, we do, however, find evidence that state law has more regulatory language associated with animal production as a whole industry than with wholesale distribution and retail sales, which suggests that regulations at the state level could still disproportionately affect animal producers (including aquaculture) more than is generally the case with other industries. However, the relative differences between industries at the state level are smaller than the relative difference between aquaculture and other industries at the federal level.
One explanation for additional regulation of aquaculture is the industry’s reliance on large amounts of water and varied sources of pollution risk. In the United States, water pollution regularly tops the list of public concerns (Sheth, Reference Sheth2019), putting continuous pressure on federal policy makers to develop and revise laws to limit and clean up sources of wastewater. Aquaculture can affect water quality through discharges of fish manure, feed waste, antibiotics, and outbreaks of fish disease. Fish can be raised in near-shore, pond, flow-through, and tank-based production systems, each of which can come with a unique set of water quality concerns and controls, and thus contribute to a larger and more complex of set of regulations than those experienced by other livestock operations. Indeed, research finds water quality regulations create among the most salient regulatory costs in the aquaculture industry (Engle et al., Reference Engle, van Senten and Fornshell2019). A related explanation for additional regulation of aquaculture is that in addition to the FDA and the USDA, which monitors compliance with animal production laws, aquaculture with point-source discharge is subject to monitoring by the EPA and marine aquaculture is subject to monitoring by the NOAA. Put simply, the greater number of restrictions associated with aquaculture could be due to a mix of environmental and food law.
Our results also indicate that a large number of regulatory restrictions at the state level can potentially affect production and distribution of animal products. Including direct and indirect regulations, there are, on average, several thousand state restrictions associated with animal production, as well as with animal processing, wholesale distribution, and retail sales. However, these results do not imply that states with more restrictions are worse off in terms of production. In fact, comparing cash receipts in various animal production sectors with direct restrictions at the state level, we find correlations close to zero.Footnote 11 This insight may have important implications for our estimates of federal restrictions, because the differences in restrictions between states are generally larger than the estimates of federal restrictions between industries. The states with the most restrictions have many thousands more restrictions than the states with the fewest. Explaining these differences goes beyond the scope of this article, but the number of regulatory restrictions clearly correlates with the amount of economic activity in a state.Footnote 12 Thus, we think much of the heterogeneity in regulatory restrictions is tied to legislatures’ responses to increasingly complex state economies.
Of course, our estimates of state-level restrictions up and down the value chain should be interpreted carefully. Thousands of regulatory restrictions affect production of beef, pigs, chickens, and other animals, and the number of these restrictions vary greatly by industry and state. Among the sectors we examined, at the federal level, aquaculture appears to be the most regulated. However, as noted above, regulatory restriction counts do not definitively indicate that certain industries or states may be “overregulated” or insufficiently regulated. To highlight this point by way of example, we compare estimates of total regulations associated with animal production in Michigan and Missouri: there are more than twice as many regulations in Michigan (2,852) than in Missouri (1,265) as well as more regulations associated with wholesale distribution and retail sales in Michigan; yet compared with Michigan, Missouri is not considered to have a better regulatory environment. In fact, at least one ranking places Michigan at the top in terms of regulatory relief (Ruger and Sorens, Reference Ruger and Sorens2009). Thus, the large number of federal restrictions associated with aquaculture should be interpreted with caution, as regulatory costs may not be restricting growth in industry as much as the estimates appear to suggest.
It should also be noted that regulations are often intended to solve problems and can be good for producers and economic activity. Legal restrictions can be valuable because they protect consumers, protect the environment, define property rights, track economic activity, etc. States and the federal government can thus use restrictions to promote as much as to restrain business, and more restrictions need not imply that a sector or industry is overregulated.
6. Conclusion
Food regulations protect the consumer, mitigate environmental concerns, and promote animal welfare, but they can also hinder innovation, limit entrepreneurship, and generate higher consumer prices (Carter et al., Reference Carter, Schaefer and Scheitrum2021; Malone and Lusk, Reference Malone and Lusk2016a, Reference Malone and Lusk2016b; McCluskey, Wesseler, and Winfree, Reference McCluskey, Wesseler and Winfree2018; Mullally and Lusk, Reference Mullally and Lusk2018). Despite an extensive literature on the unintended consequences of regulations, few studies have investigated regulatory restrictions across supply chains. We use Mercatus Center’s RegData and State RegData databases to explore regulatory restrictions across various protein supply chains, including beef, pig, poultry, sheep, goat, and seafood. Results suggest that, between 1970 and 2019, the total number of regulatory restrictions at the federal level increased significantly for each protein source, with aquaculture appearing to be the most heavily affected. Further, our results highlight the extreme heterogeneity in the way states regulate animal protein supply chains.
Food policy and food system resiliency have received heightened attention due to the COVID-19 pandemic (Rivera-Ferre et al., Reference Rivera-Ferre, López-i-Gelats, Ravera, Oteros-Rozas, di Masso, Binimelis and El Bilali2021; Thilmany et al., Reference Thilmany, Canales, Low and Boys2021; Weersink et al., Reference Weersink, von Massow, Bannon, Ifft, Maples, McEwan and Wood2021), concerns over climate change (Hunter and Röös, Reference Hunter and Röös2016; Jalil, Tasoff, and Bustamante, Reference Jalil, Tasoff and Bustamante2020), enhanced food insecurity (Gundersen, Kreider, and Pepper, Reference Gundersen, Kreider and Pepper2017), and consumer sentiment for animal welfare (Clark et al., Reference Clark, Stewart, Panzone, Kyriazakis and Frewer2017). Our results demonstrate a patchwork approach to food regulation, which risks creating overlapping, cumbersome guidelines for food manufacturers and industry groups. Additionally, given the interconnectivity of modern food supply chains, the patchwork system can create additional hurdles for interstate commerce, particularly given the significant heterogeneity in food regulations across state boundaries. At a minimum, the cost of a regulation is a compliance cost—the cost of time to read, understand, and abide by the regulation, which can prevent market entry and hinder industry innovation—particularly in emerging, niche markets.
We identify two limitations to our methodology. First, given the lack of granularity of the data, we were unable to partition the state regulatory restrictions by animal protein source. While federal regulatory restrictions use the four-digit NAICS codes (e.g., NAICS 1121: Cattle ranching and farming), State RegData codifies on the three-digit NAICS level (NAICS 112: Animal production). While this limitation prevents a more thorough analysis of the regulatory restrictions at the state level, our analysis provides initial insights into the animal production regulatory patterns across the United States.
Secondly, RegData accounts only for the total number of regulatory restrictions as a proxy for regulatory burden and does not consider any qualitative components of the restrictions. In other words, our approach cannot measure the restrictiveness of each regulatory statement. We acknowledge that there is validity to this concern. Of course, incorporating a method to quality-weight regulatory statements based upon their restrictiveness would offer tremendous insight and enable us to better understand regulatory restrictions. However, no such quality-weighting method exists. Further, RegData offers a substantial improvement over the next-best alternatives (Al-Ubaydli and McLaughlin, Reference Al-Ubaydli and McLaughlin2017), which includes simply counting the total number of pages published in the Federal Register or using the size of digitized versions of statutes to measure regulations (Coffey, McLaughlin, and Tollison, Reference Coffey, McLaughlin and Tollison2012; Dawson and Seater, Reference Dawson and Seater2013; Mulligan and Shleifer, Reference Mulligan and Shleifer2005).
Despite these shortcomings, this article speaks to the changes in regulatory restrictions across protein supply chains over time as well as the heterogeneity among states. While unable to speak to the intensity or cost of each regulatory restriction, we capture the fact that protein supply chains have become subject to tens of thousands of regulatory restrictions. Future research is needed to examine the economic consequences of these regulatory restrictions. By examining changes in industry production practices, market prices, and consumer preferences after significant policy changes, future work could better answer the question of regulatory impacts.
Acknowledgments
The authors would like to thank the reviewers for their helpful comments and suggestions, as their feedback significantly improved the manuscript.
Author contributions
Conceptualization, T.M.; Methodology, D.C., R.T.M. and T.M.; Formal Analysis, D.C.;Data Curation, D.C.; Writing-Original Draft, A.J.S., D.C., R.T.M. and T.M.,Writing-Review and Editing, A.J.S., R.T.M. and T.M.; Supervision, R.T.M. andT.M.; Funding Acquisition, R.T.M. and T.M.
Competing interests
The authors declare no competing interests.
Data Availability Statement
Data will be made available upon request.
Financial support
This work was supported by the National Oceanic and Atmospheric Administration, Award ID 013253-00001.
Appendix
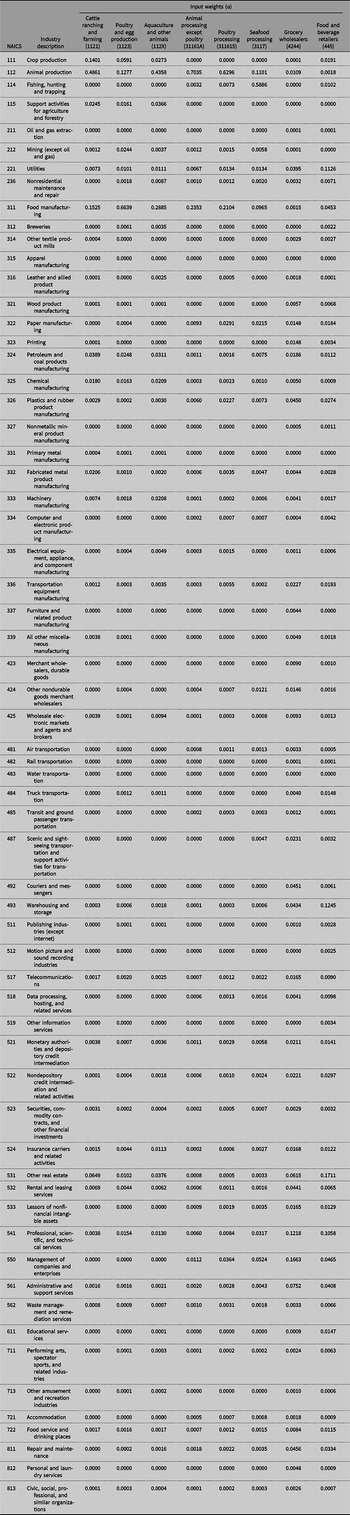
Table A1. I–O supply chain industry weights
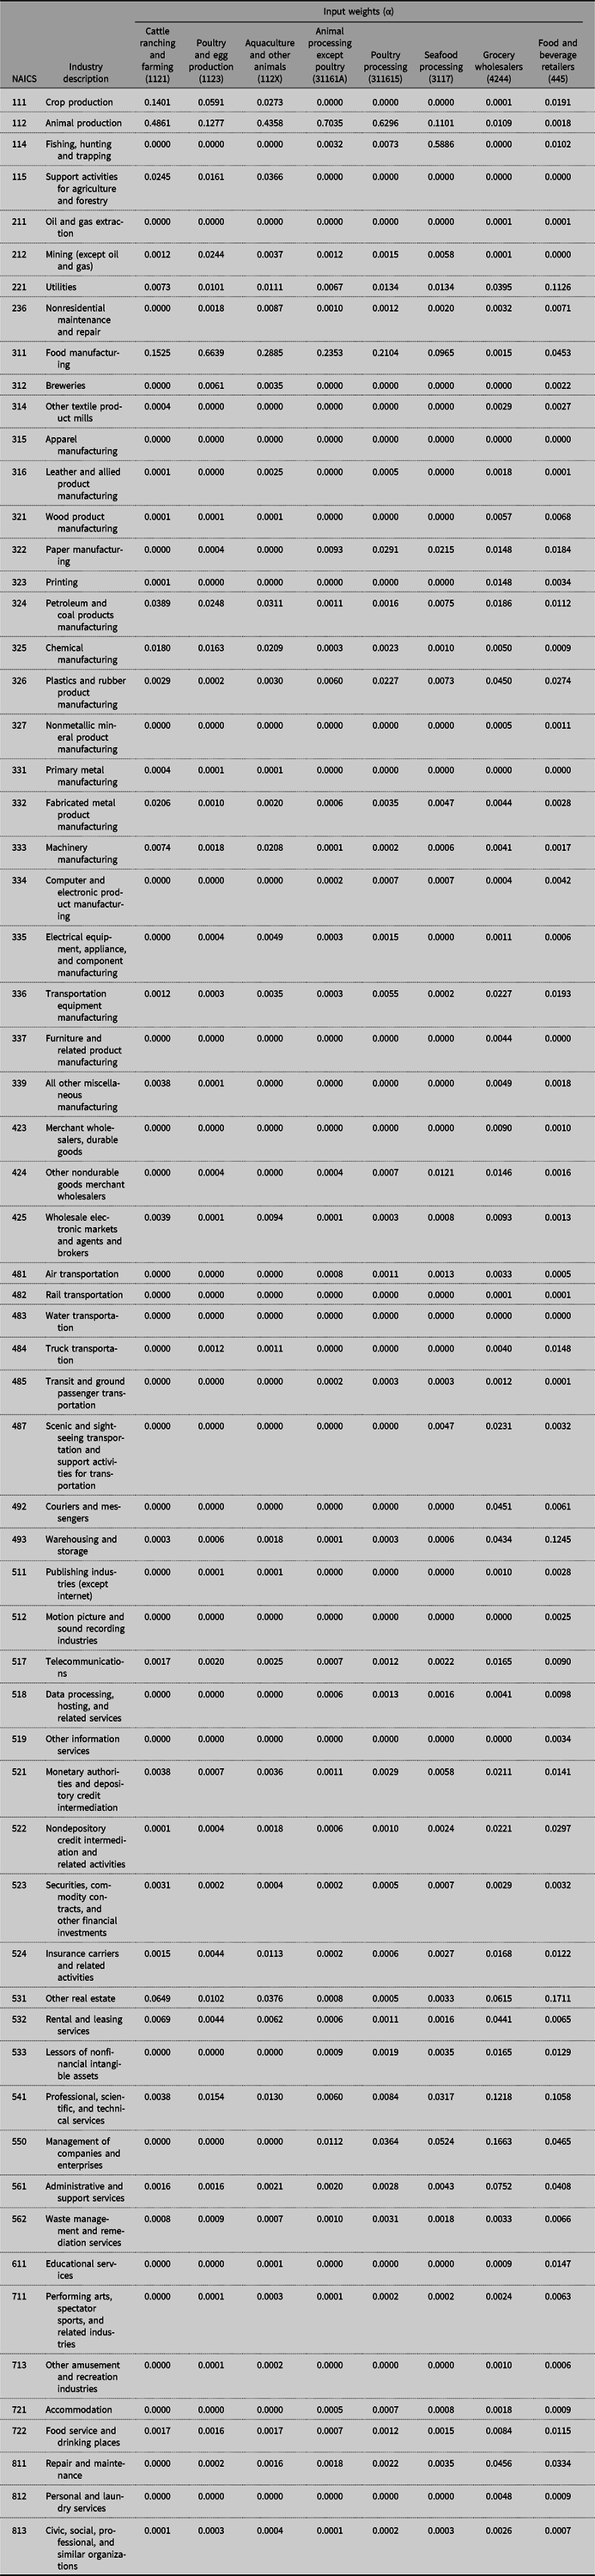
Note: The “X” in the header “Aquaculture & Other Animals (112X)” refers to the final digit of the four-digit NAICS code for: Hog and pig farming (1122); Sheep and goat farming (1124); Aquaculture (1125); and Other animal production (1126). Each of these sectors are assumed to follow the same input weighting.
Note: The “A” in the header “Animal Processing Except Poultry (31161A)” refers to the final digit of the six-digit NAICS code for: Animal (except poultry) slaughtering (311611) ; Meat processed from carcasses (311612); and Rendering and meat byproduct processing (311613). Each of these sectors are assumed to follow the same input weighting.
Table A2. Number of direct restrictions across animal protein value chains
Processing modeled using NAICS sectors 311611 to 311613, 311615, and 3117.
Table A3. Total number of direct and indirect restrictions across animal protein value chains
Processing modeled using NAICS sectors 311611 to 311613, 311615, and 3117.


 Open access