


1. Introduction
Since at least 1980, farm sole proprietors as a group have reported negative farm income for tax purposes, and over the last decade, both the share of farmers reporting losses and the amount of losses reported have increased (Williamson, Durst, and Farrigan, Reference Williamson, Durst and Farrigan2013). Using Internal Revenue Service (IRS) data, Williamson, Durst, and Farrigan found that nearly three out of every four farm sole proprietors reported a farm loss in 2010, as did about half of all farm partnerships and small farm business corporations. In aggregate, farmers reported $24 billion in losses in 2010. For those who reported a loss, the average loss was $18,079.
It should be noted that losses from farming are mitigated for some households by U.S. tax policy. Most farm businesses are organized such that farm income is “passed through” to the household and taxed at the individual level. Households can use reported farm losses to offset their nonfarm income and thereby lower their taxes. Using 2004 IRS data, Durst (Reference Durst2009) estimates that the $20.6 billion in farm business losses that were reported in 2004 reduced the federal income taxes owed by farm households by more than $3 billion. However, this calculation implies that net of the tax offsets, farm households in aggregate still incurred about $17.6 billion in farm losses.
The low income and widespread losses reported on federal income tax forms are consistent with farm income estimates derived from the Agricultural Resource Management Survey (ARMS)—the U.S. Department of Agriculture’s (USDA) primary source of information about farm income and farm household finances. According to ARMS data, from 2010 to 2016, the median farm had about $440,000 in farm assets, yet had farm income losses ranging from −$118 to −$2,250 (USDA, 2017).
What can explain the prevalence of negative or low returns in farming—particularly on smaller-scale operations? One possible explanation is that farmers enjoy large nonpecuniary benefits to farming—that is, they derive pleasure from the attributes of farm work that compensates for low returns. Farmers may enjoy the autonomy and independence of farming, the sense of responsibility and pride associated with business ownership, or other social or lifestyle attributes of farming (Howley, Reference Howley2015; Key, Reference Key2005; Key and Roberts, Reference Key and Roberts2009). Using ARMS data, Key and Roberts (Reference Key and Roberts2009) compared the returns to household labor for on-farm and off-farm work within same farm households. For all categories of farms considered, they found that households reported earning more per hour off-farm than they did on-farm, and this wage differential was larger for smaller farms. The reported wage differentials imply very large nonpecuniary benefits to farming—particularly for small farms.
A second possible explanation is that farmers tolerate low farm income because they expect to be compensated by robust appreciation of their farm assets—particularly farmland. If farmland appreciation is included in the return to farming, then effective returns are higher (Prager, Tulman, and Durst, Reference Prager, Tulman and Durst2018). However, individuals can benefit from farmland appreciation without working on-farm. In fact, 31% of all farmland and 80% of rented farmland is owned by nonoperator landlords (Bigelow, Borchers, and Hubbs, Reference Bigelow, Borchers and Hubbs2016). Because it is common for individuals to work outside of agriculture while also renting out farmland, asset appreciation does not appear to provide a reason for landowners to choose lower-paying farm work.Footnote 1
A third possible explanation for the widespread incidence of low and negative returns to farming, and the explanation explored in this article, is that many farmers underreport their farm income to the IRS and ARMS. The hypothesis is that households underreport their true farm income on tax forms in order to reduce their taxes and that they underreport in a similar way on USDA surveys to avoid a perceived risk to contradicting information on their tax form.Footnote 2 As discussed in more detail subsequently, direct audits by the IRS and indirect studies of tax evasion have consistently found that sole proprietorships, including farms, collectively underreport a substantial portion of their business income. However, information on the extent of underreporting by farmers is scant. Past studies have not disaggregated schedule F tax compliance by farm size or farm income category. Consequently, it is not clear from past studies whether the scale of noncompliance is sufficient to explain the pervasive farm income losses reported by small farms to the IRS and the ARMS.
The extent of farm income underreporting is estimated by exploiting the fact that similar households with the same true farm income face different incentives to underreport their farm income, depending on their off-farm income. More off-farm income means higher household income, all else being constant, which implies a higher marginal income tax rate. Several empirical studies have found that higher marginal tax rates result in higher levels of income underreporting (Clotfelter, Reference Clotfelter1983; Crane and Nourzad, Reference Crane, Nourzad and Slemrod1992; Feldstein, Reference Feldstein1995). In addition, assuming decreasing relative risk aversion, higher income implies a greater willingness to risk tax noncompliance (Allingham and Sandmo, Reference Allingham and Sandmo1972; Alm, Reference Alm2012). Hence, individuals will likely have an increasing incentive to underreport their true farm income as their nonfarm income rises.
Using 10 years of ARMS data (2006–2015), we econometrically estimate the relationship between reported farm income and reported off-farm income, conditional on farm assets, time spent working on-farm, and other factors. A household should have no incentive to hide farm income when its total household income is zero. Because there is no incentive to underreport farm income when reported household income is zero, reported off-farm income should equal the “true” farm income at this point. The predicted reported farm income at this theoretical point provides an estimate of true farm income.
In aggregate, the findings indicate that 39% of estimated true farm income is not reported on the ARMS—a rate that is in-line with past IRS audit studies. The estimate implies that reported farm income substantially understates the actual return to farming, especially after taking into account savings from tax offsets. Disaggregating by farm size, the findings also indicate that representative farms in all asset categories earn positive returns from farming when underreporting and tax offsets are accounted for. However, for the smallest farms, the average implicit farm wage remains well below the statutory minimum wage.
The findings are important because they imply that farm income is systematically underreported on ARMS and possibly other USDA surveys. This has implications for research seeking to explain differences in incomes or hourly wages between farm and nonfarm work (e.g., Fall and Magnac, Reference Fall and Magnac2004; Key and Roberts, Reference Key and Roberts2009). The findings suggest that reported values of farm income may understate true farm income in the United States and bias income comparisons with the nonfarm sector.
The findings also have implications for research that aims to explain farm household labor decisions. Such decisions are usually modeled as a trade-off between off-farm wages and implicit on-farm wages and the marginal utility of leisure. Empirical studies that estimate implicit on-farm wages using reported rather than true returns to farming could generate biased labor supply response estimates. In addition, the finding that greater off-farm income, and by implication greater off-farm labor supply, is correlated with how much farm income is reported introduces another potential source of bias into such analyses.
2. Income underreporting
Most farm businesses are organized such that they are taxed under individual income tax provisions. Sole proprietorships accounted for 90.7% of all farms and 56.6% of total sales for 2006 through 2015, according to data from the USDA ARMS. Most self-employed farmers file a schedule F attachment with their individual tax return. Schedule F farm income includes farm sales plus government payments, cooperative distributions, crop insurance proceeds, and custom hire income. Farmers can deduct any ordinary and necessary expenses related to farming, including the costs of livestock, feed, seeds, fertilizer, wages paid to employees, interest paid during the year on farm-related loans, depreciation to recover a portion of equipment costs, utilities, and insurance premiums. Farm income reported on schedule F is combined with off-farm income to compute federal income taxes.
As with sole proprietorships, farm income from partnerships and S-corporations is passed through to the individual partners or shareholders and taxed as individual income. On average for 2006–2015, partnerships comprised 4.8% of farms and 18.7% of sales, and S-corporations (those taxed under subchapter S of the tax code) accounted for 2.0% of farms and 11.7% of sales, according to ARMS data. The remaining 2.5% of farms included C-corporations, cooperatives, estates, trusts, and institutional farms. Income from farms organized in these categories is often not taxed at the individual level. In total, more than 97% of all farms and more than 87% of farm sales are taxed under individual income tax provisions, according to the ARMS data.
Past studies of income underreporting can be divided into those that estimate noncompliance directly based on audits of tax returns and those that estimate noncompliance indirectly.Footnote 3 IRS audits of individual returns likely provide the most accurate information about individual tax compliance. These consistently find a much higher rate of tax compliance for wages and salaries compared with income sources not subject to information reporting and withholding—such as income from sole proprietorships, partnerships, and S-corporations. The most recently available IRS data indicate that the net misreporting percentage (the amount that was not reported as a percentage of what should have been reported) ranges from 1% for wages and salaries to 63% for income with “little or no information reporting,” which includes farm income (IRS, 2016).
The misreporting percentage for farms (households filing a schedule F) has not been reported by the IRS in recent years. However, an analysis of the IRS individual income tax data for the 2008–2010 tax years found that 65% of the 2,024,908 tax returns reporting farm income (or loss) underreported income, and the average amount of underreported farm income was $4,448 (U.S. Government Accountability Office [GAO], 2017).Footnote 4 A 1996 IRS study reported a net misreporting percentage of about 32% for farm income in the 1992 tax year (IRS, 1996). Joulfaian and Rider (Reference Joulfaian and Rider1998) using 1985 and 1988 tax data that included 1,090 farms found that on average, farmers failed to report $7,377 of their $24,397 farm business income, which implies a 30% misreporting percentage. Klepper and Nagin (Reference Klepper and Nagin1989) using 1988 IRS audit data estimated that 49% of farm income was underreported.
Indirect approaches to estimating tax compliance also find high rates of income underreporting for sole proprietorships. These studies share some conceptual similarities to the approach taken in this study. For example, Pissarides and Weber (Reference Pissarides and Weber1989) estimated tax compliance of the self-employed using survey data from the United Kingdom. The researchers estimated food expenditures conditional on household characteristics and reported incomes. If preferences for food do not depend on employment type, and the noncompliance rate among wage earners is negligible, then observed differences in food expenditures per dollar of reported income may be attributed to underreporting of income by the self-employed. Based on this assumption, Pissarides and Weber estimate that the self-employed in Britain underreported approximately 35% of their income in 1982.
Feldman and Slemrod (Reference Feldman and Slemrod2007) used a similar indirect approach to Pissarides and Weber, except that they focused on charitable cash contributions. Controlling for income and demographic characteristics, the authors estimated the relationship between charitable contributions and reported income. Assuming that a taxpayer’s income source is not correlated with attitudes toward charitable giving, any differences in the rate of charitable giving across income sources can be attributed to income underreporting. Using IRS tax return data, the authors estimated that, on average, individuals report only 14.7% of their S-corporation and partnership income, and 25.9% to 34.1% of their schedule F income.
2.1. Underreporting and household income
The available evidence suggests that higher-income individuals underreport their income at a higher rate. For example, using IRS data, Johns and Slemrod (Reference Johns and Slemrod2010) found that the ratio of aggregate misreported income to estimated true income increases with true income. This phenomenon may result in part because wealthier individuals are better able to bear the risk of tax noncompliance. In Allingham and Sandmo’s (Reference Allingham and Sandmo1972) seminal theoretical model of tax compliance, a rational individual weighs the benefits of underreporting taxable income against the risk of detection and punishment in order to maximize expected utility. An individual chooses to pay taxes in order to avoid the chance of getting caught and penalized for tax noncompliance. The model predicts that compliance increases with audit rates and fine rates. In addition, with decreasing relative risk aversion, the model implies that the misreporting rate (the share of true income that is not reported) increases with income: richer individuals find the risk of tax evasion more tolerable.
Federal income taxes are progressive, so higher-income households generally face higher marginal tax rates. The Allingham and Sandmo model provides an indeterminate prediction about how the tax rate influences the rate of tax evasion.Footnote 5 However, most empirical studies find a positive relationship between the tax rate and income underreporting (Clotfelter, Reference Clotfelter1983; Crane and Nourzad, Reference Crane, Nourzad and Slemrod1992; Feldstein, Reference Feldstein1995). For example, Clotfelter (Reference Clotfelter1983) using IRS audit data estimated that the elasticity of the marginal tax rate varied from 0.515 for nonfarm businesses to 0.844 for nonbusiness returns. That is, for a taxpayer with a combined federal and state marginal rate of 0.40, these elasticities imply that a 10% increase in this tax rate to 0.44 would result in an expected 5% to 8% increase in underreporting.
In another empirical study, Feldstein (Reference Feldstein1995) used Treasury Department taxpayer panel data to estimate how taxable income responded to changes in tax rates after the 1986 tax reform. Feldstein finds evidence that tax payers responded to a lower marginal tax rate by increasing the amount of taxable income they reported. His results imply an elasticity of taxable income with respect to the marginal net-of-tax rate greater than one. As Feldstein (1995, p. 555) notes: “Tax rules provide substantial opportunity for individuals to reduce their taxable incomes by adjusting their income and expenses in response to higher marginal tax rates. In addition, higher marginal tax rates may induce taxpayers to take more ‘aggressive’ interpretations of tax rules (e.g., claiming questionable deductions) or even to evade taxes by understating income or claiming unjustified deductions.”
3. A model of farm income underreporting
The empirical approach developed subsequently is based on the proposition that a household’s incentive to underreport farm income will depend on its level of reported off-farm income. Holding true farm income constant, higher reported off-farm income implies higher total income, on average. A higher total income implies a greater incentive to hide income, for the reasons discussed in the previous section. Therefore, higher reported off-farm income results in less reported farm income, holding true farm income and everything else constant.
We econometrically estimate how reported farm income varies with reported off-farm income in order to estimate “true” farm income: the amount of farm income a household would report if it had no incentive to underreport farm income. A household is assumed to have no incentive to hide its income when its reported total household income is zero. Estimating farm income at the theoretical point where total reported household is zero provides the basis for estimating true farm income and, consequently, underreported farm income.
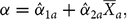
More formally, for all farms with some given unobserved true farm income FI, let the relationship between reported (observed) off-farm income ROFI and reported farm income RFI be described by the linear equation:
 $$RFI = \alpha + \beta \cdot ROFI,{\rm{for}}{\mkern 1mu} {\rm{a}}{\mkern 1mu} {\rm{given}}{\mkern 1mu} FI,$$
(1)
$$RFI = \alpha + \beta \cdot ROFI,{\rm{for}}{\mkern 1mu} {\rm{a}}{\mkern 1mu} {\rm{given}}{\mkern 1mu} FI,$$
(1)
where the intercept and slope are parameters to be estimated. For the reasons discussed previously, we expect β to be negative. That is, farmers hide a larger share of farm income as their reported off-farm income increases—so their reported farm income declines. In addition, we expect the slope to become steeper with higher true farm income dβ/dFI < 0, holding reported off-farm income constant. This occurs because an increase in true farm income pushes the farm household into a higher tax bracket, which increases the incentive to hide the next dollar of off-farm income.
Figure 1 illustrates the empirical approach. It shows the linear relationship (equation 1) for all farms with the same true farm income. In the figure, β < 0, so reported farm income decreases as reported off-farm income increases. The intercept α is the level of farm income that the household would report if its off-farm income were zero. When reported off-farm income is zero, the farm still has an incentive to underreport farm income because it must pay taxes on its reported farm income. RFIi and ROFIi indicate the realized reported farm income and reported off-farm income for a particular household i.

Figure 1. Reported farm income as a function of reported off farm income.
As discussed previously, a household has no incentive to hide farm income as long as its reported household income is zero, in which case the household pays no income tax. This occurs at a hypothetical point where RFI + ROFI = 0 or RFI = −ROFI, which is shown on the graph as the long-dashed line extending into the upper left quadrant at 45 degrees from the x-axis. The intersection of the dashed line and the downward sloping solid line indicates the point on the solid line where reported household income is zero. Because there is no incentive to underreport farm income when reported household income is zero, reported off-farm income must equal the “true” farm income FI at this hypothetical point. In other words, at the intersection of this 45-degree line and the linear equation (1), it must be that −ROFI = FI = RFI. Substituting FI for RFI in equation (1) gives FI = α + β · (−FI). Solving for FI,
 $$FI = \alpha /(1 + \beta ).$$
(2)
$$FI = \alpha /(1 + \beta ).$$
(2)
Hence, the estimates of the intercept and slope in equation (1) are used in the estimation of true farm income in equation (2).
In practice, FI is not observed, so it is not possible to restrict the regression (equation 1) to farms with the same FI. Instead, we attempt to control for variation in FI in two ways. First, we estimate separate regressions by farm asset category to obtain separate intercepts and slopes for the representative farm in each asset category. On average, farms with the same farm assets should have the same true farm income. Second, we include controls for farm income in the separate regressions. In other words, for all farm households i in farm asset category a we estimate
 $$RF{I_i} = {\alpha _{1a}} + {\alpha _{2a}}{X_i} + {\beta _a}ROF{I_i},$$
(3)
$$RF{I_i} = {\alpha _{1a}} + {\alpha _{2a}}{X_i} + {\beta _a}ROF{I_i},$$
(3)
where X i is a vector of farm, operator, and local factors that explain variation in true farm income and variation in the underreporting rate (the share of true farm income that is not reported). Explanatory variables include farm assets, the hours spent by the operator and spouse working on-farm, the operator’s education, the legal organization of the farm, the commodity specialization of the farm, and state fixed effects. The objective is to estimate how reported farm income changes with reported off-farm income, while controlling for observable factors that could affect true farm income.
Using the estimated parameters from equation (3), the intercept in equation (1) is calculated for each asset category as
 $$\alpha = {\hat \alpha _{1a}} + {\hat \alpha _{2a}}{\overline X_a},$$
(4)
$$\alpha = {\hat \alpha _{1a}} + {\hat \alpha _{2a}}{\overline X_a},$$
(4)
where ${\overline X_a}$
is the vector of the average values of X for farms in asset category a. Using equations (2) to (4), the estimated true farm income for a representative household in asset category a is
${\overline X_a}$
is the vector of the average values of X for farms in asset category a. Using equations (2) to (4), the estimated true farm income for a representative household in asset category a is
 $$\widehat{FI}_a\,=\,(\hat{\alpha}_{1a}\,+\,\hat{\alpha}_{2a}\,\overline{X}_a )/(1\,+\,\hat{\beta}_a). $$
(5)
$$\widehat{FI}_a\,=\,(\hat{\alpha}_{1a}\,+\,\hat{\alpha}_{2a}\,\overline{X}_a )/(1\,+\,\hat{\beta}_a). $$
(5)
Estimated unreported farm income for each asset category is defined as the difference between the estimated true farm income and average reported farm income:
 $${\rm{Estimated\,unreported\, farm\, income}}_a = \widehat{FI}_a - \overline{RFI}_a$$.
(6)
$${\rm{Estimated\,unreported\, farm\, income}}_a = \widehat{FI}_a - \overline{RFI}_a$$.
(6)
As alluded to previously, true farm income will underestimate returns to farming when reported farm income losses are used to offset off-farm income for tax purposes. For each household, the tax offset benefit can be calculated as the taxes paid without the reported farm income losses minus the tax paid with farm income losses:
 $${\rm{Tax \ offse}}{{\rm{t}}_i} = \left\{ {\matrix{ {{t_{2i}}ROF{I_i} - {t_{1i}}\left( {RF{I_i} + ROF{I_i}} \right)\ {\rm{if}}\,RF{I_i} \le 0\ {\rm{and}}\ RF{I_i} + ROF{I_i} > 0} \cr {0\,\,\,\,\,{\rm{otherwise}}} \cr } } \right.,$$
(7)
$${\rm{Tax \ offse}}{{\rm{t}}_i} = \left\{ {\matrix{ {{t_{2i}}ROF{I_i} - {t_{1i}}\left( {RF{I_i} + ROF{I_i}} \right)\ {\rm{if}}\,RF{I_i} \le 0\ {\rm{and}}\ RF{I_i} + ROF{I_i} > 0} \cr {0\,\,\,\,\,{\rm{otherwise}}} \cr } } \right.,$$
(7)
where the tax rates t 1i and t 2i are the effective (average) federal income tax rates corresponding to household i’s total income and off-farm income only.Footnote 6 A tax offset is possible only if farm income is negative and total reported household income is positive (if the household reports negative total household income, then it is assumed to pay no income taxes). The estimate (equation 7) may undervalue the offset’s benefits for a couple of reasons. First, the tax rates used in the calculation do not incorporate state or local income taxes, which would increase the tax savings. Second, the estimate does not account for the possibility of using farm income losses to offset farm income gains in subsequent tax years (farm income averaging). This could be particularly beneficial for large operations with relatively little off-farm income to offset.
Finally, it is worth noting that the approach taken in this study assumes that the negative correlation between reported farm income and off-farm income is explained entirely by income underreporting. However, it is possible that the negative correlation could be explained, to some extent, by different preferences for marginal income. That is, if higher-income farmers were less motivated to minimize costs or choose the optimal level of inputs or investment, then we could observe a negative correlation between farm and off-farm income, even with no income underreporting. Unfortunately, it is not possible to identify the cause of the negative correlation. In the data, higher off-farm income farms appear less efficient—they use relatively more inputs per unit of output. However, this could be because they care less about maximizing profits or because they have a greater incentive to underreport net income by overreporting input expenses and underreporting revenues.
4. Data
A sample of farm households was created using data from 10 years (2006–2015) of the ARMS, an annual USDA survey carried out by the National Agricultural Statistics Service and Economic Research Service. The ARMS is the premier survey of farm businesses in the United States, and substantial resources are devoted to reducing inaccuracies related to survey methodology—that is, from the sampling methodology, data collection methods, editing, imputation, and weighting. Although the ARMS, like any survey, could be inaccurate because of the survey methodology, it not clear how these types of errors would alter the relationship between reported off-farm income and on-farm income, which is the basis for the empirical approach.
The distribution of farm income is highly skewed, causing very large farms to have a disproportionate effect on the regression results. This issue cannot be easily addressed using a logarithmic specification, because reported farm income, the dependent variable, is frequently negative. Instead, to reduce the influence of extreme values in the regression, we drop outliers, which produces a sample that excludes the largest farm businesses. Specifically, we drop households in the top 1% of farm value of production (keeping those producing less than $7,917,545) and drop those in the top 1% of farm assets (keeping those with farm assets below $15,800,000). We also drop households in the top and bottom 1% of farm income (keeping those earning between −$477,263 and $1,650,929. Off-farm income is also highly skewed, so we also drop the top 1% of off-farm income earners (keeping those earning less than $527,470).
The analysis focuses on farms organized for income tax purposes as family farms, partnerships, and S-corporations. As discussed previously, for farms organized in these ways farm business income is “passed through,” and income tax is paid at the individual level. Organizations not included in the study (C-corporations and “other” organizational arrangements) represent about 2.5% of all farms.
Table 1 shows summary statistics for the sample of farms used in the analysis disaggregated according to the value of farm business assets. Even after removing outliers, the skewed nature of the farm size distribution remains. Farms with less than $350,000 in farm assets comprised 41% of operations, but produced only 7% of total sales. In contrast, farms with at least $3 million in assets comprised 4% of farms yet produced 30% of sales.
Table 1. Descriptive statistics by farm asset category (2006–2015)
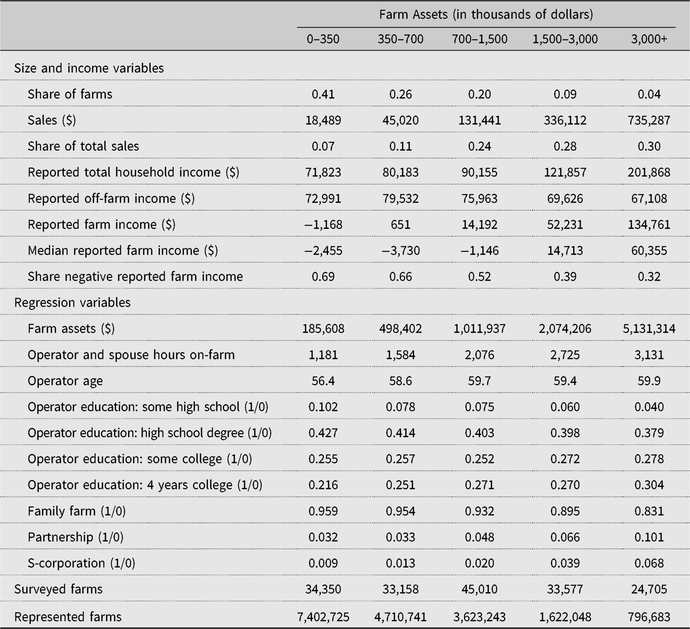
Note: All values in 2016 dollars.
Source: U.S. Department of Agriculture, National Agricultural Statistics Service and Economic Research Service, Agricultural Resource Management Survey, 2006-–2015. See text for details on sample creation.
Although off-farm income was somewhat lower for the largest farms, it did not vary a lot by farm size: average off-farm incomes ranged between $67,649 and $79,591 across asset categories. In contrast, farm income did vary widely across asset categories: mean net farm income was negative for the farms in the smallest asset category, whereas farm income in the largest category averaged almost $135,000. About 60% of all farms in the sample reported negative farm income, with higher shares of farmers with negative income found in the smaller farm categories.
That bottom half of Table 1 presents, by asset category, the average values of the variables used to explain reported farm income in the regressions. The table shows that operator and spouse hours worked on-farm, operator’s age, and operator’s education are positively correlated with farm size. Additionally, larger farms are more likely to be organized as partnerships or S-corporations than smaller farms.
5. Results
The top panel of Table 2 presents, for each farm asset category, the average reported farm income in each reported off-farm income category. Each column illustrates the negative relationship between farm income and off-farm income. For example, for farm households with less than $350,000 in farm assets, those with no reported off-farm income reported $10,437 in farm income. In contrast, those reporting more than $100,000 off-farm income reported $2,948 in farm losses. The negative correlation is evident in all five asset categories.
Table 2. Farm income by farm assets and off-farm income
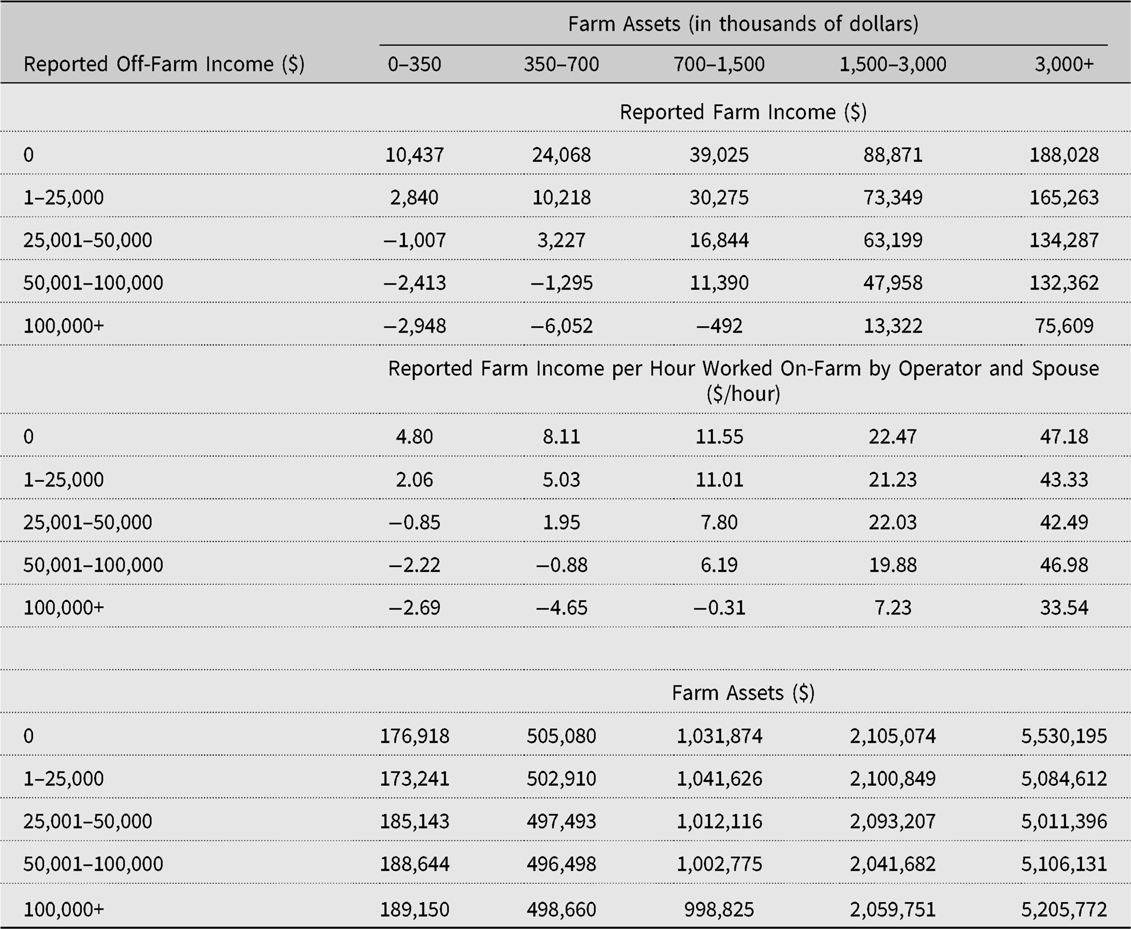
Note: All values in 2016 dollars.
Source: U.S. Department of Agriculture, National Agricultural Statistics Service and Economic Research Service, Agricultural Resource Management Survey, 2006–2015. See text for details on sample creation.
The middle panel of Table 2 makes a similar comparison, except with farm income per hour worked on the farm by the operator and operator’s spouse. Like total reported on-farm income, the implied on-farm wage is inversely related to reported off-farm income. For example, among households with less than $350,000 in farm assets, those with no off-farm income earned $4.80 per hour working on-farm, whereas households that earned more than $100,000 off-farm lost $2.69 per hour working on farm. Hence, the negative relationship between farm and off-farm income remains after adjusting for time worked on-farm.
The bottom panel of Table 2 explores whether the negative relationships between farm and off-farm income result because households that earn more off the farm have fewer farm assets than those who earn less off-farm. The data show that there is little difference in farm assets across off-farm income categories. For all farm sizes, the difference in farm assets between those with no off-farm income compared with those earning more than $100,000 off-farm is less than 6%—much less than the observed differences in farm income and farm income per hour.
The negative relationship is also illustrated in Figure 2, which displays linear and local polynomial regressions of reported farm income on reported off-farm income for the five asset categories.Footnote 7 For clarity, households earning more than $125,000 working off-farm (about the 90th percentile) are not shown on the graph. The figure also shows that the relationship between reported farm and off-farm income is approximately linear, which provides support for the linear specification of the relationship introduced in equation (1).
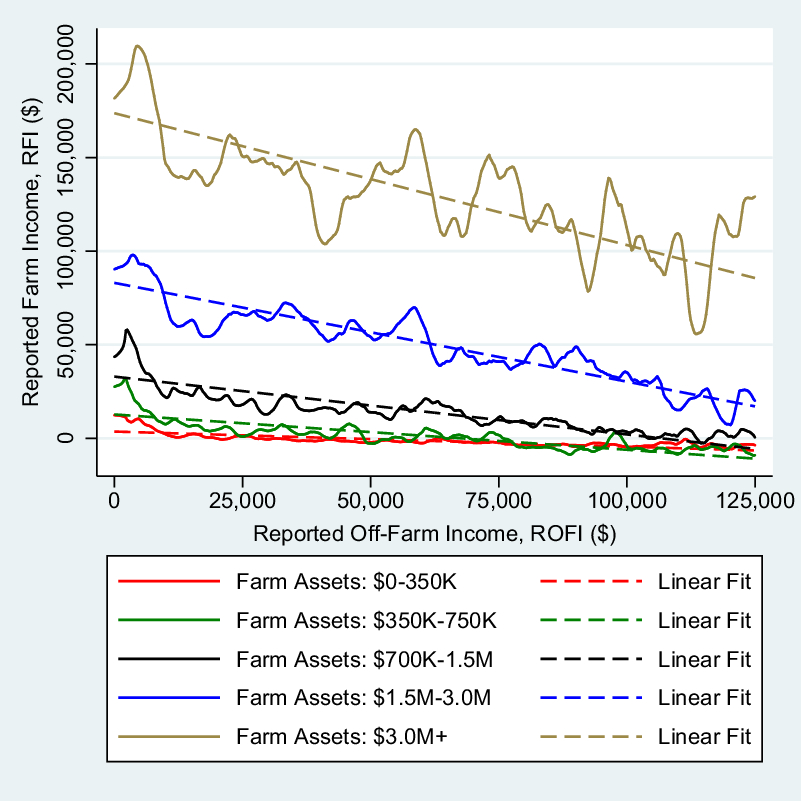
Figure 2. Local polynomial and linear regressions of reported farm income on reported off-farm income.
Table 3 presents the results of the separate linear regressions (equation 3) for each farm asset category. The regressions estimate how reported farm income varies with reported off-farm income, controlling for farm assets, hours worked on-farm by the operator and spouse, the operator’s age and educational attainment, and how the farm is organized for tax purposes. Controls also include fixed effects for the farm’s commodity specialization (19 categories) and the state in which an operation is located (48 states).
Table 3. Reported farm income regressions by farm asset category
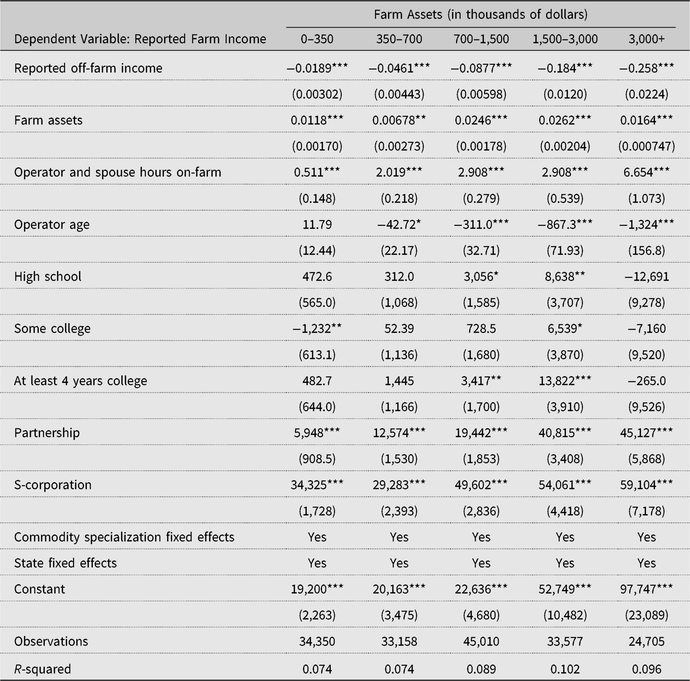
Notes: Standard errors in parentheses. ***P < 0.01, **P < 0.05, *P < 0.1.
Source: Author’s calculations using U.S. Department of Agriculture, National Agricultural Statistics Service and Economic Research Service, Agricultural Resource Management Survey, 2006–2015. See text for details on sample creation.
The results indicate that farms with more assets report more farm income: an additional dollar in assets is associated with an increase of $0.007–$0.026 in farm income. On-farm labor by the operator and spouse is also significantly positively correlated with reported farm income. An additional hour worked on-farm results in an additional $0.51 in reported farm income for the smallest farms and an additional $6.65 for the largest farms.
For all but the smallest farms, operator age is negatively correlated with reported farm income. It is possible that older operators are more likely to operate “retirement farms” and are more likely to accept lower farm income in exchange for the nonpecuniary benefits to farming. Operators with at least 4 years of college report more farm income than those without a high school degree (the missing category) in two of the asset categories. For those groups, a college degree may be associated with greater farm management ability resulting in higher farm income, all else being equal. Being organized as a partnership or an S-corporation was also associated with higher reported farm income. This could reflect a greater incentive to report income when involved in a partnership or corporation, or it could reflect superior managerial efficiency for these types of organizations.
Of most interest for this study, the econometric results confirm that reported off-farm income is negatively correlated with reported farm income. A $1 increase in off-farm income reduces the amount of farm income reported by $0.02 for farms in the smallest category up to $0.26 for farms in the largest category. The higher marginal underreporting rate for larger farms is consistent with the theoretical and empirical literature discussed previously. Larger farms, which earn greater farm income and therefore have higher total household incomes (given the same off-farm income), are likely more tolerant of the risks of tax underreporting. In addition, these farmers are in a higher marginal tax bracket and therefore have a greater incentive to hide their marginal farm dollar.
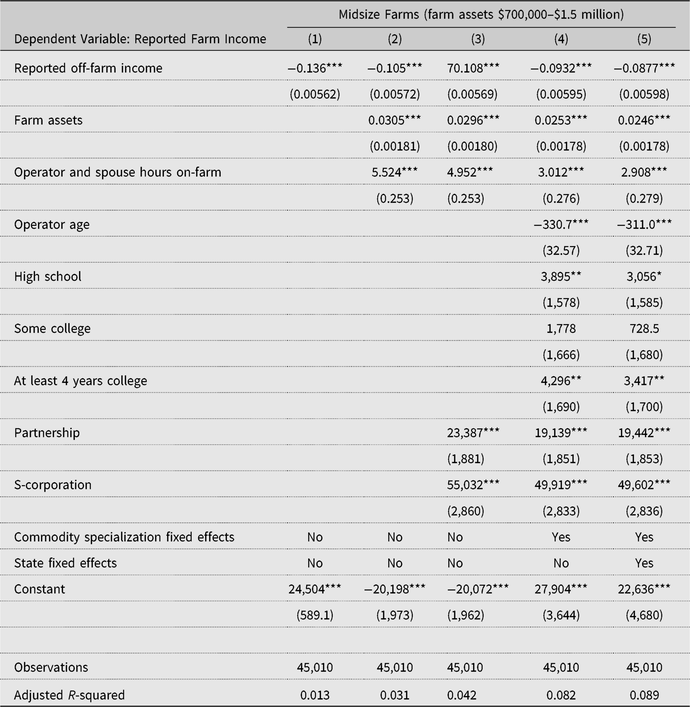
To test the robustness of the model, we examine how the main coefficient of interest—the coefficient associated with off-farm income—varies with model specification (Table 4). For reasons of space, we only present the results for farms in the middle asset category (farm assets between $700,000 and $1.5 million). Results for the other asset categories display a similar robust pattern. Four alternative model specifications using the full sample are shown in columns 1–4. The model shown in column 1 includes only reported off-farm income and a constant as regressors. Column 2 also includes controls for farm assets and operator and spouse hours worked on-farm. Column 3 adds controls for operation organizational arrangement, and column 4 adds operator characteristics (age, education) and indicators for commodity specialization. The results can be compared with the full model specification in column 5. As shown in the first row, the parameter for the main variable of interest is robust to changes in model specification. Once farm assets and operator and spouse hours are included (columns 2–4), the parameter estimates are all in a narrow range between −0.093 and −0.108.
Table 4. Robustness of results under various model specifications: farms with assets between $700,000 and $1.5 million
Note: Standard errors in parentheses. ***P < 0.01, **P < 0.05, *P < 0.1.
Source: Author’s calculations using U.S. Department of Agriculture, National Agricultural Statistics Service and Economic Research Service, Agricultural Resource Management Survey, 2006–2015. See text for details on sample creation.
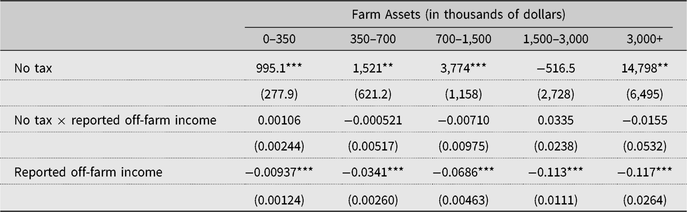
A second robustness test is described in the Appendix. It tests whether farmers located in states with no income tax report more of their farm income. We find that a “no state income tax” indicator variable is statistically significantly greater than zero in the regressions for four of the five asset categories. This implies that farm households in states with no income tax report more farm income than households in states with income tax. This result is consistent with the model and provides further evidence that farm households respond to tax incentives to underreport income.
5.1. Estimated true farm income, unreported farm income, and tax offsets
Coefficient estimates from Table 3 are used to estimate true farm income, unreported farm income, and tax offsets using equations (5), (6) and (7). The first two rows in Table 5 present the average reported farm income and estimated true farm income for each farm size category. For all farm sizes, estimated true farm income is higher than reported farm income. For example, in the smallest farm size category, farmers reported losing an average of $1,168, whereas we estimate these farms actually earned $230. Households with the largest farms reported earning $134,761 compared with their true farm income of $211,173.
Table 5. Estimated true farm income, unreported farm income, and tax offsets
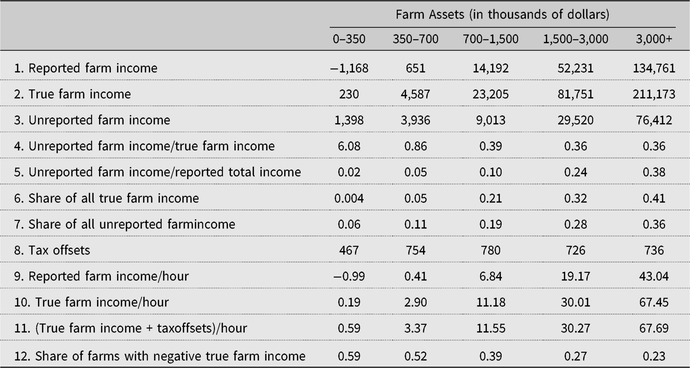
Notes: Unreported farm income is defined as true farm income minus reported farm income. When reported farm income is negative, unreported farm income will exceed true income.
Source: Author’s calculations using U.S. Department of Agriculture, National Agricultural Statistics Service and Economic Research Service, Agricultural Resource Management Survey, 2006–2015. See text for details on sample creation.
Row 3 presents the estimated amount of unreported income. For the smallest size category, unreported income actually exceeds true income because average reported farm income is negative. Unreported farm income increases with farm size and with reported farm income, as would be expected. However, the ratio of unreported income to true income is highest for the smallest farms (row 4). For the smallest farms, unreported income is about six times as large as true income. In order of size, farms in the next four categories fail to report an estimated 86%, 39%, 36%, and 36% of their true farm income, respectively. The unreported income percentage is very high for the smallest farms because these farms have a very low average true farm income and report negative farm income.
In aggregate, we estimate that 39% of true farm income is not reported to ARMS. This is in-line with the misreporting percentages reported by studies that used IRS data that were discussed previously. For example, Joulfaian and Rider (Reference Joulfaian and Rider1998) found a rate of 30%, the IRS (1996) reported a rate of 32%, and Klepper and Nagin (Reference Klepper and Nagin1989) found a 48% rate.
Although households operating smaller farms underreport a larger share of their farm income, households operating larger farms underreport more total income, and their unreported income represents a greater share of their total reported household income (row 5). Unreported farm income represented only 2% of total household income for households with less than $350,000 in farm assets, compared with 38% for households with more than $3 million in farm assets. The ratio increases because for households with bigger farms, farm income represents a greater share of household income.
Even though farm income is underreported at a relatively high rate on smaller farms, the distribution of true farm income remains heavily skewed toward large farms (row 6). For example, the 41% of farms with less than $350,000 in farm assets earned less than 1% of all true farm income, whereas the 4% of farms with at least $3 million in assets earned 41% of all true farm income. At the same time, because smaller farms underreport a larger share of their true income, they collectively account for a somewhat larger share of unreported income than true income (row 7). For example, the 67% of households in the two smallest categories earn only 5% of all true farm income, but they account for about 17% of all unreported farm income.
As discussed previously, households with negative reported farm income can offset their off-farm income for tax purposes. There are farms in each category with negative farm income, so average tax offsets are positive in each farm size category, ranging between $467 and $780 per household (row 8).Footnote 8 For the smallest farms, tax offsets were larger than true farm income, but for all of the other farm size categories, true farm income was much larger than tax offsets.
Rows 9–11 show the implied average hourly returns to farm labor using reported farm income, true farm income, and true farm income plus tax offsets, respectively. True farm income averaged only $0.19 and $2.90 per hour for farms in the smallest and second smallest categories, respectively. When the tax offsets are accounted for, returns per hour are higher, averaging $0.59 and $3.37, respectively. Hence for representative households operating small farms, we find that average farm income is no longer negative after we control for income underreporting. However, the implicit hourly wage earned on-farm is well below the statutory minimum wage. This implies that other factors, such as nonpecuniary benefits to farming, play an important role in explaining the decision by smaller-scale producers to farm despite below-market returns to labor.
The final row shows the percentage of farms in each category that have a negative true farm income. The share of farms with negative true income is 10–14 percentage points less than the share reporting negative farm income (shown in Table 1). Among all farms, 49% have negative true farm income compared with 60% of farms that report negative farm income. So after accounting for underreporting, just over half of all farms do not lose money. The share of farms that lose money in any year is negatively correlated with farm size: more than half of operations with less than $700,000 in assets lose money, whereas only about a quarter of operations with at least $1.5 million in assets do. The substantial share of operations that lose money does not imply that that there is an equally large share of unprofitable farms. The income of individual farms often varies substantially from one year to the next because of fluctuations in yields and prices (Key, Prager, and Burns, Reference Key, Prager and Burns2018). Hence, it is not surprising that a substantial share of farms will experience losses in any year—even among large, efficient operations.
6. Conclusion
This study uses 10 years of data from a nationally representative survey of U.S. farms to estimate the extent of farm income underreporting. We find that among households operating similarly sized farms, those earning more off-farm income report less farm income, even after controlling for farm assets, hours worked on farm, location, commodity specialization, farm legal structure, and operator age and education. Based on the estimated relationship between off-farm income and reported farm income and relying on the assumption that farms would have no incentive to underreport farm income if their total reported farm income were zero, we estimate the true and underreported farm income for representative households in five farm size categories.
We find that farm households underreported 39% of their farm income in aggregate, a level in-line with IRS studies of tax compliance for schedule F filers. This study goes beyond past compliance studies by illustrating how farm income underreporting varies by off-farm income and by farm size. We find that an additional dollar of off-farm income is associated with a reduction in reported farm income between $0.02 and $0.26, a rate that increases with farm size. It is likely that operators of larger farms underreport more of each additional dollar earned off-farm because these operators have higher total household income. Higher income implies a higher marginal tax rate, and a greater incentive to underreport income. Higher income might also make these operators better able to bear the risks associated with underreporting.
Because reported farm losses can be used to offset nonfarm income for tax purposes, the actual benefits to farming are greater than indicated by true farm income. Households with less than $350,000 in farm assets reported average farm losses of $1,168, or $0.99 per hour spent working on-farm. Rather than losing money, we estimate that these small-scale farmers actually earned $230 and that offsets from reported farm income losses would save them $467 in taxes, on average. Adding the value of the tax savings to their true farm income implies a return of $0.59 per hour. Hence, on average, the true returns to farming are positive on the smallest farms, rather than negative, after we control for income underreporting. The higher returns may help explain why some households continue to operate small farms. However, the fact that the implicit real hourly farm wage is well below the statutory minimum wage, even if we also include the benefits of tax offsets, suggests that other motivations, such as nonpecuniary benefits to farming, are needed to explain why many households continue to operate small-scale farms.
The results indicate that reported farm income substantially underestimates the true return to farming. We find that households operating commercial-scale farms—that is, those with at least $700,000 in farm assets—underreport about a third of their farm income, and smaller farms underreport an even larger share. This finding has important implications for research on the labor decisions of farm operators and their spouses. Following seminal papers by Sumner (Reference Sumner1982) and Huffman and Lange (Reference Huffman and Lange1989), a household’s labor allocation decision is usually modeled as a trade-off between off-farm wages and implicit on-farm wages and the marginal utility of leisure. The results suggest that empirical studies that use the reported returns to farming as a return to farm labor are likely to result in biased estimates of labor supply. In addition, the finding that greater off-farm income, and by implication greater off-farm labor supply, is correlated with how much farm income is unreported introduces another potential source of bias into labor analyses.
The findings also have important implications for research seeking to explain differences in incomes or hourly wages between farm and nonfarm work (e.g., Fall and Magnac, Reference Fall and Magnac2004; Key and Roberts, Reference Key and Roberts2009) and for federal government accounting of farm household income (e.g., USDA, 2017). Such studies and reports can inform policies that aim to address rural poverty and inequalities between agricultural/rural areas and nonagricultural/urban areas. This study’s findings suggest that reported values of farm income may, at least in the United States, understate true farm income, biasing income comparisons with nonfarm-sector wage and salary income (though nonfarm sole proprietor income may be similarly underreported).
Financial support
This research was supported by the U.S. Department of Agriculture, Economic Research Service.
Appendix: State income tax variation
In this appendix, we test whether the state income tax rates affect the relationship between reported farm and off-farm income. A finding that farms in low tax states report more of their farm income than similar farms in high tax states would provide support for the theoretical model and empirical approach. Unfortunately, it is difficult to categorize states based on state income tax rates because state income tax brackets differ widely across states (Kaeding, Reference Kaeding2016). For example, although California has a relatively high marginal tax rate for millionaires (13.3% for couples filing jointly), it has a relatively low rate for low-income earners (e.g., 2% for couples filing jointly who earn $35,000). In comparison, couples in Tennessee, which has a flat tax, would face a 6% rate, regardless of income.
A clearer distinction in tax rates can be made between states that have no income tax and those that do. Among the lower 48 states, 7 states have no state income tax: Florida, Nevada, South Dakota, Texas, Washington, and Wyoming. Households in states with an income tax face marginal tax rates that average about 3–5 percentage points higher than households in states with no income tax. For example, we estimate that in states with an income tax, the average marginal income tax rate is about 2.8% for couples earning $10,000 and about 4.5% for couples earning $200,000.
To test whether farmers located in states with no income tax report more of their farm income, we include a “no state income tax” indicator variable into the previous regression model and also interact this indicator variable with the “reported off-farm income” variable.Footnote 9 This specification allows for a different intercept and slope in the relationship between reported farm income and off-farm income.
As shown in Table A1, the “no state income tax” indicator is statistically significantly greater than zero in four of the five asset categories. This implies that when off-farm income is zero, farm households in states with no income tax report more farm income. Reporting more income is what would be expected from a farm facing a lower marginal tax rate. This result provides further evidence that farm households respond to tax incentives to underreport income.
Table A1. No state income tax model: key parameters
Source: Author’s calculations using USDA, National Agricultural Statistics Service and Economic Research Service, Agricultural Resource Management Survey, 2006–2015. See text for details on sample creation.
Notes: Standard errors in parentheses. ***P < 0.01, **P < 0.05, *P < 0 .1. “No tax” is a dummy variable indicating whether the farm is located in a state without state income tax. Other variables in the model are the same as those shown in Table 3, except that U.S. Department of Agriculture (USDA) Farm Resource Region indicators are used instead of state indicators.
The results also indicate that the interaction parameter is not statistically significantly different from zero. The lack of statistical significance is likely explained by the fact that, in most states, the state income tax does little to enhance the progressivity of the federal income tax. As noted previously, for states having an income tax, the tax rates for couples filing jointly who earn $200,000 is only about 1.7 percentage points higher than it is for couples who earn $10,000. In contrast, for federal taxes, this difference was 18 percentage points during the study period. The slope captures the change in the incentive to report farm income as off-farm income changes. The state income tax has little effect on how the incentive changes with income.


 Open access