


Interest in an automated hand hygiene monitoring system (AHHMS) as a tool to estimate hand hygiene (HH) performance rates and to guide improvement efforts has increased considerably over the last 10 years. Reference Boyce1–Reference Iversen, Kavalaris and Hansen9 An AHHMS quickly and efficiently provides substantially more quantitative data than direct observations without observer bias or a Hawthorne effect. Reference McLaws and Kwok6,Reference Srigley, Furness, Baker and Gardam10 The continuous generation and reporting of data allows for frequent feedback and can quickly detect changes in HH performance as a result of improvement initiatives, and importantly, provides an opportunity for rapid course correction if lack of effect is noted. Reference Leis, Powis and McGeer4,Reference McLaws and Kwok6,Reference Srigley, Furness, Baker and Gardam10–Reference Knepper, Miller and Young14
The World Health Organization “Guidelines on Hand Hygiene in Health Care” emphasize the importance of implementing multiple components to effectively improve and sustain HH performance (ie, “a multimodal strategy”), suggesting a synergistic effect. 15 Similarly, emerging evidence shows that the use of AHHMS has the potential to improve HH performance rates when combined with complementary strategies. Reference Leis, Powis and McGeer4,Reference Edmisten, Hall and Kernizan12–Reference Knepper, Miller and Young14 However, published data examining the impact of AHHMS with or without different improvement strategies on HH performance rates are lacking. Therefore, we conducted a study to assess how engagement of key hospital and/or vendor personnel with performance improvement strategies, combined with an AHHMS influence HH performance rates.
Methods
We analyzed data from a group-based AHHMS without badges (PURELL Smartlink Activity Monitoring System, GOJO Industries) that records alcohol-based hand rub and soap portions dispensed and patient room entries and exits by all individual (eg, healthcare providers, patients, and visitors), with data reports by unit. Elements of this exact system have been described previously in detail. Reference Limper, Slawsky and Garcia-Houchins16 Unit performance rates were expressed as the number of portions dispensed (events) divided by the number of patient room entries and exits (opportunities) ×100. Data were collected from 1,085 rooms in 58 units in 10 North American acute-care hospitals that utilized the AHHMS for varying periods of time between July 2014 through December 2019 (Table 1). Data were not collected for the entirety of time between these 2 dates for all units and/or hospitals because each hospital independently decided the period of AHHMS use and their approach (eg, which units installed AHHMS). Data from 2020 were excluded because of the unusual impact of the COVID-19 pandemic on HH performance; that has been studied elsewhere and will likely be the focus of future research. Reference Moore, Robbins, Quinn and Arbogast17,Reference Makhni, Umscheid and Soo18 Outpatient units (including emergency departments) were excluded from the study. Each hospital self-assigned to 1 of 4 intervention groups (Table 2): AHHMS without complementary strategies (AHHMS-alone group, ie, the control group), AHHMS plus clinician-based vendor support (vendor-only group), AHHMS plus hospital-led unit-based initiatives (hospital-only group), and AHHMS plus vendor support and hospital-led unit-based initiatives (vendor-plus-hospital group).
Table 1. Summary of Hospitals

1 Note. ICU, intensive care unit; MS, medical surgical, O, oncology, SD, stepdown.
Table 2. Hand Hygiene Performance Data Summary by Complementary Intervention Strategy

Note. CI, confidence interval; HH, hand hygiene; AHHMS, automated hand hygiene monitoring system.
a Monitoring hours was calculated by determining how long AHHMS was on in each unit, and then adding up these hours for each facility.
b Events were hand hygiene events (hand sanitizing + hand soap use). Opportunities were entries into plus exits from patient rooms.
Study design
This study was a prospective, before-and-after, controlled observational study. After installation and validation of system components functionality concurrent with education on how it functions, data reporting options and addressing any questions, each unit underwent a 1- to 2-month baseline phase in which the AHHMS data were blinded to unit managers and frontline healthcare providers. This period was followed by the intervention phase. No clinician-based vendor support or hospital-based initiatives were implemented during the baseline phase. HH leadership (eg, quality and infection prevention professionals) had access to AHHMS data from the initiation of installation, functional validation, and through the intervention phase. Unit leadership (eg, nurse managers) had access to AHHMS data during the intervention phase.
Clinician-based vendor support provided by vendor-employed nurses with extensive HH improvement experience included both on-site and remote components. On-site support varied depending on the input and decisions by hospital leadership. Activities could include ongoing system education and training; feedback of data plus discussion of the findings; just-in-time coaching and the incorporation of habit-building strategies; barrier identification and countermeasures for mitigation; optimization of workflow and dispenser placement; and/or collaboration with unit leadership to work on goal setting, team building, and problem solving. Remote support also varied by facility and included activities such as data analysis or reporting (typically weekly reports with customized formats) and phone conferences with HH leadership (not frontline staff).
Hospital-led unit-based initiatives also varied by unit and facility. Facilities often initiated the same types of activities provided by on-site vendor support clinicians as described above. In some units, frontline healthcare providers created their own signage or posters, provided unit-led just-in-time coaching, and acted as “hand hygiene champions” to raise awareness and provide encouragement during each shift. Additionally, in some facilities, weekly “HH performance improvement calls” Reference Landon, Pacholek and Runjo11 (also known as “HH accountability calls” or “HH huddles”) were held to discuss performance rates and share action plans. These calls also involved ancillary departments when they were involved in unit-based initiatives being implemented.
Intervention groups
AHHMS-alone group
Participants and units in this group (3 units in 2 hospitals) implemented no vendor- or hospital-led unit-based activities during any point in the study. AHHMS data feedback was sporadically provided to frontline healthcare providers; however, there was no formal leadership plan to improve HH.
Vendor-only group
Participants and units in this group (6 units in 2 hospitals) implemented no hospital-led unit-based initiatives throughout the intervention phase. Partnerships with hospital HH leadership determined what clinician-based vendor support were led and implemented by the clinician.
Hospital-only group
Participants and units in this group (8 units in 1 hospital) implemented hospital-led unit-based initiatives during the intervention phase. No vendor support was provided with the exception of initial system education and ensuring the AHHMS equipment and data software were fully functional.
Vendor-plus-hospital group
Participants and units in this group (41 units in 5 hospitals) implemented vendor and hospital-led, unit-based initiatives during the intervention phase. Partnerships were often formed primarily between vendor-employed clinicians, hospital HH leadership, and unit leadership. Intervention efforts were often implemented as a collaboration between the hospital and clinician.
Statistical analysis
We report all results as HH performance rates, which equals portions dispensed divided by opportunities. Statistical analysis was performed on the annual number of portions dispensed weighted by opportunities with a mixed effects Poisson general additive model with random effects for facility and unit (to account for repeated measures from each unit and facility), 2 fixed effects for intervention (with the 4 groups as described above) and period (before intervention implementation (baseline) or after intervention implementation), and a data-smoothing year for each intervention. Reference Zuur, Ieno, Walker, Saveliev and Smith19 The interaction between the 2 fixed effects was crucial for determining that the HH rates associated with the interventions after the baseline period were larger than that of the AHHMS-alone group after the baseline period. In addition, an effective intervention must have a higher HH rate than that of the AHHMS-alone group during the intervention period. Poisson assumptions were verified with Pearson residual plots.
Results
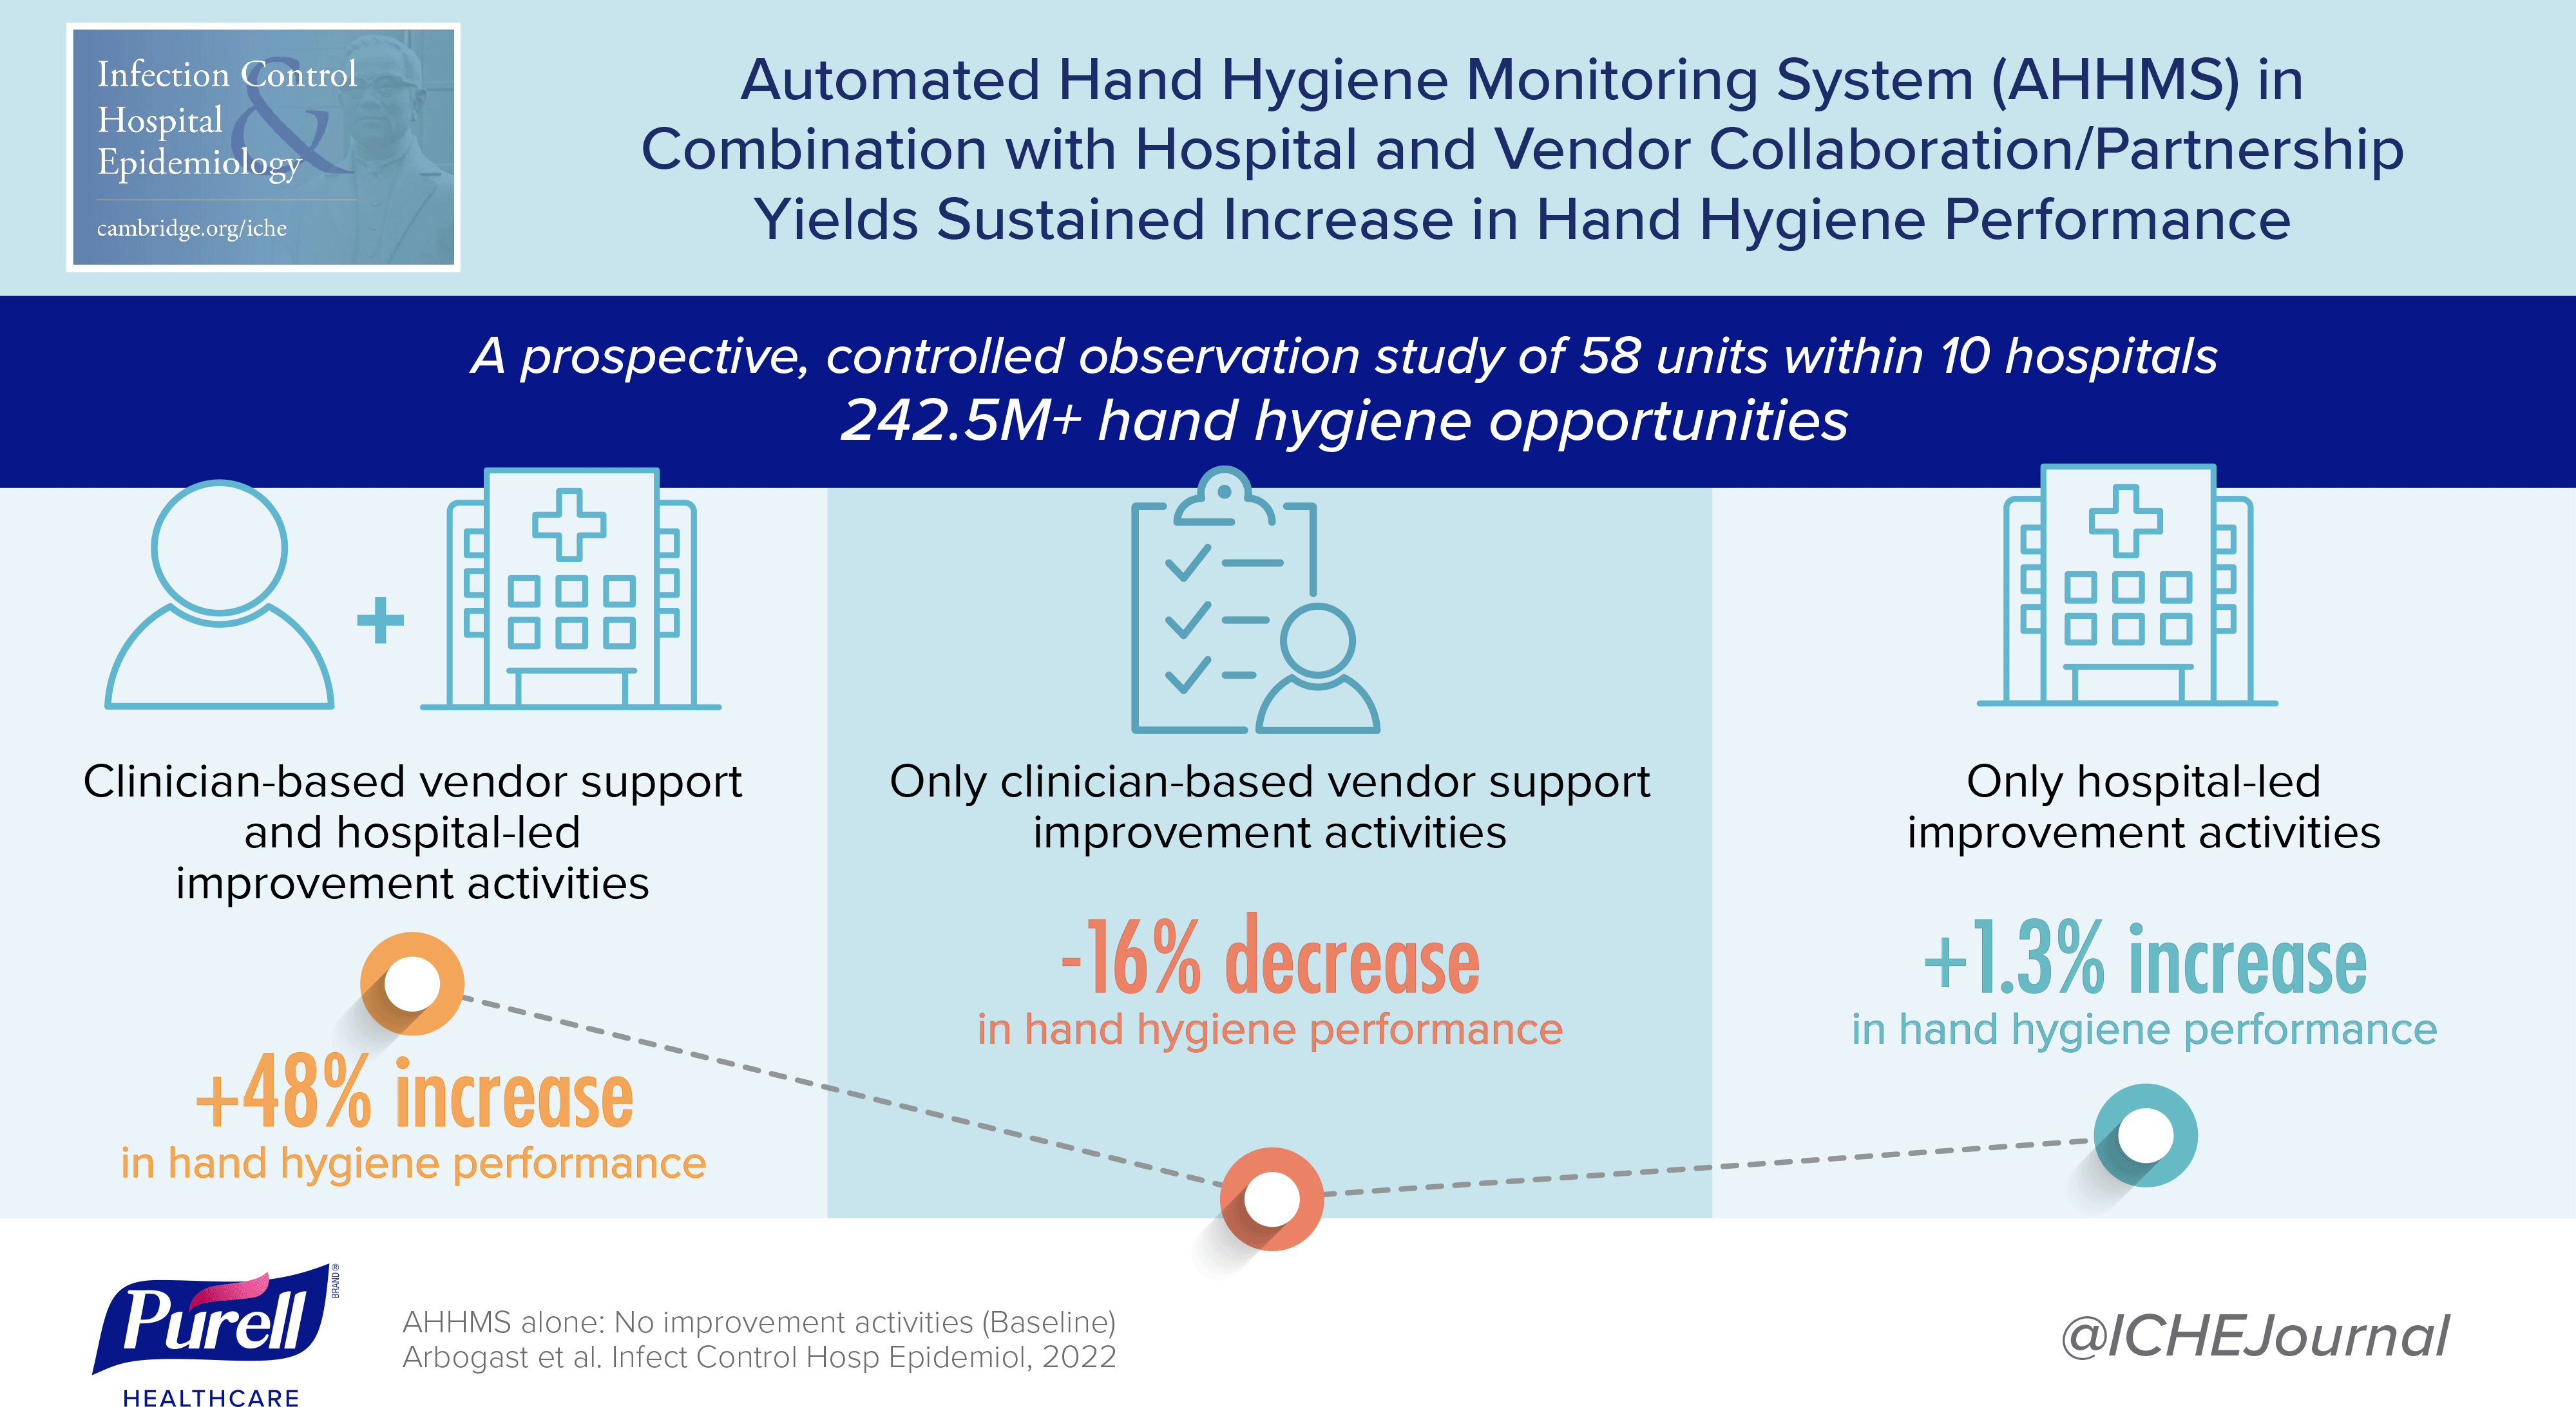
A variety of hospital types were included, and all units used the AHHMS for a minimum of 12 months (Table 1). For each study group, baseline and intervention AHHMS data are summarized in Table 2 and Figure 1. In total, 242,551,785 opportunities were captured in all 58 units combined. Annual median HH performance rates by study group during the intervention period are shown in Figure 2. Other than the vendor-plus-hospital group, no other intervention group was statistically significantly different than the AHHMS-alone group during the intervention period (Table 2). Importantly, in the comparison of baseline to intervention, the vendor-plus-hospital group HH rate increased from 37.5 during baseline to 46.9 during the intervention period (P < .001) (Fig. 1). In comparison, the vendor-only group and the AHHMS-alone group both decreased from baseline (P < .001), and the hospital-only group remained flat (P = 0.13) (Fig. 1). This comparison is important for gauging the impact of the interventions because the median baseline rates for the intervention groups did exhibit some variability, ranging from 27.7% to 37.4% for median HH performance rate (Fig. 1). During the intervention period, the vendor-plus-hospital group yielded better HH performance compared with the other 3 groups (>46% increase; P < .006) (see modeled median HH rates column in Table 2). The increases in the vendor-plus-hospital group were 76% over the vendor-only group (46.9/26.7 = 1.76), 46% over the hospital-only group (46.9/32.1 = 1.46), and 48% over the AHHMS-alone group (46.9/31.7 = 1.48).

Fig. 1. Median hand hygiene performance rates by period and intervention category. Error bars indicate 95% confidence intervals for the median annual HH rate.

Fig. 2. Annual median hand hygiene performance rate by intervention category. Error bars indicate 95% confidence intervals for the median annual HH rate. Note. The black curve for AHHMS-alone group does not extend to 2018 or 2019 because the 2 hospitals that only installed AHHMS stopped use of the system before 2018. Similar explanations can be provided for why the red curve for the vendor-only strategy starts in 2016 and for why the green curve for hospital-only strategy starts in 2015.
Discussion
AHHMS is a useful tool for understanding HH behavior and for identifying units that need attention. Reference Leis, Powis and McGeer4,Reference Kwok, Juergens and McLaws20 Examples of interventions that have been successfully utilized with AHHMS include holding weekly “HH performance improvement calls” to discuss performance rates and share action plans, engaging unit-based nursing managers and frontline healthcare providers as HH champions, making downloads of weekly and/or monthly AHHMS reports by nurse managers a simple process, providing ongoing education sessions, and encouraging the use of quality improvement methods. Reference Leis, Powis and McGeer4,Reference Landon, Pacholek and Runjo11–Reference Knepper, Miller and Young14 Other studies have found that the implementation of AHHMS by itself or with limited complementary strategies does not drive improvement. Reference Kwok, Harris and McLaws21,Reference Edmonds-Wilson, Pelz and Moore22 In the present study, vendor support or hospital-led, unit-based complementary strategies individually combined with AHHMS were not sufficient additions to significantly improve HH performance. However, combining these approaches resulted in the greatest improvements in HH performance. One study that involved the same AHHMS found that HH performance rates did not increase when the AHHMS alone was implemented but did increase when several complementary strategies combined with intermittent vendor support were utilized. Reference Boyce, Laughman, Ader, Wagner, Parker and Arbogast13 Edmisten et al Reference Edmisten, Hall and Kernizan12 also reported that combining vendor support and several hospital-initiated complementary strategies with a different AHHMS yielded significantly improved HH performance.
In contrast to our findings, 2 other studies that included numerous hospital-based complementary strategies without significant vendor support yielded significant increases in HH performance rates. Reference Leis, Powis and McGeer4,Reference Knepper, Miller and Young14 A hospital that installed a badge-based system in 4 locations reported that HH performance rates increased significantly when multiple complementary strategies were used in combination with the AHHMS. Reference Knepper, Miller and Young14 A larger stepped-wedge, cluster-randomized study conducted in 5 hospitals found that a group monitoring system increased HH performance rates significantly when combined with multiple hospital-based complimentary strategies without vendor support. Reference Leis, Powis and McGeer4
In our study, the combination of AHHMS with clinician-based vendor support plus hospital-led unit-based initiatives yielded greater improvements in HH performance compared with units using AHHMS alone or AHHMS with either clinician-based vendor support or hospital-based initiatives. This finding may be a result of the synergistic effect of employing multiple elements simultaneously, which is emphasized by the World Health Organization’s multimodal strategy. 15 Implementing an AHHMS in combination with the components of that multimodal strategy (ie, system change, training and education, evaluation and feedback, reminders in the workplace, and institutional safety climate) is an area that warrants further research.
With data from 10 hospitals throughout North America, this study makes an important contribution to understanding HH performance-rate improvement efforts. Many single-facility studies have dominated HH research, but the results of our multifacility study suggest that if other hospitals implement AHHMS with a vendor-plus-hospital intervention, with 95% confidence, the median HH performance rate will increase by 16%–89% (Table 2) compared to implementing AHHMS alone.
Prospective multifacility studies with multiple predefined and randomly assigned interventions are needed to better understand optimal complementary strategies to combine with AHHMS. We are not aware of any multifacility randomized controlled trials, although Leis et al Reference Leis, Powis and McGeer4 performed a prospective multifacility study with random intervention start times, but without any concurrent control group. Furthermore, additional investigations are needed to clarify the circumstances in which support from AHHMS vendors contributes to improved HH performance rates and to prospectively identify which vendor and hospital-led unit-based initiatives are the most effective (ie, create a playbook of the necessary activites/interventions for both the vendor team and hospital team). Future studies with vendor-plus-hospital partnerships to leverage the power of the AHHMS data should also critically evaluate the impact on key outcomes, such as healthcare-associated infection rates and AHHMS cost-effectiveness and financial modeling.
Our study had several limitations. Most notably, the study design loosely defined the intervention strategies (ie, not all facilities per group implemented the exact same interventions). Facilities were not randomly assigned to the intervention groups (ie, it was not a randomized controlled trial). Additionally, the units and hospitals did not provide data over the entire duration of the study timeline (Table 1), which could have introduced some bias when comparing interventions. Our statistical model attempted to minimize the potential for bias by explicitly accounting for varying numbers of facilities and opportunities over time. The small number of hospitals in the vendor-only, hospital-only, and AHHMS-alone groups means less statistical power for detecting differences among these groups. Finally, only 1 type of AHHMS was used in all study hospitals; therefore, the findings may not be translatable to all types of AHHMS.
In conclusion, implementing AHHMS with both the hospital and vendor collaborating in partnership is more likely to yield sustained increases in HH performance. Alternatively, hospitals unable to actively collaborate with the AHHMS vendor and actively engage in hospital-led, unit-based initiatives are unlikely to achieve sustained increases in HH performance. This study illustrates the potential value of a partnership between hospital leadership and the AHHMS vendor and the importance of engagement in improvement efforts by the hospital to improve HH rates and create cultural change.
Acknowledgments
Mia DeFino, MS, ELS, provided medical writing assistance with the first draft manuscript preparation and with reference formatting. The authors thank hand hygiene leadership and staff at participating hospitals.
Financial support
GOJO Inc provided all funding for completion of this study.
Conflicts of interest
GOJO employee coauthors received their normal salary over the course of this study, with no additional nor special compensation for this study. All coauthors objectively assessed the data and reported it accurately, in our role to advance the science of hand hygiene and share learning or evidence with key stakeholders in society. Dr Boyce and Dr Parker were coinvestigators for the entire body of work. GOJO compensated Dr Boyce at his normal consulting fee rate. GOJO Industries paid Montana State University a fee for Dr Parker to analyze the data relevant to the manuscript and to help write the manuscript. The “Smartlink” system used in each hospital was paid for by the hospital as part of their normal purchase agreement and trial plan with GOJO.


 Open access