


1 Introduction
Due to eye-safe property and low transmission loss in the atmosphere and optical fiber, high-power lasers operating at 1.5 μm have attracted intensive interest in recent years[ Reference Kotov and Likhachev 1 ]. For many applications, such as coherent Doppler lidar[ Reference Sakimura, Hirosawa, Watanabe, Ando, Kameyama, Asaka, Tanaka, Furuta, Hagi, Hirano, Inokuchi and Yanagisawa 2 , Reference Patokoski, Rissanen, Noronen, Gumenyuk, Chamorovskii, Filippov and Toivonen 3 ], gravitational-wave detection[ Reference Steinke, Tunnermann, Kuhn, Theeg, Karow, de Varona, Jahn, Booker, Neumann, Wessels and Kracht 4 , Reference De Varona, Fittkau, Booker, Theeg, Steinke, Kracht, Neumann and Wessels 5 ] and nonlinear frequency conversion[ Reference Chiow, Kovachy, Hogan and Kasevich 6 – Reference Tan, Yang, Wang, Wang, Zhao, Guan, Peng, Gan, Yang and Xu 8 ], high-power, single-frequency (SF) and linearly polarized lasers with diffraction limited output are urgently needed. The master oscillator power amplifier (MOPA) is the most effective method for power scaling. Because of the small absorption cross-section and the difficulty of high-concentration doping for erbium ions in silica fiber, the erbium-ytterbium co-doped fibers (EYDFs) are typically used as the gain media for generating 1.5 μm lasers by 9XX nm laser diode pumping. However, the output power of EYDF lasers is mainly limited by amplified spontaneous emission (ASE) in the Yb emission band and thermally induced fiber damage. In order to mitigate Yb ASE and recycle the Yb band energy, several methods, such as off-peak pumping[ Reference Matniyaz, Kong, Kalichevsky-Dong and Dong 9 ], core pumping with a Yb fiber laser[ Reference de Varona, Steinke, Neumann and Kracht 10 ] and co-seed pumping[ Reference Wei, Yao, Chen and Mao 11 ] or cascade co-pumping[ Reference Han, Yan, Yao, Chen and Liu 12 , Reference Zhao, Han, Wang, Hu, Ren, Jiang and Liu 13 ], have been proposed. Among them, the 1018 nm core pumping single-mode active fiber shows a simple and potential method to achieve up to tens of watts at 1.5 μm[ Reference de Varona, Steinke, Neumann and Kracht 10 ]. However, all of these methods require a relatively long gain fiber, which is unfavorable for suppressing stimulated Brillouin scattering (SBS) in SF MOPAs. Then, large-mode area EYDFs, which can raise the SBS threshold and moderate thermal accumulation, are used to generate a high-power SF laser at 1.5 μm. In 2016, Creeden et al. [ Reference Creeden, Pretorius, Limongelli and Setzler 14 ] reported a 207 W 1560 nm SF fiber amplifier with a measured M2 of 1.05 using EYDF of a core/cladding diameter of 25/300 μm, which to our knowledge is the highest power SF laser at 1.5 μm up to now. Although the M2 of less than 1.1 is good for the majority of applications, it still corresponds to higher order modes content of up to 30%[ Reference Wielandy 15 ]. A high-power SF laser with a linearly polarized TEM00 mode is necessarily required for gravitational-wave detection[ Reference Steinke, Tunnermann, Kuhn, Theeg, Karow, de Varona, Jahn, Booker, Neumann, Wessels and Kracht 4 , Reference Steinke, Croteau, Pare, Zheng, Laperle, Proulx, Neumann, Kracht and Wessels 16 ]. In 2017, De Varona et al. [ Reference De Varona, Fittkau, Booker, Theeg, Steinke, Kracht, Neumann and Wessels 5 ] reported a more than 100 W linearly polarized TEM00 mode SF fiber amplifier at 1.5 μm based on the gain fiber of a similar model. However, the usage of large-mode area fiber greatly complicates the management of the beam quality.
Direct pumping in the Er absorption band near 1.5 μm is an effective way to avoid the Yb ASE problem in the EYDF-based MOPA[ Reference Dong, Zeng, Cui, Zhou and Feng 7 , Reference Kashiwada, Shigematsu, Kougo, Kanamori and Nishimura 17 – Reference Lim, Alam and Richardson 19 ]. The co-doped Yb ions serve as a sensitizer and increase the Er ions’ allowable concentration in silica fiber[ Reference Kiritchenko, Kotov, Melkumov, Likhachev, Bubnov, Yashkov, Laptev and Guryanov 20 ]. For the high absorption coefficient in the fiber core, in-band core pumping of Er ions at 1480 nm benefits the power scaling of SF lasers by suppressing the SBS. The threshold of thermal damage is also raised due to the low quantum defect from the pump to the signal light. Unfortunately, high-brightness laser diodes for in-band Er ions pumping are still unavailable[ Reference Kotov, Aleshkina, Khudyakov, Bubnov, Medvedkov, Lipatov, Guryanov and Likhachev 21 ]. Raman fiber lasers (RFLs) have been widely investigated for expanding laser emission bands and are considered an effective technology to address the output power enhancement of special wavelength lasers[ Reference Feng 22 ]. At 1480 nm, a 301 W RFL output has been reported[ Reference Supradeepa and Nicholson 23 ]. In 2019, an RFL-based 60.6 W 1480 nm laser was utilized to pump an Er fiber amplifier made of a piece of polarization-maintaining (PM) EYDF with a core/cladding diameter of 12/125 μm, which delivered an SF 1560 nm laser with output power of up to 50 W[ Reference Dong, Zeng, Cui, Zhou and Feng 7 ]. The amplifier terminates with a single-mode fiber (PM1550) and ensures a fundamental transverse mode output.
In this paper, high-power linearly polarized continuous-wave 1560 nm SF amplifiers core-pumped by a 1480 nm RFL were investigated experimentally in detail in terms of the relative intensity noise (RIN) and spectrum. A maximum power of 59.1 W in the fundamental mode was achieved in a co-pumping configuration with a slope efficiency of 90.1%. No spectral broadening was observed after amplification. However, a small spectral pedestal (35 dB less) was measured in the output of this configuration, whereas in the counter-pumping configuration the background spectral components were absent and a maximum of 50 W was attained. The raised spectral pedestal in co-pumping is caused by cross-phase modulation (XPM) between the pump and the signal laser, which is observed and analyzed for the first time in the in-band pumped rare-earth doped fiber amplifier. The RINs in a frequency range from 100 Hz to 10 MHz were carefully measured and compared, and they imply independence of the pumping direction.
2 Experimental setup
The experimental setup of the SF 1560 nm laser is shown in Figure 1; it has a PM MOPA configuration. The seed is a distributed feedback laser with an output power of 10 mW and a nominal linewidth of 5 kHz. The seed is pre-amplified to 4.1 W before injecting to the main amplifier. A standard circulator is inserted between the pre-amplifier and the main amplifier. Port 3 of the circulator is employed to extract the backward light from the main amplifier and monitor the SBS, simultaneously. The 1480 nm pump laser is a home-built cascaded RFL, which is similar to that reported in Ref. [Reference Dong, Zeng, Cui, Zhou and Feng7]. The difference is that 1238 and 1480 nm lasers are generated in nested cavities rather than in sequence cavities. In order to utilize the Raman effect sufficiently, the 1238 nm cavity is a high-Q cavity, which is formed by a pair of high-reflection fiber Bragg gratings (HR-FBGs) centered at 1238 nm, both with a reflectivity of 99% and a full width at half maximum (FWHM) of 1.78 nm. For 1480 nm, the HR-FBG has a reflective value of 99% and an FWHM of 1.64 nm, while the output coupler (OC) FBG has an FWHM of 0.20 nm with a reflective value of 10%. All the FBGs in the Raman fiber oscillator are written in SMF-28 fiber. The 1064 nm laser is injected directly into the nested cavities and generates a 1238 nm laser firstly because of the ultralow Raman threshold of the high-Q cavity. The 1480 nm pump and 1560 nm laser are coupled into the main amplifier via a 1480/1560 nm wavelength division multiplexer (WDM), which is specifically manufactured with SMF-28e fiber for the 1480 nm port and PM1550 fiber for the 1560 nm port. A co-pumped or counter-pumped structure is realized by switching WDM 1 and WDM 2, as shown in the dashed boxes in Figure 1. The gain fiber is a 2.6-m-long PM EYDF with a core/cladding diameter of 12/125 μm and core/cladding numerical aperture of 0.19/0.46.

Figure 1 Schematic diagram of the single-frequency fiber amplifier and its measurement for power, spectrum, intensity dynamics and linewidth. LD, laser diode; YDF, ytterbium-doped fiber; HR-FBG, high-reflection fiber Bragg grating; OC FBG, output coupler fiber Bragg grating; CPS, cladding power stripper; PDF, phosphorous-doped single-mode fiber; SF, single-frequency; WDM, wavelength division multiplexer; PM EYDF, polarization-maintaining erbium-ytterbium co-doped fiber; PD, photodetector; AOM, acousto-optic modulator.
3 Results and discussion
3.1 1480 nm pump laser
Firstly, the output power and spectra of the 1480 nm RFL are measured after WDM 1. The spectra are measured by an optical spectrum analyzer (Yokogawa AQ6370D) with the resolution of 0.02 nm, and the output power of the laser is monitored by a power-meter (FL400A-BB-50, Ophir). It outputs up to 77.3 W. The output spectra versus output powers are depicted in Figure 2. There is a small amount of light at 1064 and 1238 nm, but the 1480 nm light accounts for more than 96% in the output. It is worth noting that, in Figure 2, a low-intensity envelope centered at 1116 nm is observed at the maximum output, which is attributed to the first-Stokes emission from 1064 nm in the phosphorus-doped gain fiber (Raman frequency shift of 440 cm–1).

Figure 2 The spectra of the 1480 nm pump laser at different output powers. The 1480 nm light is the main component.
The normalized temporal properties in the time frame of 200 μs of the 1480 nm pump laser versus power are shown in Figure 3; they are detected by an InGaAs photodetector with a 150 MHz bandwidth and an 800–1700 nm wavelength range and analyzed with an oscilloscope of 2.5 GHz bandwidth. In general, as the output power increases, the intensity fluctuation is alleviated. Obviously, there is a strong fluctuation at the power of 32 W. After Fourier transform of the temporal information in this case, a frequency signal at 657 kHz is obtained. However, intensity noise at this frequency is not observed in the 1064 nm pump laser. The intensity modulation at this frequency in the 1480 nm RFL may be due to nonlinear dynamics in the cascaded Raman fiber oscillator[ Reference Steinke, Neumann, Kracht and Wessels 24 ] and will be further investigated in the future.

Figure 3 Normalized temporal behavior of the 1480 nm pump laser versus output power. There is a strong fluctuation at the power of 32 W.
At the power of 0.85 W, just above the threshold, the output is volatile and the peak-to-peak fluctuation is 49.7% with a standard deviation of 4.9%. When the output power increases to 7.7 W, the peak-to-peak fluctuation and standard deviation decrease to 31.6% and 3.6%, respectively. At the power of 32 W, the strong modulation causes peak-to-peak fluctuation up to 52.1% and a standard deviation up to 10.2%. When the power increases further, the intensity modulation at the frequency of 657 kHz is gradually weakened but does not disappear. At the highest power, the peak-to-peak fluctuation and the standard deviation are only 12.8% and 1.6%, respectively, indicating that the 1480 nm pump laser tends to be stable in the time domain. The temporal fluctuation of the 1480 nm pump laser will influence the RIN of the 1560 nm amplifier output. A detailed RIN measurement of the 1480 nm pump laser is given in the following section, together with the measurement of the signal laser.
3.2 Co-pumped SF 1560 nm amplifier
Firstly, the SF 1560 nm laser is amplified in the EYDF, which is co-pumped by the 1480 nm RFL. A 10-cm-long single-mode fiber is spliced at the end of the gain fiber as the output fiber, and taper splicing is used to reduce the loss to less than 2%. Figure 4(a) shows the pure 1560 nm output power versus the 1480 nm pump power. At an incident power of 61.7 W of the 1480 nm pump laser, a 1560 nm laser with a maximum output power of 59.1 W is achieved, corresponding to a slope efficiency of 90.1%. The output beam is linearly polarized with a polarization extinction ratio of 18.7 dB. The SBS in the main amplifier is monitored by measuring the backward propagating power. When the output power reaches 59.1 W, the backward power exhibits an exponential increase to 2.2 mW, as shown in Figure 4(a). We stopped further increasing the pump power to avoid possible damage due to SBS.
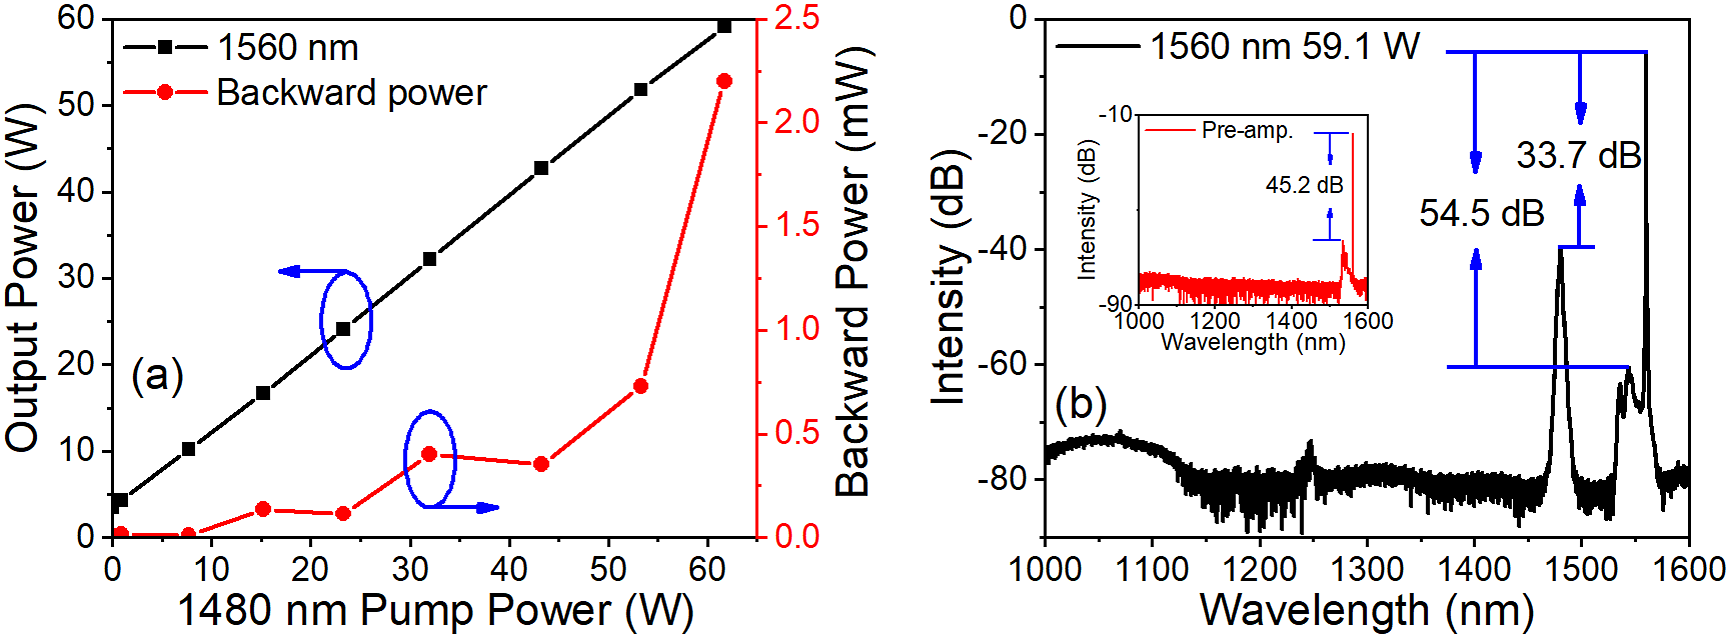
Figure 4 The co-pumped configuration. (a) The output power of 1560 nm laser and the backward power versus pump power. The backward power exhibits an exponential increase. (b) The spectrum of 1560 nm at maximum output power. Inset: output spectrum of the 1560 nm pre-amplifier. The ratio of the 1560 nm signal laser to the residual 1480 nm pump laser is 33.7 dB.
The output spectrum of the amplifier at the maximum output power is plotted in Figure 4(b). The ratio of the 1560 nm signal laser to the residual 1480 nm pump is 33.7 dB and that to the Er ASE is 54.5 dB. The Er ASE is transmitted from the pre-amplifier, as illustrated in the inset of Figure 4(b). The spectral purity is 98.4% for the 1560 nm signal, which is calculated by the contribution of different lines in the output spectrum. The bump from 1000 to 1150 nm shown in Figure 4(b) is caused by the noise of the optical spectrum analyzer rather than Yb ASE[Reference Matniyaz, Kong, Kalichevsky-Dong and Dong9].
The fine spectra of the 1560 nm laser are measured when increasing the output power, as shown in Figure 5(a). It is found that the 3 dB linewidth of the 1560 nm laser remains the same. However, there is an obvious background spectral broadening: the –60 dB linewidth broadens from 0.34 to 4.94 nm when the output power is increased from 4.1 to 59.1 W. The spectral pedestal increases to –34.9 dB from the signal peak. A similar phenomenon has been reported in SF Raman fiber amplifiers co-pumped by an oscillator-based laser, where the SF characteristic is not maintained[Reference Miao, Ma, Liu, Zhang and Zhou25–Reference Cheng, Cui, Zeng, Zhou and Feng27].

Figure 5 The co-pumped configuration. (a) Fine spectra of the 1560 nm laser at different output powers. There is an obvious background spectral broadening. (b) The spectra at different output powers measured by the delayed self-heterodyne method. The 4.3, 10.2, 32.2 and 59.1 W output powers of the 1560 nm signal laser correspond to 0.85, 7.7, 32 and 61.7 W powers of the 1480 nm pump laser, respectively.
To characterize the laser spectrum with higher precision, the delayed self-heterodyne technique[ Reference Okoshi, Kikuchi and Nakayama 28 ] is used to measure the linewidth of the 1560 nm SF laser. The resolution of the linewidth measurement is determined by the delay fiber, which is 31 km in the measurement setup. The laser is frequency-shifted by an acousto-optic modulator operating at a frequency of 150 MHz. As shown in Figure 5(b), the spectral width shows output power independence and the 20 dB linewidth is 155.2 kHz, implying that the SF laser linewidth is 7.8 kHz. In addition, at the output power of 32 W, two secondary peaks at separation of 657 kHz from the acousto-optic modulator shift frequency are observed, which are due to the intensity noise transferred from the 1480 nm pump laser.
To understand the mechanism of the background spectral broadening, the EYDF in the main amplifier is replaced by a piece of passive fiber (PM 12/130, Coherent, Inc.), which has the same length and same core/cladding diameter as the EYDF. A similar background spectral broadening is observed under the 1480 nm pump, as shown in Figure 6. At the pump power of 61.7 W, the –60 dB linewidth of 1560 nm is about 5.85 nm, even slightly wider than the EYDF amplifier case. The signal laser is barely amplified by stimulated Raman scattering due to the short fiber length.

Figure 6 Fine spectra of the 1560 nm laser at different pump powers of 1480 nm in a co-pumped manner, when the EYDF gain fiber is replaced by a passive fiber. There is also an obvious background spectral broadening.
According to Ref. [Reference Di Domenico, Schilt and Thomann29], the spectral wings are only attributed to the high-frequency noise, which is transferred from the pump laser during the amplification. A spectrum analyzer (Keysight N9020A) is used to analyze the RIN characteristic of the laser. The RIN spectra of the pre-amplifier signal, the 1480 nm pump and the 1560 nm laser are depicted in Figure 7 at the output powers of 32.2 and 59.1 W, respectively. The RIN of the pre-amplifier signal laser retains low noise of about –144 dBc/Hz in the frequency range from 20 kHz to 10 MHz. The discrete noise peaks around 500 kHz are probably caused by the test system. In the frequency range of 1–3 kHz, the large bump of the RIN is caused by ASE[Reference Darwich, Bardin, Goeppner, Dixneuf, Guiraud, Traynor, Santarelli and Hilico30]. Notably, this noise bump would not transfer to the amplified output laser due to the low-cutoff behavior for seed noise[ Reference Tunnermann, Neumann, Kracht and Wessels 31 ].

Figure 7 The co-pumped configuration: the RIN of the 1560 nm signal laser and corresponding pump laser at output powers of (a) 32.2 W and (b) 59.1 W. The noise at 657 kHz and the beat noise of the pump laser are transmitted to the signal laser.
When the pump power is 32 W, the RIN of signal laser is 7 dB higher than that of the pump laser in the frequency from 100 Hz to 20 kHz. For the range above 60 kHz, the RIN of the signal laser is lower than that of the pump laser, as shown in Figure 7(a). However, at the pump power of 61.7 W, the signal laser noise is almost equal to the pump noise in the range from 400 Hz to 100 kHz and it decreases gradually above 100 kHz, as shown in Figure 7(b). At frequencies above 3 MHz, the RIN of the amplified output and the pre-amplifier signal shows consistency due to the high-pass behavior in the fiber amplifier. The decrease of the RIN difference between the signal and pump laser at the low frequency is caused by gain saturation in the gain medium[ Reference Guiraud, Traynor and Santarelli 32 ]. The intensity noise below 400 Hz may be mainly affected by environmental noise. The whole RIN spectrum of the amplifier shows a low-pass behavior for the pump laser noise. According to Ref. [Reference Tunnermann, Neumann, Kracht and Wessels31], the pump fluctuations couple to output power below the corner frequency of the amplifier but not above, which is determined by the population of the upper laser level.
The noise at the frequency of 657 kHz, its harmonics and the beat noise between the longitudinal mode[ Reference Cheng, Pan, Zeng, Dong, Cui and Feng 33 ] of the 1480 nm pump laser are all transmitted to the signal laser, causing obvious noise fluctuations in the high frequency range (>100 kHz). Significantly, the RIN decreases from –130 dBc/Hz at 300 kHz to –145 dBc/Hz at 10 MHz and shows independence of the output power. However, in the low frequency range (<100 kHz), the RIN decreases from –110 to –130 dBc/Hz as the output power increases.
3.3 Counter-pumped SF 1560 nm amplifier
The counter-pumped structure is usually considered to acquire laser amplification with high spectral purity. In the case of counter-pumping, a third WDM (not drawn in Figure 1) is used in the pump port to reduce the signal light entering the pump laser path because of the low splitting ratio of WDM 2. The additional WDM increases the insertion loss for the pump laser, which is about 0.5 dB. The passive fiber after the EYDF is 70 cm longer than that in the co-pumped case.
Figure 8(a) shows the output power of the SF 1560 nm laser in this case as a function of the pump power. Compared with the co-pumped amplifier, the highest output power is only 50.5 W and the slope efficiency is only 72.3%, with the polarization extinction ratio of approximately 18.4 dB. The further increase of output is not pursued due to the nonlinear increase of the backward light. The spectrum of the 1560 nm laser with an output power of 47.8 W obtained at an incident power of 61.7 W of the 1480 nm pump laser is shown in Figure 8(b). Only the SF 1560 nm laser is observed in the whole spectrum. The Er ASE suppression is about 57.9 dB, slightly more than that of the pre-amplifier.

Figure 8 The counter-pumped configuration. (a) The output power of the 1560 nm laser and backward power versus pump power. The backward power exhibits a nonlinear increase. (b) The spectrum of 1560 nm at output power of 47.8 W. The ratio of the 1560 nm signal laser to the Er ASE is 57.9 dB.
The fine spectra of the SF 1560 nm laser are measured at the same pump power as that in the co-pumped case and are shown in Figure 9(a). It is found that the spectra at different powers retain a good consistency without any broadening. By comparing the results with those of the co-pumping configuration, it is concluded the background spectral broadening in the co-pumping case is due to the XPM effect between the 1480 nm pump laser and the 1560 nm signal laser. Please note, although the 1480 nm pump laser is continuous-wave, its intensity fluctuates at high frequency due to longitudinal mode beating. The counter-pumping configuration suppresses the XPM effect of the high-frequency contribution due to the walk-off effect between the pump and the signal light, and prevents the background spectral broadening. Meanwhile, the linewidth measured by the delayed self-heterodyne method is shown in Figure 9(b). The linewidth maintains good SF characteristics. However, the noise at the frequency of 657 kHz is also preserved in the output spectrum of 25.9 W obtained at 32 W pump power. Please note that the additional peaks at the frequency of 324 kHz are from the seed laser, as they are present also in the seed laser spectrum.

Figure 9 The counter-pumped configuration. (a) Fine spectra of the 1560 nm laser at different powers. There is no obvious background spectral broadening. (b) The spectra at different output powers measured by the delayed self-heterodyne method. The 3.4, 8.2, 25.9 and 47.8 W output powers of the 1560 nm signal laser correspond to 0.85, 7.7, 32 and 61.7 W powers of the 1480 nm pump laser, respectively.
The intensity noise of the SF 1560 nm laser counter-pumped by the 1480 nm pump laser is shown in Figure 10; also shown in the figure is the noise of the 1560 nm laser in the co-pumped case with the same pump power. Interestingly, one can find that at the pump power of 32 W, the SF laser is amplified to 25.9 and 32.2 W in the counter- and co-pumped cases, respectively, but the RIN properties in the frequency range up to 10 MHz are the same. When the pump power is 61.7 W, a similar phenomenon can be observed in the figure. Therefore, although the spectral pedestal is increased in the co-pumping configuration, the amplifier performs indistinguishably in terms of laser linewidth and RIN in the studied frequency range for both configurations. The suppression of the XPM effect due to walk-off between the pump and signal light in the counter-pumped scheme only works at frequencies much higher than 10 MHz, since the amplifier is only a few meters long.

Figure 10 RIN of the 1560 nm signal laser at different output powers using different pump manners. The 25.9 and 32.2 W powers of the 1560 nm signal laser correspond to 32 W power of the 1480 nm pump laser in the counter-pumping and co-pumping manners, respectively. The 47.8 and 59.1 W powers of the 1560 nm signal laser correspond to 61.7 W power of the 1480 nm pump laser in the counter-pumping and co-pumping manners, respectively.
Except for the common low-pass behavior for pump noise and high-pass behavior for seed noise, the RIN characteristics here still have some differences from that in the cladding pump manner, such as those in Ref. [Reference Darwich, Bardin, Goeppner, Dixneuf, Guiraud, Traynor, Santarelli and Hilico34]. In cladding pumped 1.5 μm SF fiber amplifiers, the RIN at a high frequency is influenced by the Er ASE level, which is related to the pump wavelength and direction. When the Er ASE can be ignored (e.g., optical signal-to-noise ratio higher than 50 dB), the RIN of the cladding pumped amplifier at a high frequency is only determined by the seed noise. In contrast, in the core-pumped amplifier, the pump noise affects the whole frequency range from 100 Hz to 10 MHz. By increasing the pump power from 32 to 61.7 W, the RIN of the low-frequency floor (3–10 kHz) is decreased by about 20 dB. In spite of high-frequency cutoff behavior for the pump noise, the special noise at 657 kHz and the beat noise are still able to be transmitted to the output laser.
4 Conclusion
In conclusion, a core-pumped SF 1560 nm linearly polarized laser with output power of up to 59.1 W is obtained with a fundamental mode at the pump power of 61.7 W at 1480 nm, with a slope efficiency of 90.1% and a polarization extinction ratio of 18.7 dB. In addition, the spectral and noise characteristics of the high-power SF 1560 nm laser are studied. In a co-pumped manner, the background spectrum shows an obvious increase with the increase of the output power. A comparative experiment depicts that the spectral pedestal increase is related to the XPM effect between the pump and the signal laser. In the counter-pumped manner, the nonlinear modulation process is suppressed by the walk-off between the pump and the signal light, and the spectra maintain a good consistency with the variation of output powers.
The noise characteristics of the 1560 nm laser show low-pass behavior in terms of pump laser noise. In the low frequency range, the RIN is affected by the pump laser and environment noise. In the high frequency range, special noises of the pump laser, such as the beat noise between longitudinal modes, are all transmitted to the signal laser at middle output power, causing obvious intensity fluctuations. However, this is avoidable in the high-power amplifier, since the fluctuation of the 1480 nm pump laser becomes minimal during its power scaling. The high-frequency cutoff behavior of the amplifier further attenuates the fluctuation. As a result, there is no secondary peak in the linewidth spectrum at the highest output power and the RIN at a high frequency becomes stable. However, RIN spectra in the frequency range up to 10 MHz of the amplifier at the same pump power remain the same in different pump manners.
The results have guiding significance for high-power SF rare-earth ion-doped fiber amplifiers, especially for in-band pumped amplifiers. On the one hand, since the power of the 1480 nm laser can reach up to about 300 W[ Reference Supradeepa and Nicholson 23 ], it is easier to generate a higher output power at 1560 nm with this method. The limitation of the power scaling may be the SBS effect in the single-mode fiber, as for SF laser operation. However, many techniques have been developed to suppress the SBS effect in the past, such as step-distributed longitudinal strain imposed on the active fiber, an acoustically tailored active fiber, and large-mode active fiber. On the other hand, in order to obtain a high-power low-noise SF laser output, it is particularly important to optimize the pump laser noise.
Acknowledgement
This work was supported by the National Key R&D Program of China (Nos. 2020YFB1805900 and 2020YFB0408300) and the National Natural Science Foundation of China (No. 62075226).


 Open access