


1 Introduction
For inertial confinement fusion (ICF)[Reference Nuckolls, Wood, Thiessen and Zimmerman1, Reference Lindl2] and high energy density physics research, a few large high power laser facilities have been built, such as National Ignition Facility (NIF)[Reference Paisner, Campbell and Hogan3] in the United States, Laser Megajoule (LMJ)[Reference André4] in France, and series of Shen-Guang facilities[Reference Lin, Deng, Fan, Wang, Chen, Zhu, Qian, Shen, Xu and Zhu5–Reference Zhu, Xie, Yang, Kang, Zhu, Guo, Zhu, Gao, Liu and Fan9] in China. The final optics assembly (FOA)[Reference Wegner, Auerbach, Biesiada, Dixit, Lawson, Menapace, Parham, Swift, Whitman and Williams10–Reference Jiao, Sun, Zhao and Zhu13] is at the end of the whole laser beam line in high power laser driver, which converts the $1\unicode[STIX]{x1D714}$
laser to the
$1\unicode[STIX]{x1D714}$
laser to the $3\unicode[STIX]{x1D714}$
laser and focuses the
$3\unicode[STIX]{x1D714}$
laser and focuses the $3\unicode[STIX]{x1D714}$
laser to the target. It is a key system combining the main laser system with the physical experiments in the target chambers. The bottleneck of the high power laser driver is also in the high performance of FOA and its load capacity. It is difficult to achieve the safe and stable transmission of high fluence
$3\unicode[STIX]{x1D714}$
laser to the target. It is a key system combining the main laser system with the physical experiments in the target chambers. The bottleneck of the high power laser driver is also in the high performance of FOA and its load capacity. It is difficult to achieve the safe and stable transmission of high fluence $3\unicode[STIX]{x1D714}$
laser in the FOA because there are many problems related to science, technology and engineering to be solved.
$3\unicode[STIX]{x1D714}$
laser in the FOA because there are many problems related to science, technology and engineering to be solved.
NIF is the largest high power laser system in the world. Its FOA development has undergone several integrated verifications and design improvements. The conceptual design[Reference Paisner, Boyes, Kumpan, Lowdermilk and Sorem14] was done in 1994. In 1998, the first integrated test of FOA was carried out in the beamlet, which exposed the serious ultraviolet damage problem[Reference Hunt15]. The FOA was redesigned for the corresponding improvements, including using wedge focus lens instead of color separation grating, using the continuous phase plate instead of a Kinoform phase plate, adding 10 torr atmosphere environment and online replacement of ultraviolet components. In 2006, the second integrated verifications of the FOA were carried out on the NIF precision diagnostic system (PDS)[Reference Parham, Azevedo, Chang, Conder, Heestand, Henesian, Kegelmeyer, Liebman, Manes, Norton, Nostrand, Wegner, Williams, Whitman and Yang16]. Some problems were further exposed in the experiments. Then the arrangement of optical components spacing was optimized to avoid the hot image damage. In 2007, NIF completed the final design of the FOA. In recent years, the operation of $8~\text{J}/\text{cm}^{2}$
peak fluence was constrainedly achieved after all these efforts, supported by the optical element recycle strategy[Reference Spaeth, Wegner, Suratwala, Nostrand, Bude, Conder, Folta, Heebner, Kegelmeyer and MacGowan17]. Unlike NIF, the LMJ took a different technology route for its FOA design[Reference Adolf, Boscheron, Dulac and Journot11]. A focusing grating was used to focus the
$8~\text{J}/\text{cm}^{2}$
peak fluence was constrainedly achieved after all these efforts, supported by the optical element recycle strategy[Reference Spaeth, Wegner, Suratwala, Nostrand, Bude, Conder, Folta, Heebner, Kegelmeyer and MacGowan17]. Unlike NIF, the LMJ took a different technology route for its FOA design[Reference Adolf, Boscheron, Dulac and Journot11]. A focusing grating was used to focus the $3\unicode[STIX]{x1D714}$
laser and separate different wavelengths simultaneously. Compared to that in NIF, the FOA in LMJ is simpler in structure, which avoids the use of a thick wedged focus lens. But due to the low damage threshold of the grating structure, high fluence laser will easily cause the damage of the grating, thus affecting the safety and operation efficiency of the whole system. The designed laser fluence for LMJ is
$3\unicode[STIX]{x1D714}$
laser and separate different wavelengths simultaneously. Compared to that in NIF, the FOA in LMJ is simpler in structure, which avoids the use of a thick wedged focus lens. But due to the low damage threshold of the grating structure, high fluence laser will easily cause the damage of the grating, thus affecting the safety and operation efficiency of the whole system. The designed laser fluence for LMJ is $6~\text{J}/\text{cm}^{2}$
. However the routine operation fluence is slightly lower than
$6~\text{J}/\text{cm}^{2}$
. However the routine operation fluence is slightly lower than $3~\text{J}/\text{cm}^{2}$
[Reference Miquel and Volant18]. Meanwhile the optimization design of FOA and the influence of pollution particle on the laser induced damage are also investigated based on the prototype Laser Integration Line.
$3~\text{J}/\text{cm}^{2}$
[Reference Miquel and Volant18]. Meanwhile the optimization design of FOA and the influence of pollution particle on the laser induced damage are also investigated based on the prototype Laser Integration Line.
Actually the main external difference among the representative international FOA lies in the color separation technique and the harmonic conversion crystal. But, the greatest internal challenge to the FOA is to attain high laser performance while maintain low optical damage. High performance and high damage resistance are two demanding aspects of FOA. However, damage problem of final optics at 351 nm is one of the bottlenecks of the high power laser systems. The safe and stable operation of FOA at 351 nm with high fluence is affected by the laser damage, which is related to materials, manufacturing, design and engineering.
In this article, the design and performance of the FOA in SG-II Upgrade laser facility are mainly reported. The SG-II Upgrade laser facility[Reference Zhao, Wan, Lin, Shao and Zhu12] is a kilojoule-level solid state laser system constructed by the National Laboratory on High Power Laser and Physics. Eight amplified 1053 nm beams from the Nd:glass driver are transported in $2\times 2$
quads with aperture size of
$2\times 2$
quads with aperture size of $310~\text{mm}\times 310~\text{mm}$
to the 2.4 m diameter target chamber. There,
$310~\text{mm}\times 310~\text{mm}$
to the 2.4 m diameter target chamber. There, $1\unicode[STIX]{x1D714}$
laser beam is converted to the third harmonic and finally focused to the target by the FOA. However, in order to get smaller focal spot and also due to the limited space, the focal length of the FOA in SG-II Upgrade laser facility is 2.2 m. For a fixed laser intensity, the breakup integral is proportional to the whole optical thickness in the FOA. Focus lens of shorter focal length will be thicker than longer focal length to meet a fixed harmonic separation. Our FOA will face bigger challenge for short focal length and limited space because it is much more difficult to manage the stray light and control the breakup integral than the longer focal length. At last, two key technologies developed to improve the FOA performance in the engineering process are also reported.
$1\unicode[STIX]{x1D714}$
laser beam is converted to the third harmonic and finally focused to the target by the FOA. However, in order to get smaller focal spot and also due to the limited space, the focal length of the FOA in SG-II Upgrade laser facility is 2.2 m. For a fixed laser intensity, the breakup integral is proportional to the whole optical thickness in the FOA. Focus lens of shorter focal length will be thicker than longer focal length to meet a fixed harmonic separation. Our FOA will face bigger challenge for short focal length and limited space because it is much more difficult to manage the stray light and control the breakup integral than the longer focal length. At last, two key technologies developed to improve the FOA performance in the engineering process are also reported.
2 Design of the FOA
The FOA is at the end of the whole laser beam line in high power laser driver, which is a key subsystem connecting the laser system with the physical experiments. The FOA has multiple functions including harmonic conversion, color separation, laser focusing, beam sampling, debris shielding, vacuum sealing and so on. Thus it is very challenging to produce such an FOA from scientific and engineering aspect.
2.1 Design specifications
Generally, the FOA has to meet the fundamental needs in two aspects. From the physical aspect, $3\unicode[STIX]{x1D714}$
laser energy must be applied into the target hole as much as possible and a certain uniformity of laser focal spot must be achieved. From the laser driver aspect, the triple frequency conversion efficiency must be high enough to obtain high fluence 351-nm laser. Meanwhile the FOA should be in safe and stable operation without serious optical damage. The main design specifications for the FOA are listed in Table 1. Here the diffraction limitation (DL) in diameter is
$3\unicode[STIX]{x1D714}$
laser energy must be applied into the target hole as much as possible and a certain uniformity of laser focal spot must be achieved. From the laser driver aspect, the triple frequency conversion efficiency must be high enough to obtain high fluence 351-nm laser. Meanwhile the FOA should be in safe and stable operation without serious optical damage. The main design specifications for the FOA are listed in Table 1. Here the diffraction limitation (DL) in diameter is $6~\unicode[STIX]{x03BC}\text{m}$
.
$6~\unicode[STIX]{x03BC}\text{m}$
.
Table 1. Main design specifications for the FOA.
2.2 Physical design
Let us give the design logic of our FOA at the beginning. According to the operation fluence and component processing capacity, the FOA configuration can be determined. Then through the stray light analysis, the general component arrangement can be decided. At the same time the far-field focal spot energy concentration determines the tolerance of the optical axis deviation. At last, in order to avoid the self-focusing and filamentation damage problem, the breakup integral (B integral) in the FOA must be controlled under certain value.
According to the designed laser fluence of $3~\text{J}/\text{cm}^{2}$
and 2 mm separation among the focal points of the different harmonics, the wedged focus lens is chosen in the FOA to achieve the functions of focusing and color separation[Reference Jiao, Zhao, Sun, Ren and Zhu19]. And
$3~\text{J}/\text{cm}^{2}$
and 2 mm separation among the focal points of the different harmonics, the wedged focus lens is chosen in the FOA to achieve the functions of focusing and color separation[Reference Jiao, Zhao, Sun, Ren and Zhu19]. And $\text{I}+\text{II}$
KDP (potassium dihydrogen phosphate) crystals are used to achieve high frequency conversion efficiency[Reference Ma, Wang, Yuan, Xie and Qian20–Reference Ma, Kafka and Chowdhury22]. The thicknesses of the two KDP crystals are 12 mm and 10 mm, respectively. The sketch of FOA in SG-II Upgrade facility is shown in Figure 1. There are mainly several components in the FOA, including continuous phase plate (CPP), vacuum window, frequency conversion crystals, wedged focus lens, beam sampling grating (BSG) and disposable debris shield (DDS).
$\text{I}+\text{II}$
KDP (potassium dihydrogen phosphate) crystals are used to achieve high frequency conversion efficiency[Reference Ma, Wang, Yuan, Xie and Qian20–Reference Ma, Kafka and Chowdhury22]. The thicknesses of the two KDP crystals are 12 mm and 10 mm, respectively. The sketch of FOA in SG-II Upgrade facility is shown in Figure 1. There are mainly several components in the FOA, including continuous phase plate (CPP), vacuum window, frequency conversion crystals, wedged focus lens, beam sampling grating (BSG) and disposable debris shield (DDS).
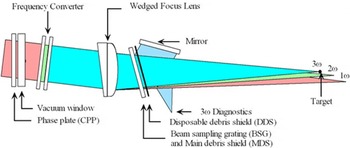
Figure 1. The sketch of FOA in SG-II Upgrade facility.
With the increase of laser beams and laser energy, the number of optical components and equipment for measurement in the target systems will also be multiplied. To save space, reduce the B integral and increase the clear aperture, it is the latest trend to use the wedged focus lens in the FOA. A coaxial wedged focus lens is designed in the FOA as shown in Figure 1, and it is different from that in NIF, which is an off-axis lens. The advantage of this lens design is that we can use the wedge angle to flexibly control the color separation value while the separation value of the off-axis lens is fixed for a specific focal length and a specific off-axis distance. For the off-axis lens, the separation is related to the off-axis distance and the focal length. The off-axis distance depends on the distance of the two focus lenses in a quad. The distance of two focus lenses is related to the spatial arrangement of the amplifier system. For the coaxial lens, we can get different harmonic separations through different wedge angles with the same focal length and the same amplifier system. When the construction of facility is completed, if there is a demand for bigger separation in the future, we could replace with a focus lens of bigger wedge angle and the same focal length to accomplish the demand. This is an advantage in the design phase. Actually, the coaxial lens was chosen also according to the capacity of optical processing, detection and alignment in China at that time. This was the first attempt for wedged focus lens in high power laser facility in China. It was less risky to choose the coaxial lens scheme. For the coaxial wedged focus lens, when the color separation value is a settled value determined by the physical requirement, the shorter the focal length is, the bigger the needed wedge angle is, and thus the thicker the wedged focus lens is. The focal length of the wedged focus lens in SG-II Upgrade facility is 2.2 m, much shorter than 7.7 m in NIF. The wedge angle of the lens is $11.22^{\circ }$
and the thickness in the middle of the lens is 78.5 mm. So the lens will be much thicker, resulting in the difficulty of B integral control.
$11.22^{\circ }$
and the thickness in the middle of the lens is 78.5 mm. So the lens will be much thicker, resulting in the difficulty of B integral control.
Then the detailed analysis of FOA design is reported. First, it is important to analyze the ghost image[Reference Zhao, Wu, Lin, Zhu and Wang23] in order to avoid the optical component damage caused by the irradiation of stray light on the optical component or the metal surface. Here the optical design software ASAP is used for stray light distribution modeling and analysis. It is mainly done based on ray tracing and we can change the spacing and angle of optics in the FOA to control the stray light. Here the effect of the phase plate is not included in such simulations. Considering the degeneration of the chemical coating with operational time, its single reflectivity is set to be 1% rather than 0.5%. The ghost image is analyzed to the fourth order. The energy is about $10~\unicode[STIX]{x03BC}\text{J}$
, which still may damage the element because of focusing. The final optimized ghost image distribution result of FOA is shown in Figure 2. The red one stands for the
$10~\unicode[STIX]{x03BC}\text{J}$
, which still may damage the element because of focusing. The final optimized ghost image distribution result of FOA is shown in Figure 2. The red one stands for the $3\unicode[STIX]{x1D714}$
ghost image, and the blue one stands for the
$3\unicode[STIX]{x1D714}$
ghost image, and the blue one stands for the $1\unicode[STIX]{x1D714}$
ghost image. The location of
$1\unicode[STIX]{x1D714}$
ghost image. The location of $2\unicode[STIX]{x1D714}$
ghost image is between those of the
$2\unicode[STIX]{x1D714}$
ghost image is between those of the $1\unicode[STIX]{x1D714}$
and
$1\unicode[STIX]{x1D714}$
and $3\unicode[STIX]{x1D714}$
ghost images, which is not shown here. Through the ghost image analysis, the arrangement of optical element in the FOA can be optimized, including the optical element spacing, angle of each element according to the optical axis and the basic parameter of the wedged focus lens.
$3\unicode[STIX]{x1D714}$
ghost images, which is not shown here. Through the ghost image analysis, the arrangement of optical element in the FOA can be optimized, including the optical element spacing, angle of each element according to the optical axis and the basic parameter of the wedged focus lens.
Figure 2. Final optimized ghost image distribution result of FOA.
Second, the focal spot characteristics of the FOA are analyzed. The initial condition for the analysis is as follows: (1) The input light is twelfth order super-Gaussian beams with aperture of $310~\text{mm}\times 310~\text{mm}$
. (2) The peak to valley (PV) transmitted wavefront of fused silica component is
$310~\text{mm}\times 310~\text{mm}$
. (2) The peak to valley (PV) transmitted wavefront of fused silica component is $1/3\unicode[STIX]{x03BB}~(\unicode[STIX]{x03BB}=632.8~\text{nm})$
and that of crystal and debris shield is
$1/3\unicode[STIX]{x03BB}~(\unicode[STIX]{x03BB}=632.8~\text{nm})$
and that of crystal and debris shield is $1\unicode[STIX]{x03BB}$
. The BSG is 8 mm thick and is etched on the rear surface of fused silica substrate. The grating structure is similar to an off-axis Fresnel zone plate. The negative first order light is used for sampling, which accounts for about 0.1% of the whole energy. The BSG is tilted in the focusing light path in order to manage the stray light. But it would cause a coma in the far field. Calculation results show that when the wedged focus lens is reversely rotated by
$1\unicode[STIX]{x03BB}$
. The BSG is 8 mm thick and is etched on the rear surface of fused silica substrate. The grating structure is similar to an off-axis Fresnel zone plate. The negative first order light is used for sampling, which accounts for about 0.1% of the whole energy. The BSG is tilted in the focusing light path in order to manage the stray light. But it would cause a coma in the far field. Calculation results show that when the wedged focus lens is reversely rotated by $160~\unicode[STIX]{x03BC}\text{rad}$
with respect to BSG and the debris shield, the coma in the far field can be balanced and thus a good focal spot can be obtained. The focal spot distribution of FOA is shown in Figure 3. And 95% of laser energy is concentrated in 2.2 DL. The optical axis deviation tolerance of the wedged focus lens is
$160~\unicode[STIX]{x03BC}\text{rad}$
with respect to BSG and the debris shield, the coma in the far field can be balanced and thus a good focal spot can be obtained. The focal spot distribution of FOA is shown in Figure 3. And 95% of laser energy is concentrated in 2.2 DL. The optical axis deviation tolerance of the wedged focus lens is $\pm 180~\unicode[STIX]{x03BC}\text{rad}$
when the focal spot is increased no more than 0.5 DL as shown in Figure 4.
$\pm 180~\unicode[STIX]{x03BC}\text{rad}$
when the focal spot is increased no more than 0.5 DL as shown in Figure 4.
Figure 3. Focal spot distribution of FOA.
Figure 4. Diameter for 95% of the focal spot energy versus the optical axis deviation.
Third, it is also necessary to control the B integral. B integral is used to evaluate the possibility of small scale self-focusing, which is one of the criteria to design and evaluate the overall performance of a high power laser system. For simplicity, the laser intensity in the FOA is considered as a constant. And the nonlinear index of the component is taken as $n_{\text{2}}=0.88\times 10^{-13}~\text{esu}$
. The residual
$n_{\text{2}}=0.88\times 10^{-13}~\text{esu}$
. The residual $1\unicode[STIX]{x1D714}$
laser takes half of all the residual light energy. The intensity of
$1\unicode[STIX]{x1D714}$
laser takes half of all the residual light energy. The intensity of $1\unicode[STIX]{x1D714}$
,
$1\unicode[STIX]{x1D714}$
, $2\unicode[STIX]{x1D714}$
and
$2\unicode[STIX]{x1D714}$
and $3\unicode[STIX]{x1D714}$
lasers can be acquired based on the given conversion efficiency. Then the B integral caused by each wavelength is calculated respectively. At last three B integrals are summed up as the total B integral. The B integral is mainly controlled by the total thickness of the component. Calculation parameters are shown in Table 2. Two kinds of B integral are calculated. The average B integral is 1.307 and the peak B integral is about 1.8. The design point is controlled under the risk of small scale self-focusing. Through analysis of the first to the fourth order of stray light, focal spot energy concentration and B integral limit, the configuration of the FOA and the specific parameter of each component can be identified.
$3\unicode[STIX]{x1D714}$
lasers can be acquired based on the given conversion efficiency. Then the B integral caused by each wavelength is calculated respectively. At last three B integrals are summed up as the total B integral. The B integral is mainly controlled by the total thickness of the component. Calculation parameters are shown in Table 2. Two kinds of B integral are calculated. The average B integral is 1.307 and the peak B integral is about 1.8. The design point is controlled under the risk of small scale self-focusing. Through analysis of the first to the fourth order of stray light, focal spot energy concentration and B integral limit, the configuration of the FOA and the specific parameter of each component can be identified.
Table 2. Calculation parameters for B integral.
2.3 Optomechanical design of FOA
Based on the physical aim of FOA, the optomechanical design of FOA is carried out. The FOA should be reliable and easy for maintenance and implementation. The final optics system adopts the modular design. The components including wedged focus lens, crystal, BSG and DDS are replaceable online with certain precision. The FOA is kept at low vacuum sealing to ensure the stable performance of the chemical coating on the component. Meanwhile there is also an adjusting reference interface for 4D interferometer at the entrance of the taper tube, which will be mentioned in Section 4. The installation interfaces for air flow purging, temperature control, monitoring and balance control of atmospheric pressure, stray light absorption and side lighting of component are all reserved. They are designed to be easy for removal. The influence of the online FOA gesture and the working environment on the overall structural design is also considered. By the way, the structure material of the FOA is aluminum and the surface is specially treated. The concrete structure design is shown in Figure 5.
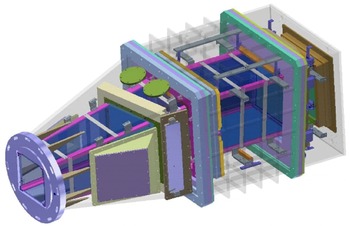
Figure 5. Concrete structure design of FOA.
3 Integrated performance of the FOA
The SG Upgrade laser facility has eight high power laser beams. They are reflected by the mirrors and then focused into the target chamber center by the FOA. The experimental setup of FOA in the target system is shown in Figure 6. In total 61 shots of large energy laser have been experimentally launched to investigate the performance of the FOA[Reference Jiao, Zhao, Sun, Ren and Zhu19, Reference Zhao, Wu, Lin, Zhu and Wang23], including the laser energy fluence, frequency conversion efficiency and the laser focus performance. The maximum fluence of $3\unicode[STIX]{x1D714}$
laser is
$3\unicode[STIX]{x1D714}$
laser is $5.2~\text{J}/\text{cm}^{2}$
. The laser energy conversion efficiency is more than 72%. And the laser perforation efficiency across
$5.2~\text{J}/\text{cm}^{2}$
. The laser energy conversion efficiency is more than 72%. And the laser perforation efficiency across $800~\unicode[STIX]{x03BC}\text{m}$
at 3000 J is more than 96%.
$800~\unicode[STIX]{x03BC}\text{m}$
at 3000 J is more than 96%.
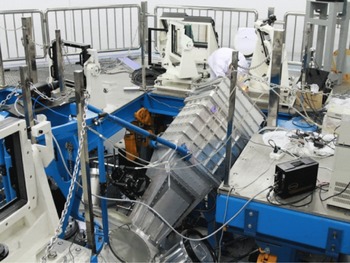
Figure 6. Experimental setup of FOA in the target system.
3.1 Laser fluence
Laser fluence is an important parameter for the FOA. In total 61 shots of large energy $3\unicode[STIX]{x1D714}$
laser have been launched in one of the eight beams in SG-II Upgrade laser facility. The output
$3\unicode[STIX]{x1D714}$
laser have been launched in one of the eight beams in SG-II Upgrade laser facility. The output $3\unicode[STIX]{x1D714}$
laser energy in the FOA is about 1500–5000 J during the experiment. The laser pulse has a top hat temporal profile with different durations. The maximum laser fluence is
$3\unicode[STIX]{x1D714}$
laser energy in the FOA is about 1500–5000 J during the experiment. The laser pulse has a top hat temporal profile with different durations. The maximum laser fluence is $5.2~\text{J}/\text{cm}^{2}$
. Experimental parameters of
$5.2~\text{J}/\text{cm}^{2}$
. Experimental parameters of $3\unicode[STIX]{x1D714}$
laser energy, power and fluence are shown in Figure 7.
$3\unicode[STIX]{x1D714}$
laser energy, power and fluence are shown in Figure 7.
Figure 7. Experimental parameters of $3\unicode[STIX]{x1D714}$
energy, power and fluence.
$3\unicode[STIX]{x1D714}$
energy, power and fluence.
Meanwhile, the laser induced damage in the FOA is maintained low in this experiment, which shows that the stray light management technology reported later in Section 4 is very successful. Component damage does not appear until the $3\unicode[STIX]{x1D714}$
laser energy reaches 2500 J. Several gray points on the chemical coating of the crystals occurred, which is mainly caused by the surface dust. At the end of this experiment, several filaments occurred in particular area in the wedged focus lens. The diameter of filaments in the bulk is about
$3\unicode[STIX]{x1D714}$
laser energy reaches 2500 J. Several gray points on the chemical coating of the crystals occurred, which is mainly caused by the surface dust. At the end of this experiment, several filaments occurred in particular area in the wedged focus lens. The diameter of filaments in the bulk is about $20~\unicode[STIX]{x03BC}\text{m}$
. There are big craters at the tail of filaments on the rear surface, ranging from
$20~\unicode[STIX]{x03BC}\text{m}$
. There are big craters at the tail of filaments on the rear surface, ranging from $\unicode[STIX]{x1D711}50$
to
$\unicode[STIX]{x1D711}50$
to $300~\unicode[STIX]{x03BC}\text{m}$
. The filament damage is mainly caused by the near-field modulation of the laser beam. The local laser power is much higher than the average power, while most of other positions are safe without damage.
$300~\unicode[STIX]{x03BC}\text{m}$
. The filament damage is mainly caused by the near-field modulation of the laser beam. The local laser power is much higher than the average power, while most of other positions are safe without damage.
3.2 Conversion efficiency
The $3\unicode[STIX]{x1D714}$
conversion efficiency is another important factor of FOA. Measurements of
$3\unicode[STIX]{x1D714}$
conversion efficiency is another important factor of FOA. Measurements of $1\unicode[STIX]{x1D714}$
and
$1\unicode[STIX]{x1D714}$
and $3\unicode[STIX]{x1D714}$
energy and frequency conversion efficiency are shown in Figure 8. Results show that the average conversion efficiency is maintained above 60% in this experiment. The highest conversion efficiency reaches 73.4%.
$3\unicode[STIX]{x1D714}$
energy and frequency conversion efficiency are shown in Figure 8. Results show that the average conversion efficiency is maintained above 60% in this experiment. The highest conversion efficiency reaches 73.4%.
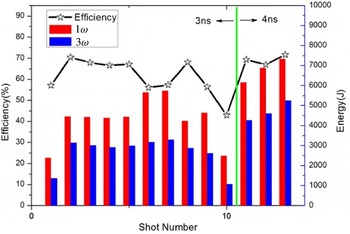
Figure 8. Measurement of $1\unicode[STIX]{x1D714}$
and
$1\unicode[STIX]{x1D714}$
and $3\unicode[STIX]{x1D714}$
energy and frequency conversion efficiency.
$3\unicode[STIX]{x1D714}$
energy and frequency conversion efficiency.
At the same time, the influence of CPP on conversion efficiency is also studied. The efficiency of two shots with CPP is 53.1% and 51.1%. And the efficiency of two shots without CPP is 52.1% and 52.6%. It is obvious that CPP designed for $400~\unicode[STIX]{x03BC}\text{m}$
focal spot has only a small influence on the conversion efficiency. By the way, there are also some other factors affecting the conversion efficiency, such as the
$400~\unicode[STIX]{x03BC}\text{m}$
focal spot has only a small influence on the conversion efficiency. By the way, there are also some other factors affecting the conversion efficiency, such as the $1\unicode[STIX]{x1D714}$
laser beam quality, the surface figure of the crystal, the transmission loss, and the temperature.
$1\unicode[STIX]{x1D714}$
laser beam quality, the surface figure of the crystal, the transmission loss, and the temperature.
3.3 Laser focus performance
The laser focusability is also one of the important indicators of the FOA. The focal length of the wedged focus lens in SG-II Upgrade laser facility is 2.2 m. The lens is optimized to focus 95% of the laser energy within 2.6 DL theoretically. The angular tolerance around the optical axis is $\pm 180~\unicode[STIX]{x03BC}\text{rad}$
. Sometimes physical experiments need larger focal spot shaped with CPP. The designed focal spot with specific CPP is a round spot with radius of
$\pm 180~\unicode[STIX]{x03BC}\text{rad}$
. Sometimes physical experiments need larger focal spot shaped with CPP. The designed focal spot with specific CPP is a round spot with radius of $400~\unicode[STIX]{x03BC}\text{m}$
. The detailed design of CPP is not discussed here to keep the paper concise. It is required by the physical experiments that as much of the laser energy as possible is injected into the laser entrance hole of the hohlraum effectively. If the laser focus spot is too large, the laser entrance hole edge material will be heated to plasma, resulting in the pinhole closure effect. The laser focusability is described by the laser perforation efficiency here. The experimental setup of perforation efficiency testing is shown in Figure 9.
$400~\unicode[STIX]{x03BC}\text{m}$
. The detailed design of CPP is not discussed here to keep the paper concise. It is required by the physical experiments that as much of the laser energy as possible is injected into the laser entrance hole of the hohlraum effectively. If the laser focus spot is too large, the laser entrance hole edge material will be heated to plasma, resulting in the pinhole closure effect. The laser focusability is described by the laser perforation efficiency here. The experimental setup of perforation efficiency testing is shown in Figure 9.
Figure 9. Experimental setup for perforation efficiency testing.
A planar target with $800~\unicode[STIX]{x03BC}\text{m}$
entrance hole is placed at the target site. The choice for
$800~\unicode[STIX]{x03BC}\text{m}$
entrance hole is placed at the target site. The choice for $800~\unicode[STIX]{x03BC}\text{m}$
hole size comes from the entrance hole design of the hohlraum for most physical experiments. The laser is injected into an
$800~\unicode[STIX]{x03BC}\text{m}$
hole size comes from the entrance hole design of the hohlraum for most physical experiments. The laser is injected into an $800~\unicode[STIX]{x03BC}\text{m}$
diameter entrance hole. The planar target is designed large enough to block the
$800~\unicode[STIX]{x03BC}\text{m}$
diameter entrance hole. The planar target is designed large enough to block the $1\unicode[STIX]{x1D714}$
and
$1\unicode[STIX]{x1D714}$
and $2\unicode[STIX]{x1D714}$
lasers. Thus only the
$2\unicode[STIX]{x1D714}$
lasers. Thus only the $3\unicode[STIX]{x1D714}$
laser light could pass through the hole and reach the energy calorimeter. Then we can get the laser perforation efficiency by the ratio of this energy to the energy measured by the BSG. Experimental results are shown in Table 3. Five shots of high energy laser beams are launched to test the perforation efficiency. The first three shots are tested by the main laser spot without CPP. The fourth shot is tested by smoothed laser spot with CPP. The last shot is tested by the main laser with angular deviation of
$3\unicode[STIX]{x1D714}$
laser light could pass through the hole and reach the energy calorimeter. Then we can get the laser perforation efficiency by the ratio of this energy to the energy measured by the BSG. Experimental results are shown in Table 3. Five shots of high energy laser beams are launched to test the perforation efficiency. The first three shots are tested by the main laser spot without CPP. The fourth shot is tested by smoothed laser spot with CPP. The last shot is tested by the main laser with angular deviation of $100~\unicode[STIX]{x03BC}\text{rad}$
to the optical axis of the wedged focus lens. The accuracy of the perforation efficiency measurement is 2%, which is mainly constrained by the BSG energy measurement. We can see that the laser perforation efficiency of all five shots is more than 96%. The performance of the FOA has met our design requirements. Focal spot is mainly influenced by the wavefront of the laser beam. The results also show that our debugging method of the optical elements in Section 4, especially for the wedged focus lens, is very effective, which ensures a good focal spot morphology.
$100~\unicode[STIX]{x03BC}\text{rad}$
to the optical axis of the wedged focus lens. The accuracy of the perforation efficiency measurement is 2%, which is mainly constrained by the BSG energy measurement. We can see that the laser perforation efficiency of all five shots is more than 96%. The performance of the FOA has met our design requirements. Focal spot is mainly influenced by the wavefront of the laser beam. The results also show that our debugging method of the optical elements in Section 4, especially for the wedged focus lens, is very effective, which ensures a good focal spot morphology.
Table 3. Results of the laser perforation efficiency.
4 Key technology
Although the final experiment results mentioned above were satisfactory, some problems inevitably occurred during the process of project development and debugging in order to realize the high focusability and high fluence performance of the FOA. Our team developed two key technologies to solve the problems based on the original physical design and analysis, which were proved to be very effective to improve the overall performance of the FOA.
4.1 Measurement and adjustment technology of the wedged focus lens
The wedged focus lens is a key component in the FOA. The wedge angle measurement affects the focusing performance of high power laser. Once the processing angle or the working gesture of the wedged focus lens deviates from the given one, the PV transmitted wavefront of the wedged focus lens will increase a lot. Then the focal spot will be enlarged. There is not a mature method to measure the wavefront and wedge angle of the wedged focus lens because of its special shape as far as we know. Here we propose a set of measurement and adjustment technology[Reference Shao, Xia, Zhao, Ju and Jiao24] of the wedged focus lens in the FOA.
4.1.1 Measurement of the wedged focus lens in the manufacturing process
The wedged focus lens can be treated as a large aperture flat convex lens. But there is a big angle between the main axis of the wedged focus lens and the optical axis of the input laser beam. Figure 10(a) is the top view of the wedged focus lens in the working path. Point O is the focus point. Line OO’ is a normal of surface S passing through point O. Plane A is the tangent plane of surface S through point O. Then wedge angle $\unicode[STIX]{x1D703}$
is defined as the angle of plane A and plane B. Figure 10(b) is the side view of the wedged focus lens in the working path. The pyramidal error is the angle of plane A and plane D. In the ideal case, the pyramidal error should be zero. But the actual pyramidal error due to the processing or mounting error is not zero. And the pyramidal error can be turned into wedge angle error through the rotation of the wedged focus lens about line OO’. So the final evaluation indices for the wedged focus lens are wedge angle error and transmitted wavefront.
$\unicode[STIX]{x1D703}$
is defined as the angle of plane A and plane B. Figure 10(b) is the side view of the wedged focus lens in the working path. The pyramidal error is the angle of plane A and plane D. In the ideal case, the pyramidal error should be zero. But the actual pyramidal error due to the processing or mounting error is not zero. And the pyramidal error can be turned into wedge angle error through the rotation of the wedged focus lens about line OO’. So the final evaluation indices for the wedged focus lens are wedge angle error and transmitted wavefront.
Figure 10. (a) The top view and (b) the side view of the wedged focus lens.
Figure 11. The angle deviation of the wedged focus lens.
Figure 12. Positioning for wedged focus lens measurement.
In Figure 10(a), plane A is not an existing plane, which cannot be used as the reference plane in the measurement. If an actual existing plane such as plane C is used as the reference to measure the lens, the transmitted wavefront will degrade because of the wedge angle error $\unicode[STIX]{x0394}\unicode[STIX]{x1D703}$
induced by the inevitable error of plane C as shown in Figure 11. The wedge angle error
$\unicode[STIX]{x0394}\unicode[STIX]{x1D703}$
induced by the inevitable error of plane C as shown in Figure 11. The wedge angle error $\unicode[STIX]{x0394}\unicode[STIX]{x1D703}$
is
$\unicode[STIX]{x0394}\unicode[STIX]{x1D703}$
is $75~\unicode[STIX]{x03BC}\text{rad}$
according to normal shape processing. Thus plane C cannot be used as the reference plane. We propose a standard prism with angle error of
$75~\unicode[STIX]{x03BC}\text{rad}$
according to normal shape processing. Thus plane C cannot be used as the reference plane. We propose a standard prism with angle error of $5~\unicode[STIX]{x03BC}\text{rad}$
to be the measuring reference. The angle of the standard prism is the same as the wedge angle of the wedged focus lens. As shown in Figure 12(a), the prism is kept on the six-dimensional adjustment platform K. Make sure the small beam of 4D interferometer auto-collimates on surface
$5~\unicode[STIX]{x03BC}\text{rad}$
to be the measuring reference. The angle of the standard prism is the same as the wedge angle of the wedged focus lens. As shown in Figure 12(a), the prism is kept on the six-dimensional adjustment platform K. Make sure the small beam of 4D interferometer auto-collimates on surface $\text{A}_{\text{L}}$
. The collimator tube auto-collimates the surface
$\text{A}_{\text{L}}$
. The collimator tube auto-collimates the surface $\text{B}_{\text{L}}$
. Then the angle between the axis of 4D interferometer and the collimator is the wedge angle.
$\text{B}_{\text{L}}$
. Then the angle between the axis of 4D interferometer and the collimator is the wedge angle.
After that, replace the prism with the wedged focus lens, as shown in Figure 12(b). Adjust the six-dimensional adjustment platform K to ensure the self-collimation of the small beam of 4D interferometer and the collimator tube. At this time, the wedged focus lens is under the working condition without wedge angle error.
Figure 13. Light path of interference measurement of the wedged focus lens.
Figure 14. Offline installation and adjustment of the wedged focus lens in the FOA.

Figure 15. Optical path of online adjustment of FOA.
Next a focus lens is added to the 4D interferometer. Make sure that the beam from the 4D interferometer focuses at the focal spot of the wedged focus lens as shown in Figure 13. The standard mirror M after the wedged focus lens has to self-collimate the parallel beam. Then the deviation between the measured wavefront and the ideal wavefront of the wedged focus lens is used as an input for further processing.
4.1.2 Offline debugging of FOA
Through processing under the measurement control mentioned in Section 4.1.1, we will get a wedged focus lens, whose transmitted wavefront is best when it works at wedge angle $\unicode[STIX]{x1D703}$
. However if the positioning of the wedged focus lens is deviated during the installation as shown in Figure 11, the working wedge angle is changed, and then the wavefront degenerates. So it is necessary to install the wedged focus lens as shown in Figure 14. First put the standard prism in the mounting device of the wedged focus lens in the FOA. The auto-collimator tube 1 is on the focal spot of the wedged focus lens along the optical axis of the FOA. Adjust the mounting device of the FOA to ensure the collimator tube 1 self-collimates on the surface
$\unicode[STIX]{x1D703}$
. However if the positioning of the wedged focus lens is deviated during the installation as shown in Figure 11, the working wedge angle is changed, and then the wavefront degenerates. So it is necessary to install the wedged focus lens as shown in Figure 14. First put the standard prism in the mounting device of the wedged focus lens in the FOA. The auto-collimator tube 1 is on the focal spot of the wedged focus lens along the optical axis of the FOA. Adjust the mounting device of the FOA to ensure the collimator tube 1 self-collimates on the surface $\text{A}_{\text{L}}$
. Make sure collimator tube 2 self-collimates on the surface
$\text{A}_{\text{L}}$
. Make sure collimator tube 2 self-collimates on the surface $\text{B}_{\text{L}}$
. Then replace the prism with the wedged focus lens as shown in Figure 14(b). Adjust the wedged focus lens to self-collimate the two collimator tubes. At this time, the optical axis of the wedged focus lens coincides with the optical axis of the FOA.
$\text{B}_{\text{L}}$
. Then replace the prism with the wedged focus lens as shown in Figure 14(b). Adjust the wedged focus lens to self-collimate the two collimator tubes. At this time, the optical axis of the wedged focus lens coincides with the optical axis of the FOA.
4.1.3 Online adjustment of the wedged focus lens in the FOA
After offline installation of the FOA, the positioning of the wedged focus lens is consistent with the design scheme. However it may not be the best positioning for working because there is also wavefront deformation induced by other components in the FOA such as frequency conversion crystal, BSG and DDS. So it is necessary to fine adjust the wedged focus lens online to get the optimal transmitted wavefront of the whole FOA.
The online adjusting optical path is shown in Figure 15. After the FOA is installed on the target chamber, a 4D interferometer is kept in the chamber center. The laser beam (632.8 nm) from the 4D interferometer is focused at the target spot by a lens, then passes through the offset lens and the FOA, and finally self-collimates on the standard mirror. The 4D interferometer is used to measure the total transmitted wavefront of the FOA components. The offset lens is used for chromaticism compensation. Fine adjustment of the pitch angle and azimuth angle of the wedged focus lens until the optimal wavefront is realized. Here the micro-distortion of the wedged focus lens is used to compensate the surface wavefront deviation of other elements in the FOA.
This control technology is first carried out in one of the FOAs in the SG-II Upgrade facility. As shown in Figure 16(a), the transmitted wavefront PV of the FOA is $8.38\unicode[STIX]{x03BB}$
before adjustment. There is a high coma aberration in the wavefront, which can induce a tail in the focal spot. After adjustment by this technology, the wavefront PV of the FOA is reduced to
$8.38\unicode[STIX]{x03BB}$
before adjustment. There is a high coma aberration in the wavefront, which can induce a tail in the focal spot. After adjustment by this technology, the wavefront PV of the FOA is reduced to $2.35\unicode[STIX]{x03BB}$
as shown in Figure 16(b). The focusability of the FOA is tested with small energy laser shot. Figure 17(a) shows the focal spot morphology before adjustment. Figure 17(b) shows the focal spot morphology after adjustment. From the comparison, we can see that the online adjustment technology of the wedged focus lens greatly improves the focusability of the FOA in high power laser.
$2.35\unicode[STIX]{x03BB}$
as shown in Figure 16(b). The focusability of the FOA is tested with small energy laser shot. Figure 17(a) shows the focal spot morphology before adjustment. Figure 17(b) shows the focal spot morphology after adjustment. From the comparison, we can see that the online adjustment technology of the wedged focus lens greatly improves the focusability of the FOA in high power laser.
Figure 16. Transmitted wavefront of the FOA (a) before adjustment and (b) after adjustment.
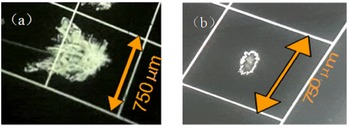
Figure 17. Focal spot morphology (a) before adjustment and (b) after adjustment.
4.2 Stray light management technology based on ground glass
There are six large aperture components in the FOA. Through multiple reflection and focusing of the input laser by the optical surface, there will be the focus of the stray light, i.e., the ghost image. For the high power laser facility, these ghost images irradiating on materials will induce damage to some extent.
Figure 18. Stray light management by ground glass protection in the FOA.
Figure 19. Sketch of the sinusoidal surface of the ground glass.
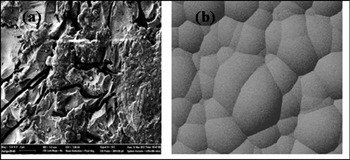
Figure 20. Morphology of the ground glass in the electron microscope (a) before HF etching and (b) after HF etching.
Generally speaking, there are usually two ways to evade the stray light. On one hand, choose the distance and angle of each component to ensure that the ghost image does not fall on the optical element surface or the inside of the FOA. On the other hand, use the stray light trap to protect the mechanical structure surface from the ghost image light. Besides the two ways, we invent a protecting technology to manage the stray light by scattering and absorption based on ground glass[Reference Zhao, Wu, Lin, Zhu and Wang23]. It is used to protect the optical and mechanical surfaces from direct irradiation by the stray light. The protecting device is installed inside the FOA. Stray light management by ground glass protection in the FOA is shown in Figure 18. Its characteristic is that it consists of polygon formed by ground glass and polygon formed by ground glass and neutral absorbing glass.
This protecting device is like an armor of the FOA, which can provide the all-around protection of the FOA from the stray light. Combination of ground glass and neutral absorbing glass is mainly used to protect against the first order stray light, which is above $1.5~\text{J}/\text{cm}^{2}$
. The single ground glass is used to protect against the second order and even higher order stray light, which is below
$1.5~\text{J}/\text{cm}^{2}$
. The single ground glass is used to protect against the second order and even higher order stray light, which is below $1.5~\text{J}/\text{cm}^{2}$
. The ground glass is designed with a sinusoidal surface to reduce the intensity of the stray light as shown in Figure 19. The thickness of the ground glass is 6 mm. The period of the sinusoidal structure is 3 mm and the PV is 0.3 mm.
$1.5~\text{J}/\text{cm}^{2}$
. The ground glass is designed with a sinusoidal surface to reduce the intensity of the stray light as shown in Figure 19. The thickness of the ground glass is 6 mm. The period of the sinusoidal structure is 3 mm and the PV is 0.3 mm.
At the same time, ground glass is hydrofluoric acid (HF) etched assisted by the ultrasonic during the manufacturing processes, which can improve the laser damage resistance of the ground glass. So the ground glass would not be damaged by large amount of stray light irradiation. The morphology of ground glass before and after hydrofluoric acid etching in the electron microscope is shown in Figure 20. We can see that the surface is like a broken stone on the beach before etching. On the contrary, after etching the surface becomes smooth, which should be the fused silica substrate. Online experiments show that stray light management technology based on ground glass protection is very effective to control the indirect damage in the FOA in operation.
5 Discussion
It is a great challenge for us to build the FOA in SG-II Upgrade laser facility under the condition of limited space and short focal length. Through the optimization design, the FOA in the engineering practice has achieved a pretty good performance, which is close to the level in international high power laser facilities such as NIF and LMJ. Physical experiment effect is the touchstone to test the FOA in high power laser facilities. A series of experiments have been carried out in SG-II Upgrade laser facility such as fast ignition and proton imaging, which have already obtained excellent results. This shows that our team has acquired the capability to design and build a high power laser facility with a high level of performance. There is also a high energy petawatt laser beam facility in National Laboratory on High Power Laser and Physics. A lot of innovative physical exploration research can be launched by the SG-II Upgrade laser facility together with the petawatt laser beam.
Nowadays, one of the challenges in the high power laser facility is the UV damage in the FOA. With the increase of the laser fluence, the damage problem is becoming more and more prominent, which seriously influences the costs and performance of the physical experiments. The main problem is that there are many factors related to the damage initiation, such as laser beam quality, surface quality of the component, and working environment. The main work in the future is to determine the laser damage inducement under different laser fluences and then improve the load capacity of the FOA correspondingly. By the way, the higher load capacity of the FOA first needs better $1\unicode[STIX]{x1D714}$
beam quality to support. It puts forward a higher requirement for not only optical component surface quality and cleanliness level but also active control ability of the beam quality. Our facility will be continuously upgraded to meet the growing demands from the physical experiment.
$1\unicode[STIX]{x1D714}$
beam quality to support. It puts forward a higher requirement for not only optical component surface quality and cleanliness level but also active control ability of the beam quality. Our facility will be continuously upgraded to meet the growing demands from the physical experiment.
6 Conclusion
In conclusion, the design and performance of the FOA in SG-II Upgrade laser facility are mainly reported here. The experimental results of FOA show that the design requirements including the laser fluence, frequency conversion efficiency and the perforation efficiency of the focus spot have been achieved, which well meet the needs of physical experiment. In order to ensure the FOA performance, two key technologies are also developed including the detection and adjustment technique of the wedged focus lens and the stray light management technique based on ground glass protection. In the near future, a lot of experimental work will be carried out to improve the load capacity of the FOA. At last, SG-II Upgrade laser facility is open to international users. We are looking forward to more international cooperation to meet new challenges together.


 Open access