


1 Introduction
The share of earned income held by the top 1% of Canadians has doubled since the late 1970s from 8% to 16%. By 2008, top income earners were taking home a bigger share of national income than at any point since the 1940s (see Figure 1). The extent to which this growth in inequality should be of concern to citizens depends on how the concentration of income among a small share of the population affects several dimensions of well-being. The list of potential areas of concern is significant: researchers have explored the connection between income inequality (as separate from poverty) on economic growth, social mobility, crime and social cohesion among other areas (Atkinson, Reference Atkinson2016; Wilkinson and Pickett, Reference Wilkinson and Pickett2009; Stiglitz, Reference Stigliz2012).
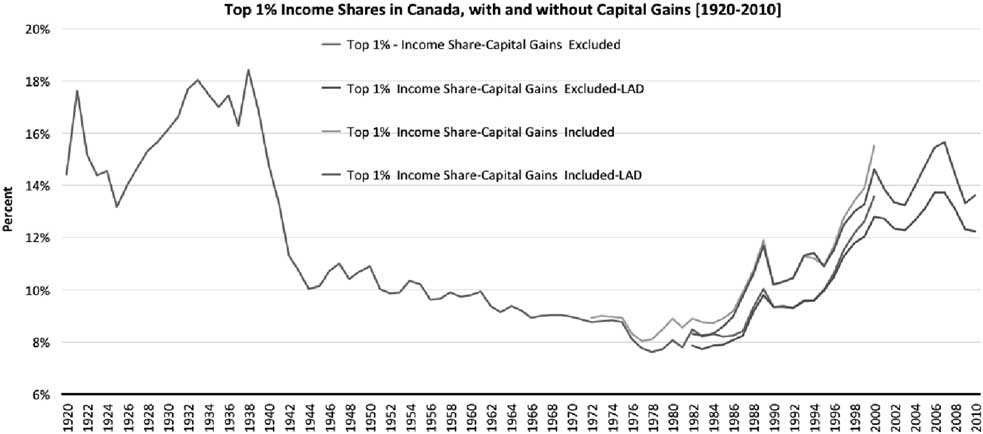
Figure 1 Evolution of income shares held by top income fractilesSource: World Wealth and Income Database.Note: Author’s calculations from World Wealth and Income Database plus Statistics Canada.
One channel through which inequality, and in particular income concentration among the top earners, might harm public institutions is by weakening support for public programs or the financing of public programs for which alternatives or supplements can be found in private markets. Public programs which aim to provide a universal benefit to a heterogeneous population often target (implicitly or explicitly) the ‘median voter’.Footnote 1 That is, they provide a level of benefit that may not reflect the desired benefit level for any single voter or group of voters, but rather aim for a level of benefit that is close enough to what most voters desire such that it acceptable to many. Publicly financed health programs such as Canadian Medicare would be an example of such a benefit – a universal program funded through general tax revenues that aims to provide a level and quality of service that is acceptable to a majority, but that given budgetary realities, must make trade-offs in terms of the quantity and quality of services funded. Publicly financed health care in Canada has historically managed this trade-off reasonably well and continues to receive high (albeit time varying) levels of support by most Canadians.
As the distance between the incomes of the top income earners in Canada and the median income grows, any benefit that targets the preferences of the latter may move further away from the desired level of benefits for the top group. Preferences for the level and quality of health care desired are likely to increase with income. Mechanically, an increase in income and wealth concentration among top earners will then lead to a desired level of health care services that is ever distant from what publicly financed health care provides. This paper aims to explore whether there is evidence of such a relationship based on the changes in concentration of income at the top of the distribution and on the evolution of expenditures on privately financed health care services both across the Organization for Economic Co-operation and Development (OECD) and, in particular, in Canada. It builds on a considerable literature (partially reviewed below) looking at the effects of changes in the income distribution on the provision and financing of public goods, but instead focuses on the effects of changes in the income distribution on the use of private services.
It is worth noting that preferences to use more or higher quality health care do not need to translate into people actually receiving better quality care. Indeed, there is considerable research suggesting that more care is not always better care and can often end up causing harm (Welch, Reference Welch2015). For the purposes of this analysis, it is sufficient that individuals choose to seek private alternatives to publicly financed health care, signaling a departure between their preferences and the care provided by the publicly financed system.
We explore whether there is evidence of such a relationship by looking at the within-country correlation between top income shares and spending on private care and private insurance using panel data from OECD countries over a 35-year period. We then look specifically within Canada at the relationship between changes in income concentration and spending on both private health care and private insurance using household expenditure data. Canada’s public system allows for individuals to insure privately for services not covered under the public system, and has also come under increasing pressure recently to allow individuals to spend privately on otherwise publicly available services. The potential effects of changes in the income distribution could come through either of these two channels.
Our country-level findings suggest that private health expenditure increases with lagged increases in the top 1% share as does spending on private health insurance. We find somewhat weaker evidence of a relationship between lagged top income shares and out-of-pocket health care costs. Within Canada we find evidence of increases over time in the relative spending of top income earners on health care and private health insurance controlling for the direct income-health care spending relationship as well as general changes in private health care spending over time. That is, there is a fanning out of the relationship between private health spending of those in the top income decile relative to the rest of the population over time. Both these findings suggest that there may be reason for concern about the relationship between growing income concentration and the ability of publicly financed health care to provide a universally acceptable benefit. They also suggest that continued growth in income concentration at the top of the distribution may result in a greater demand for private health spending and insurance.
2 Previous literature
Combining existing estimates of the income elasticity of health expenditure with the insights from the literature on inequality and social spending raises questions on the relationship between trends in inequality and the use of privately financed health care.
First, and fuelled by recent trends in developed countries suggesting that aggregate income growth has been paralleled by marked increases in health expenditure (both in levels and as a share of GDP), research has focused on uncovering the income elasticity of health expenditure. Although the range of estimates in household-level and country-level empirical analyses is quite wide, the evidence points towards positive income elasticities (e.g. Acemoglu et al., Reference Acemoglu, Finkelstein and Notowidigdo2013 for the United States and Di Matteo and Di Matteo, Reference Di Matteo and Di Matteo1998 for Canada), some work even presenting health care as a potential superior/luxury good (Hall and Jones, Reference Hall and Jones2007; Li et al., Reference Li, Moslehi and Yew2016).Footnote 2 Such positive income elasticities of health expenditure, especially at the household level, suggest that other factors held constant, inequality coming from income growth concentrated among high income earners may disproportionately raise the demand for health-related goods at the top of the income distribution. The demand for health care at the bottom of the distribution may remain relatively unchanged as inequality rises if middle- and low-income earners’ wages stagnate, and even if they slightly decline (Culyer, Reference Culyer1988).
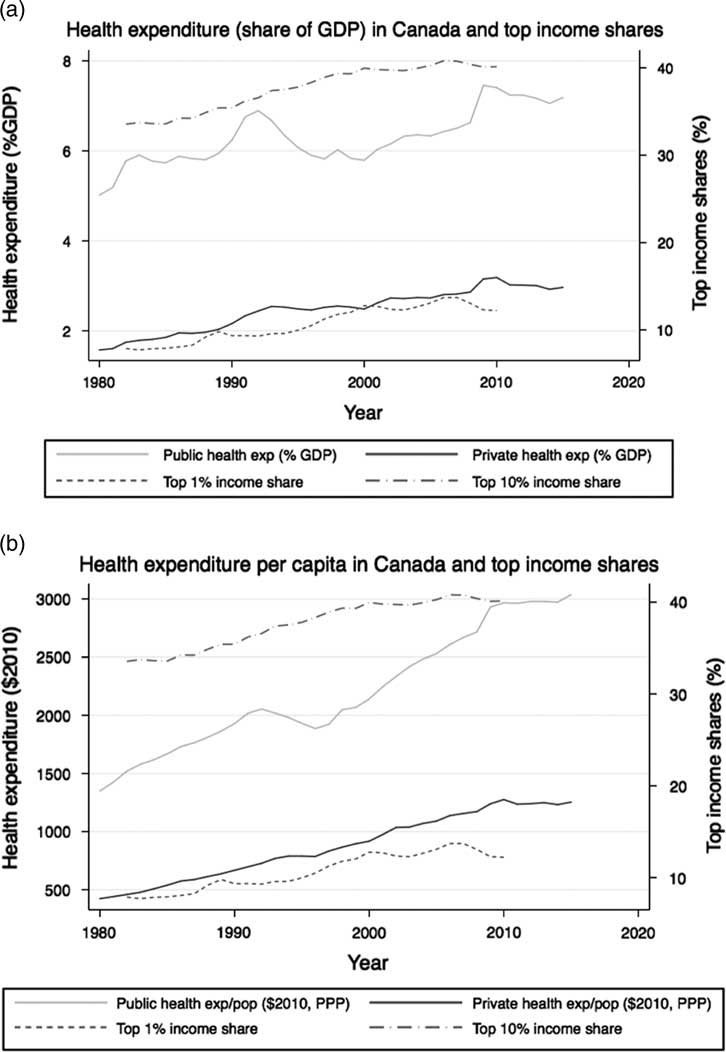
Figure 2 Evolution of health expenditures and top income shares. (a) Health expenditure (share of GDP) in Canada and top income shares. (b) Health expenditure per capita in Canada and top income sharesSource: Health expenditures from OECD, income shares from World Wealth and Income Database.
However, important work on the determination of publicly provided goods and services through democratic processes suggest that the preferences of high income earners may remain unmet by the tax-financed programs receiving enough popular support to be implemented. Indeed, majority voting models have been suggested in which the level and nature of publicly provided goods and services (including health care) and the corresponding tax rate are influenced by the shape of the income distribution. If preferences differ between income levels, theoretical work suggests that (i) a two-tier (Epple and Romano, Reference Epple and Romano1996a; Lülfesmann and Myers, Reference Lülfesmann and Myers2011) or dual-provision health care system (Epple and Romano, Reference Epple and Romano1996b) will likely emerge as a stable policy choice and (ii) the scope of the chosen program or its level of care will meet the preferences of a median voter whose income will be close to (in the case of progressive taxes) or below (in the case of linear taxes) the median income. A common thread in these models is that if health care is a normal (or superior/luxury), the preferences of top income earners will exceed the level of publicly provided care and this, even if the equilibrium reached is stable.
While substantive attention has been given to understand the impact of changes in the income distribution on populations’ choices of tax rates and levels of publicly funded services,Footnote 3 our aim in this paper is different. We do not seek to test how top income earners choose their preferred tax rates or their preferred level of publicly provided health care, but rather whether and how they respond through the use of privately financed care when the public health care system moves further away from their own preferences.
3 Country-level analysis
We first empirically investigate the potential relationship within countries over time between income concentration at the top of the distribution and changes in the role of private finance in health expenditures and health insurance. To do so, we focus on a group of OECD countries which we observe between 1980 to 2015, a period over which the degree of inequality has varied substantially in many developed countries. While such an analysis does not allow for an in-depth investigation of the impact of growing income concentration on households’ demand for health care and private health insurance, it provides an opportunity to uncover broader patterns, which we further unpack by looking at individual spending data in Section 4.
3.1 Data
We use country-level data from the OECD (OECD, 2016), the World Bank (WORLD BANK, 2016) and the World Wealth and Income Database (WID) (Alvaredo et al., 2016). We restrict our analysis to a set of 20 countries for which some consistent and comparable data on income inequality and health care expenditure is available: Australia, Canada, Colombia, Denmark, Finland, France, Germany, Ireland, Italy, Japan, Korea, the Netherlands, New Zealand, Norway, Portugal, Spain, Sweden, Switzerland, the United Kingdom and the United States.Footnote 4 These countries are characterized by substantial heterogeneity in terms of health care systems, including in the structure of their private health insurance markets. While such differences likely affect how changing inequality will influence private health spending, our main empirical analysis focuses on changes in income concentration within countries over time. Nevertheless, we note that the patterns emerging from the analysis conducted in this section represent an average estimated relationship across the systems represented in the sample.
3.1.1 Inequality measures
Our main measure of inequality is the annual income share going to the top 1% income earners in each country from the World Wealth and Income Database. This measure has been at the forefront of the public debate on rising inequality in recent years, as it provides information on inequality at the top of the income distribution. This is a force we hypothesize is driving pressures to increase access to privately financed health care.Footnote 5 Our analysis focuses on a definition of income that excludes capital gains given data availability constraints. However, data from a few countries for which top income shares are available both for income excluding and including capital gains suggests that the trends do not vary substantially across income definitions.
Although top income shares are available for most combinations of countries and years in our sample, there are some gaps in the coverage of our panel of 554 country-year observations. Notably, income shares are available for the United States until 2015, but for most countries the coverage ends between 2010 and 2012, Portugal being the exception with data on top income shares available until 2005 only.
As top income shares do not provide information on inequality within the whole income distribution, we also test the robustness of our results by considering alternative measures of inequality. First, we obtain Gini coefficients from the OECD income distribution database. We focus on the Gini coefficient after taxes and transfers which are systematically lower than market Gini coefficient. Availability for this variable is limited to 238 of the country-year combinations for which information is available on top income shares. This reduced sample includes 19 countries (Gini coefficients are not available for Colombia), over 35 years. The countries for which the most observations are available are the United States (35 observations) and Canada (29 observations), and the countries with the smallest number of observations are Portugal (2) Japan (6) and Australia (6).
We also obtain the ratio of income levels corresponding to the thresholds identifying the 90th and the 50th percentiles in the income distribution, and a similar ratio for the 50th and the 10th percentiles. Those ratios provide a more direct comparison between the levels of income achieved at the top and at the bottom of the distributionFootnote
6
: If $y^{{{\rm 90}}} _{{ct}}$
is the upper bound value of income of the 90th percentile,
$y^{{{\rm 50}}} _{{ct}}$
is the median level of income and
$y^{{{\rm 10}}} _{{ct}}$
is the upper bound value of income of the 10th percentile in the income in country c and year t, they correspond to:
$y^{{{\rm 90}}} _{{ct}}$
is the upper bound value of income of the 90th percentile,
$y^{{{\rm 50}}} _{{ct}}$
is the median level of income and
$y^{{{\rm 10}}} _{{ct}}$
is the upper bound value of income of the 10th percentile in the income in country c and year t, they correspond to:
 $${\rm Inequality}\,{\rm top}_{{ct}} \,{\equals}\,y^{{{\rm 90}}} _{{ct}} /y^{{{\rm 50}}} _{{ct}} .$$
$${\rm Inequality}\,{\rm bottom}_{{ct}} \,{\equals}\,y^{{{\rm 50}}} _{{ct}} /y^{{10}} _{{ct}} .$$
$${\rm Inequality}\,{\rm top}_{{ct}} \,{\equals}\,y^{{{\rm 90}}} _{{ct}} /y^{{{\rm 50}}} _{{ct}} .$$
$${\rm Inequality}\,{\rm bottom}_{{ct}} \,{\equals}\,y^{{{\rm 50}}} _{{ct}} /y^{{10}} _{{ct}} .$$
The ratios are available for 185 country-year pairs for which top income shares are available. Given the availability of other control variables, 143 of these observations are used in the empirical analysis [corresponding to 19 countries between 1982 and 2014, observed between 2 (Portugal) and 19 (Canada) times each].
3.1.2 Privately financed health care
Our measures of health expenditure are taken from the OECD health expenditure and financing data set.Footnote 7 In addition to the total health expenditure (from all sources), we obtain the level of private and public (governmental) health expenditure at the country-year level, as well as the proportion of all health expenditure financed privately. These variables are available for the full set of observations within the sample for which the top 1% income shares are available. We also retrieve the share of the population covered (exclusively or partially) by private health insurance plans from the OECD Social Protection data set.Footnote 8 Finally, we obtain country-level information on out-of-pocket health expenditure (as a share of total health expenditure) from the World Health Organization global health expenditure database.Footnote 9 Coverage for those two last variables is limited to subsamples of country-year observations, as described in Section 3.1.4.
3.1.3 Other controls variables
We obtain information on a series of variables, which likely influence overall patterns on health expenditure, and more importantly on private health expenditure, which we include as control variables. We turn to the demographic and economic reference data from the OECD to obtain, for each observation in our sample, information on population counts, the share of the population aged 65 and older, the civilian employment rate and public health expenditure. We obtain a measure of GDP and the level of total government expenditure per country and year from the World Bank national accounts data, and the OECD national accounts data files. Finally, we retrieve the average income per tax unit from the World Wealth and Income Database.
3.1.4 Summary statistics
We define our main sample as the subset of country-year pairs for which the top 1% income share and the control variables described in the section above are available, corresponding to 453 observations. Although information on total, public and private health expenditure is available for each of these country-year pairs, the subsample for which the share of total health expenditure financed out-of-pocket is available is limited to 265 observations between 1995 and 2014. The number of observations is reduced to 135 (14 countries, excluding Finland, Japan, Italy, the Netherlands, Norway and Sweden) when considering the share of the population with private health insurance.
Table 1 summarizes the descriptive statistics for the main estimating sample. On average, the share of total national income concentrated among the top 1% of income earners is 8.5%, although it varies between a little less than 4% in Sweden in 1981 and more than 18% in the United States in the second half of the 2000s. The share also reaches a little more than 20% in Colombia in 2010. Across countries, the average share of income held by the top 1% increases substantially over the years, from levels around 6% in the early 1980s to highs around 9–10% from the mid-2000s onwards. Although specific shares vary across countries, the upward trend over the past three decades is observed in most countries in the sample. The Gini coefficient generally increases within countries through time, but its distribution is more compressed, with an average of 0.3, a minimum of 0.2 (Sweden 1983 and 1991) and a maximum of 0.4 (United States in 2013 and 2014). On average, the ratio of the upper bound in disposable income of the 50th and the 10th percentile of the income distribution is greater than the same ratio for the upper bound in disposable income of the 90th to the 50th percentile, respectively, of 2.10 and 1.90, but the evolution of these ratios through time varies across countries. Inequality at the top of the distribution is on average lowest in Denmark, Norway, Finland and Sweden, while it is higher in New Zealand, the United Kingdom and the United States. At the bottom of the distribution, lower levels of inequality in the sample are found in Sweden and the Netherlands, while higher levels are found in the United States.
Table 1 Summary statistics, cross-country analysis

GDP=gross domestic product.
Note: All income and expenditure variables are expressed in U.S. dollars of 2010.
On average, 27% of all health expenditure is privately financed. In countries for which information on out-of-pocket expenditure is available, it represents on average 18% of health expenditure. Private health insurance coverage rates average 37% across our sample, however, the share of the population with at least partial private health insurance coverage is highly variable across countries in our sample, from as little as 0.80% of the population in Denmark in 2001 to 91.6% of the population in France in 2006.Footnote 10 Although coverage rates vary through time within countries, stark differences are in general observed across countries not within them.
Important differences exist within and across countries for some other variables presented in Table 1 and are likely to influence private health expenditure, such as the employment rate, total government expenditure, gross domestic product and average income per tax unit. Noticeable upward trends in the share of the population aged 65 or more, a segment of the population more likely to be heavy users of health care although more likely to be covered by public health insurance plans in many countries, also potentially plays an important role. All these variables will be accounted for in our main empirical analysis.
3.2 Results
We empirically investigate the relationship between the income share accruing to the top 1% of the income distribution and each of our measures of the role of private finance in health care with the following specification:
 $${\rm Ln}\,Private_{{ct}} \,{\equals}\,\alpha {\plus}\beta \,{\rm Ln}\,Inequality_{{c,{\rm }t{\minus}k}} {\plus}\gamma \,{\rm Ln}\,Public_{{ct}} {\plus}X'_{{ct}} \partial {\plus}\phi _{c} {\plus}\mu _{t} {\plus}{\varepsilon}_{{ct}} ,$$
where Ln Private ct corresponds to the natural logarithm of the level of private expenditure in country c and year t and Ln Public ct is the natural logarithm for public health expenditure, so equation (1) corresponds to the logged version of a regression in which the dependent variable would be the ratio of private to public health expenditures. The main independent variable, Ln Inequality, is the share of income held by the top 1% and X′ ct is a vector of the natural logarithm of the controls variables enumerated in Section 3.1. A full set of year fixed effects, µ t , controls for shocks that might simultaneously affect all countries in the sample. Finally, we include country fixed effects, ϕ c , to control for unobserved time-invariant features of country health care systems that are likely to have an impact on the prevalence of private health care financing. Given the addition of these fixed effects, our estimate for β can be interpreted as the within-country relationship between changes in inequality and changes in private health care expenditure. We finally allow our inequality measure to enter with a zero-to-two-year lag over the full sample period. The results from this specification are summarized in Table 2. The coefficients reported in the first column of Table 2 income share suggests a positive and statistically significant correlation (0.778) with the contemporaneous income share of the top 1% income earners. This positive and statistically significant elasticity persists as we turn to one- and two-year lagged values of the top 1% income share, although the magnitude of the coefficient decreases with the lags, to 0.65 and 0.61, respectively, suggesting private health expenditure could react relatively quickly to changes in the level of inequality. As expected, private health expenditure is negatively associated with the share of the population aged 65 and older, potentially driven by the fact that public health coverage is often more generous for people in that age range. The association between private health expenditure and the average income per tax unit is also positive, as is the association with national GDP. The association between the natural logarithms of private and public expenditure is negative, and statistically significant, which is consistent with the crowd-out effects found in Flood et al. (Reference Flood, Stabile and Tuohy2004).
Table 2 Ln income share of top 1% on Ln private health expenditure

GDP=gross domestic product.
Notes: Robust standard errors in parantheses. Income shares from the World Wealth and Income Database (Alvaredo et al., 2016). GDP, government expenditure, private and public health expenditures, population and employment rate from the OECD (OECD, 2016). All values in U.S. dollars of 2010. Unbalanced panel, data available from 1982 to 2015.
***p<0.01, **p<0.05, *p<0.1.
We slightly alter the specification described above and replace the control for the natural logarithm of public health expenditure with the natural logarithm of total health expenditure, to effectively estimate the logarithmic version of a regression of our measure of inequality on the private share of total health expenditure (not shown). Overall, we obtain coefficients on the top 1% income share varying between 0.26 and 0.54. Similar patterns as those described in Table 2, including smaller coefficients on the inequality variable as we move towards longer lags, can be observed.
Individuals (and therefore countries) can increase private expenditure on health care in a variety of ways including: (i) an increase in the scope or ‘quality’ of the voluntary health insurance schemes purchased by individuals already covered by some form of private insurance; (ii) an increase in the share of the population buying private health insurance coverage (purchased individually, or provided through an employer-sponsored plan); or (iii) an increase in the total amount spent out-of-pocket for health care services and medication. Tables 3 and 4 present results that speak to the last two of these channels. The estimates suggest that the uptake in private health insurance in the population is likely the main driver behind the positive association between inequality and private health care spending.
Table 3 Ln income share of top 1% on Ln population with private health insurance
GDP=gross domestic product.
Notes: Robust standard errors in parantheses. Income shares from the World Wealth and Income Database (Alvaredo et al., 2016). GDP, government expenditure, private health insurance, population and employment rate from the OECD (OECD, 2016). All values in U.S. dollars of 2010. Unbalanced panel, data available from 1995 to 2015.
***p<0.01, **p<0.05, *p<0.1.
Table 4 Ln income share of top 1% on Ln out-of-pocket health expenditure
GDP=gross domestic product.
Notes: Robust standard errors in parantheses. Income shares from the World Wealth and Income Database (Alvaredo et al., 2016). GDP, government expenditure, private health expenditure, population and employment rate from the OECD (OECD, 2016). Out-of-pocket health expenditure from the World Bank (WORLD BANK, 2016). All values in U.S. dollars of 2010. Unbalanced panel, data available from 1995 to 2014.
***p<0.01, **p<0.05, *p<0.1.
Table 3 presents the results when we estimate a version of equation (1) in which Ln Private ct represents the natural logarithm of the population covered by private health insurance, which corresponds to estimating the logged version of a regression of the private health insurance coverage in the population on the income share of the top 1%.Footnote 11 We estimate a positive and statistically significant relationship (0.86) between the top 1% income and the share of the population covered by some form of private health insurance. These results are consistent when controlling for the log of public health expenditure or for the log of total health expenditure. Re-estimating the same model separately for country-year pairs with a private insurance coverage below and above 32.5% (the median coverage rate) suggests that this estimated impact mostly comes from contexts where baseline private coverage is low. We also note that, in our sample, the income share of individuals between the 90th and the 99th percentile of the income distribution has increased as the income share of the top 1% was also increasing. Our result might therefore capture the fact that as individuals at the top of the income distribution (described more broadly than solely the top 1%) get relatively richer, their preferences for faster access to care, improved quality of care (either through the quality of the care itself, or through a more extensive set of amenities in health care establishments), also leads them to opt in private health insurance schemes. Substituting the natural logarithm of the top 1% income share by that of the top 5% and top 10% income share in a similar specification, we indeed estimate a positive relationship between inequality at the top of the income distribution and private health insurance coverage.
Table 4 summarizes the results obtained when the dependent variable in equation (1) is defined as the natural logarithm of out-of-pocket health expenditure (controlling for the natural logarithm of public health expenditure). We estimate a weaker relationship, suggesting that the growth in privately financed health expenditure observed as inequality increases is likely due to an increase in private insurance premiums, rather than in co-payments or in out-of-pocket payments for services that are not covered by public or private plans.
Appendix Tables A1–A4 (online Supplementary material) suggest that our results are generally robust to measuring inequality using Gini coefficients in lieu of top income shares. However, statistically significant associations are harder to capture using disposable income ratios to consider separately the distance between the median and, respectively, the top and the bottom of the income distribution.
Our cross-country estimates are suggestive of a relationship between top income shares and private health spending, particularly through the purchase of private insurance. However, this finding could reflect a variety of underlying mechanisms. To try and understand the extent to which the concentration of income at the top end of the distribution is driving this relationship we turn to a micro-data analysis of health care spending by Canadian households.
4 Within-country analysis: the Canadian case
The Canadian context offers an interesting environment in which to explore the hypothesis that increasing income concentration (as distinct from absolute income) may increase the use of private health care services. Figure 2 presents the evolution of aggregate health expenditure and inequality as measured by top income share since the 1980s. While most physician and hospital services are covered by universal public insurance, Medicare exists alongside a private market for many health professionals’ services, prescription drugs, long-term care, dental care as well as some physician services.
4.1 Data
We obtain information on income and spending on health-related goods and services at the household level from the public use micro-data files of the Survey of Household Spending (SHS), an annual survey conducted and administered by Statistics Canada (Income Statistics Division – Statistics Canada, 2009). The SHS collects information on Canadians spending patterns, with the exclusion of those who are institutionalized (including those living in nursing homes), who live in military camps or who live on Indian reserves. Our main estimating sample is composed of thirteen cross-sectional waves of the survey, covering the period spanning from 1997 to 2009.Footnote 12 In addition to providing detailed information on households’ sources of income before and after taxes and transfers, the SHS provides a granular overview of their annual expenditures on various categories of goods and services, including but not limited to shelter, clothing, transportation and – most importantly for the purposes of this analysis – health care. In each wave of the survey, information on expenditure and income was collected through interviews and recall bias was addressed with procedures including the verification of respondents’ answers using households’ receipts. All expenditures and income values are transformed in constant 2002 dollars using the all-items consumer price index published by Statistics Canada.Footnote 13
4.1.1 Household income and income fractiles
We focus on total income at the household level, consisting of earnings, as well as income from investment and other sources, including transfers but before taxes. To assign a position in the income distribution to each household in the sample, we first use the survey weights to generate a distribution of household income for each year in our data, and identify the annual income thresholds corresponding to each percentile. To ensure that this procedure generates thresholds that are representative to the true distributions, we create similar thresholds for individuals (instead of households) in the SHS, and compare them with the thresholds derived from individual Canadian tax filers data in the Longitudinal Administrative Database.Footnote 14 The threshold values for the top 10% of income earners and for the median income earner are quite similar across sources. The SHS estimates of income thresholds for the top 1% are, however, less precisely estimated and our empirical approach, therefore, will mostly focus on the spending patterns of households in the top 10%. We allocate all other households to one of the three following income fractiles: 51st to 90th percentiles, 21st to 50th percentiles and the bottom 20 percentiles.
4.1.2 Household health care expenditures
We consider two broad measures of overall household health care expenditure. First, total health care expenditure corresponds to the sum of 11 categories capturing various dimensions of health care spending by households: hospital and other residential facilities, physician care, other health care professional services, other health care and medical services, prescription drugs, other medicinal or pharmaceutical products, private health insurance, public hospital or medical or drug plans, health care supplies, eye care and dental care. A detailed description of the items covered by each category is given in Table A5 in the online Appendix. Second, direct health care costs to the household corresponds to expenditures from total health care costs, from which private health insurance and public hospital or medical or drug plans are subtracted. In Section 4.2, we look more closely at four individual categories of expenditures: prescription drugs, private insurance, hospital and other residential facilities and physician care. Looking separately at these categories helps understand if private health spending is focused on accessing care that replaces or complements the features of the Canadian universal health system.
4.1.3 Household characteristics
We obtain a series of socio-demographic information from the SHS to control for household-specific characteristics in our empirical analysis. In addition to household size, we use information of the number of individuals aged 65 and above, the number of children, the age of the youngest child (0–5 years old and 6–18 years old), the marital status of the main respondent, as well as the household’s total annual expenditure, from which we can derive a measure of annual non-health expenditure.
4.1.4 Summary statistics
Our main estimating sample is composed of all observations coming from the 10 Canadian provinces between 1997 and 2009, excluding those for which information on household composition is missing. We further exclude all households reporting a negative total income (from earnings, investment, other sources and transfers, before taxes) or a negative amount for total annual expenditures (excluding taxes, non-health insurance payments and contributions, and gifts). Our final sample consists of 186,577 households. Summary statistics for our sample are shown in Table 5. Average annual household spending is $337.28 on private health insurance, $250.97 on prescription drugs and $293.57 on dental care. Consistent with the nature of the Canadian health care system and with the provision of the Canada Health Act, average expenditures on physician care and hospitals are low, at respectively, $18.22 and $18.06 per year.Footnote 15
Table 5 Summary statistics, survey of household spending, Canada

Table 6 takes a closer look at characteristics and health expenditure patterns for households in different income fractiles. High and low income households in our sample are significantly different. Households in the bottom 20% are more likely to be composed of only one individual, and are on average less than half the size of households in the top 10%, who are more than four times more likely to have a married respondent. Households with an income below the median are also more likely to include at least one individual aged 65 or more, and are less likely to include children. There is a substantial difference in the average income between households in the bottom 20%, at $14,279, and those in the top 10%, $180,233. Total expenditures also increase through the income distribution, although the gradient is less pronounced than the increase in income between the bottom, middle and top fractiles.
Table 6 Summary statistics by income fractile, survey of household spending, Canada

pctile=percentile.
As expected, health expenditure increases as one moves from low- to high-income households. The bottom panel of Table 6 suggests that the health expenditure-income gradient would become more pronounced at the top of the income distribution; for example, households in the top 1% spend nearly 1.5 times what household located between the 90th and the 99th percentiles spend on health-related goods and services than households.Footnote 16 A similar pattern is observed for almost all health expenditure categories, with the exception of prescription drugs. Households in the bottom 20% of the income distribution spend less on prescription drugs, which could be explained both by constrained financial resources and possible eligibility for public drug plans for low income families. Out-of-pocket expenditure on prescription drugs is higher for the rest of households in the bottom half of the income distribution, but mostly decreases for households in the upper half income distribution.
4.2 Results
Our main empirical specification is given by equation (2), in which Health expenditure ipt corresponds to the expenditure of household i residing in province p observed in year t. Income Fractile ipt consists of a series of three dummies indicating the household’s position in the income distribution, either between the 21st and the 50th percentiles, between the 51st and the 90th percentiles, or in the top 10% (the omitted category being the bottom 20% of the distribution). Other control variables included in X ipt are total household income,Footnote 17 the number of adults aged 65 and above within the household, the presence of children in the household, the total number of individuals within the household and the marital status of the main respondent to the SHS. We also include a vector of province fixed effects, ϕ p to account for the fact that, beyond the main principles set in the Canada Health Act, provinces can decide on the nature and scope of additional publicly provided health coverage, and have jurisdiction on the organization of the health care system. Consequently, prescription drugs for some population groups or services offered by certain health professionals, for example, vary across jurisdictions within the country. In this context, the inclusion of province fixed effects allows us to perform a within-province analysis. Finally, µ t represents a vector of year fixed effects, capturing shocks common to households in all provinces, which might affect patterns in health care expenditure.
 $$Health\,Expenditure_{{ipt}} \,{\equals}\,\alpha {\plus}Income\,Fractile'_{{ipt}} \beta {\plus}X'_{{ipt}} \partial {\plus}\phi _{p} {\plus}{\rm }\mu _{t} {\plus}{\varepsilon}_{{ct}} .$$
Our estimates should be interpreted with caution given that household income may be endogenous and a function of health status. The SHS does not document health conditions and we do not address this endogeneity directly. Therefore, we do not interpret our estimates as causal, but rather seek to understand how patterns of health care spending vary across the distribution of household incomes, and what these patterns may imply for the role of private and public financing of the Canadian health care system moving forward.
Results from estimating equation (2) are displayed in Table 7. Looking first at total health expenditure, the results presented in column 1 suggest that compared with the bottom 20% of households, those higher up in the distribution spend significantly more on health care. The coefficients associated with the income fractiles confirm a positive gradient, even when controlling for households’ level of income. Being in the top 10% of the income distribution is associated, all else equal, with an increase of $1235 in total health expenditure compared with the bottom 20% households, which corresponds to a little more than 60% of a standard deviation. Having an income between the 50th and the 90th percentiles is associated with an increase of a little less than $800 compared to the bottom 20% of households. The coefficients on the other variables also have the expected sign. The presence of a senior in the household, total income and household size are all positively associated with total health expenditures. Column 2 of Table 7 presents similar results for direct health care costs to households; although the coefficients on the income fractile dummies are smaller, they exhibit a similar pattern, suggesting that the findings from column 1 are not exclusively driven by the purchase of private health insurance by higher income households, but also relate to out-of-pocket spending. However, the results from column 4 provide some strong evidence that being in the top 10% of the income distribution is associated with an annual increase of $460 on private health insurance premiums compared with the bottom 20% income (63% of a standard deviation), nearly a threefold increase compared with the impact of moving from the bottom 20% to the next income fractile.
Table 7 Household position within the income distribution (fractiles) on health expenditure
pctile=percentile.
Notes: Robust standard errors in parantheses. All income and expenditure variables are expressed in dollars of 2002. All regressions are estimated using sampling weights. Data from the Survey of Household Spending, excluding observations from the territories.
***p<0.01, **p<0.05, *p<0.1.
We note that the relationship we are capturing with respect to private health insurance is driven by premiums paid by individuals, either through plans purchased individually, or through employees’ contributions to employer-sponsored plans.Footnote 18 However, it is quite unlikely that the difference we observe in coefficients associated with the top 10% and the other households in the top half of the income distribution is driven by differential access to employer-sponsored private insurance plans, given that a vast majority of households in these two groups are employed full-time. Moreover, our results are robust to restricting the estimating sample to full-time employees or to controlling for the household’s main source of income (employment, investment, government transfers or others), or for full-time working status of the main respondent. The gradient presented in column 4 of Table 7 is therefore likely to be mostly driven by, for example, top income households purchasing more comprehensive options within the range of plans offered by their employers (in the case of flexible plans) or supplementing these plans with individually purchased ones. We also note that a price effect might contribute to this estimated relationship; tax exemptions for private health insurance represent a more important price incentive for high income earners whose marginal tax rates are likely higher, and have been shown to influence individuals’ decision to spend on employer-sponsored health insurance plans (Stabile, Reference Stabile2001).
Column 3 of Table 7 looks at expenditure on prescription drugs. While moving from the bottom 20% of the income distribution to the group formed of the 21st to the 50th percentiles is associated with an annual increase of $55 on prescribed medication, the increase is much smaller for households between the 51st and the 90th percentile. As noted above, this likely reflects better drug insurance coverage among these groups. We re-estimate equation (2) using logs and find similar results.
Households’ health care needs will vary as they age. For example, spending on residential care is likely to increase with age as might the relationship between income and spending on these types of services. To investigate whether our results differ significantly by age, we define a subsample formed exclusively of households whose head is aged 65 or older, and we estimate all specifications presented in Table 7.Footnote 19 Most of the patterns described for the full sample are also observed for this older group of households, and are often amplified. For example, the coefficient on the top decile of the income distribution is twice as large as the one estimated in the main sample when looking at physician expenditure, and movements towards top fractiles are also associated with substantially larger increases in direct health care spending in the older sample. Interestingly, the relationship estimated with private health insurance is quite similar in both samples, and although the coefficients on all income fractiles are larger when considering the older sample, we still do not observe a gradient between expenditure on charges from hospital and residential care facilities and the position in the income distribution. This result is not necessarily intuitive; however, at least two factors may explain our results. First, we note that the survey population excludes people living in residences for dependent seniors. Second, we do observe a very strong relationship between the position in the income distribution and expenditure on services provided by non-physician health professionals, including nurses and other professionals offering part-time or full-time home care assistance, a potential substitute for nursing homes. Finally, the results for prescription drug expenditure are quite different in the older sample; the coefficients associated with all income fractiles are relatively similar with values close to $80, and we cannot reject that they are statistically equal to each other.
While providing insights on the relationship between households’ relative economic situation and their health expenditures, the results from Table 7 do not allow us to investigate the evolution of such an association as the concentration of income in the top fractiles increased. To address this question, we first look at unadjusted trends by mapping the evolution of health expenditures (in total and by category) for each income fractile between 1997 and 2009. For most outcomes, an increase in the gap between the amounts spent by households in the top 10% income and those in lower fractiles can be observed, especially for direct health care costs to households (Figure 3) and on expenditures going towards private health insurance plans (Figure 4).Footnote 20
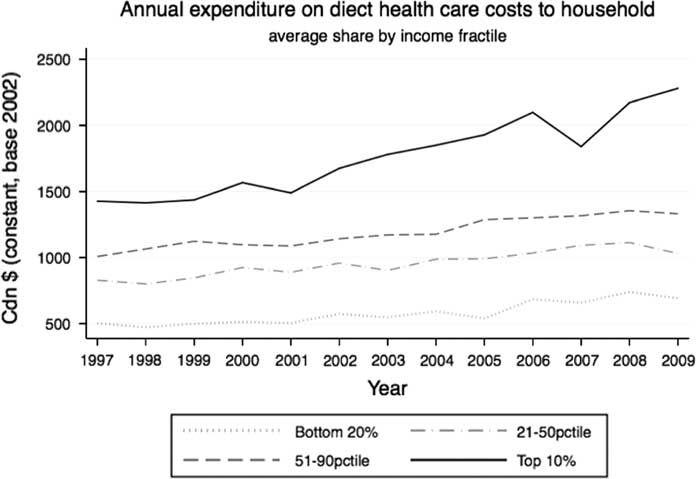
Figure 3 Evolution of average direct health care costs, by income fractileNote: All income and expenditure at the household level, weighted data from the SHS public-use microdata files. Average expenditure excluding the territories.
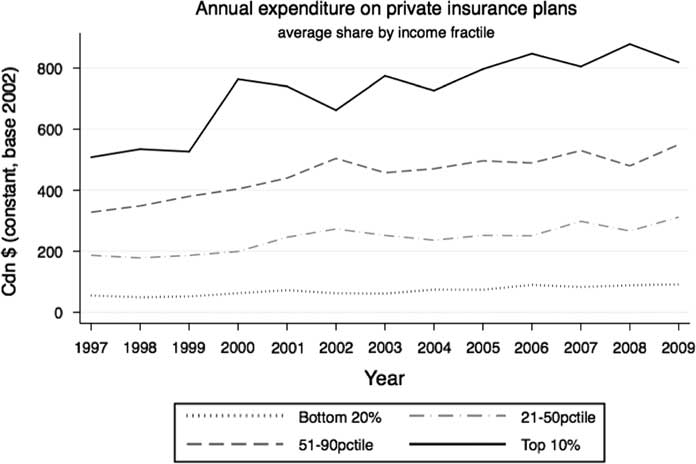
Figure 4 Evolution of average expenditure on private health insurance plans, by income fractileNote: All income and expenditure at the household level, weighted data from the SHS public-use microdata files. Average expenditure excluding the territories.
We again turn to a regression framework to study the evolution of the expenditure gap between households in the top 10% of the income distribution and those in lower income fractiles using the specification corresponding to equation (3). The estimating equation builds on equation (2) by adding a series of interactions between year effects and dummy variables indicating if a household is in the top 10%, between the 50th and the 90th percentiles or in the bottom 20%.
 $$\eqalignno{&Health\,Expenditure_{{ipt}} \,{\equals}\, \alpha {\plus}Income\,Fractile'_{{ipt}} \,\beta {\plus} \left( {Income\,Fractile_{{ipt}} \,{\ast}\, \mu '_{t} } \right)\pi \cr \quad \quad \quad \quad \quad \quad \quad \quad \quad \quad {\plus}X'_{{ipt}} \partial {\plus}\phi _{p} {\plus}\mu _{t} {\plus}{\varepsilon}_{{ct}} .$$
The results presented in Table 8 confirm such dynamics for total and direct health expenditure. For those outcomes, the coefficient on the top 10% fractile remain positiveFootnote 21 and the coefficients on its interaction with the year effects are generally increasing, and mostly statistically significant from 2003 onwards. We note that the increase in the coefficient on the interaction term in 2003 coincides with an increase in the average household income of the top 10% relative to the bottom 90% (see Figure 5). Although the pattern is less salient, the interaction terms estimated when considering expenditure on private health insurance premiums are consistent with our hypothesis of greater reliance on private health insurance and care among the top income earners as the gap between this group and the rest of the population increases. We note that for these three categories of expenditure, the interaction terms between year effects and the 50–90th percentile (not presented in the table for ease of exposition) are also mostly positive, but much smaller in magnitude, mostly neither statistically significant nor monotonically increasing.
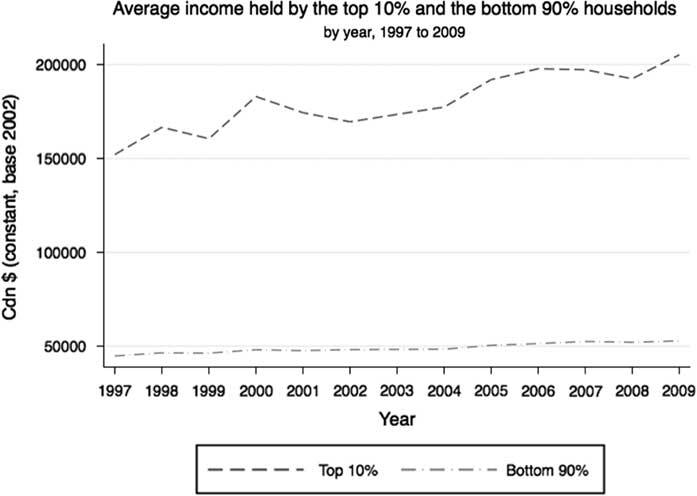
Figure 5 Evolution of household income for top 10% and bottom 90% households, by yearSource: Data from the SHS public-use microdata files, averages excluding the territories.
Table 8 Household fractiles on health expenditure, with interactions between year effects

pctile=percentile.
Notes: Robust standard errors in parantheses. All income and expenditure variables are expressed in dollars of 2002. All regressions are estimated using sampling weights. Data from the Survey of Household Spending, excluding observations from the territories.
***p<0.01, **p<0.05, *p<0.1.
When considering expenditures on hospitals and physician care (columns 5 and 6), the inclusion of interaction terms slightly decreases the size of the coefficients on the income fractiles, which also mostly lose their statistical significance. The same is true of the interaction terms between income fractile and year. Turning to prescription drug expenditure (column 3), most interaction terms are negative, but do not follow a clear pattern are they generally statistically insignificant. However, the interaction terms between year effects and the dummy variable for the bottom 20% (not reported), are negative, decreasing and are often statistically significant, suggesting a widening gap in prescription drugs expenditure between the bottom 20% and the next income fractile during the sample period. One possible explanation for such dynamics could be the transitions towards income-based catastrophic coverage associated with important cost-sharing provisions that took place across Canadian provinces between 2000 and 2010, as highlighted by Daw and Morgan (Reference Daw and Morgan2012). The impacts of such a transition might have been concentrated at the bottom half of the income distribution if individuals with higher incomes are more likely to have contributed to private insurance plans offering prescription drugs coverage, and for which co-pay rates would not have followed a similar trend. Simultaneously, households on social assistance, mostly located in the bottom 20% of the income distribution, were less likely to be affected by the change, and to remain on public plans with first dollar coverage or co-payments.
5 Implications for the future of private insurance in Canada
Both our cross-country and Canada specific analyses above suggests that rising inequality at the top end of the income distribution may be contributing to the demand for private health services among the highest income earners. Our Canadian estimates, in particular, suggest that, other things equal, increasing inequality caused by top incomes growing faster than average incomes increased private demand for health services and insurance more than would be the case if the same average income growth were distributed equally throughout the population.
What are the implications of such a shift? It should not be surprising that in such an environment, private insurance will increasingly aim to cater to the preferences of those with higher incomes. So far Canada has managed this within a framework where private insurance and out-of-pocket spending finance complementary services rather than duplicating services already covered by the public system. However, if growing income inequality does indeed translate into greater discontent with the publicly financed offering from top income earners, we might expect increasing pressure for private financing to fund supplemental coverage for the services covered under the public system, as it does in numerous other jurisdictions. Experience from these other jurisdictions suggest that areas most likely to be targeted for private financing are those where there are longer backlogs for care (diagnostic services, for example), where there is mixed evidence of immediate medical necessity, and where it is easy to perform lower risk procedures (hip and knee replacements). Each of these forces has the potential to undermine the public system and increase publicly financed costs (Stabile and Townsend, 2014). Challenges to the existing regulation around private insurance in Canada over the past two decades, a period in which income concentration at the top end of the distribution has grown, is consistent with this hypothesis.
Policy makers might therefore wish to consider the broader implications of growing income inequality, including its effects on publicly financed services such as health care. If governments wish to preserve existing boundaries between publicly and privately financed care, policies that address the underlying causes of the growing demand for private care should be considered in addition to those that seek to shore up the public system and defend against legal action seeking to secure a greater role for privately financed care.
Supplementary Material
To view supplementary material for this article, please visit https://doi.org/10.1017/S1744133117000457


 Open access