


Just under a decade ago, Paul Gronke wrote that growth in early voting had taken place ‘with little fanfare and, until the last few years, not much critical examination’ (Gronke Reference Gronke and Streb2012: 134). Neither part of Gronke's statement holds today. Early voting has become central to narratives of electoral campaign success and failure in the United States and elsewhere and research has been conducted on the causes of early voting (Finseraas and Vernby Reference Finseraas and Vernby2014; Fullmer Reference Fullmer2015). Scholars have considered its normative implications for democratic accountability and civic responsibility (Thompson Reference Thompson2004). While election-day voting at a polling place is still the dominant mode of voting in most democracies, reports that one-third or more of electors have cast their votes before election day – either in person or remotely – are now commonplace. Nonetheless, much still remains unknown about the causes and consequences of voting before the official election day.
We explore the predictors of early voting. The academic literature on determinants of early voting has mainly relied on sociodemographic and, to a lesser extent, institutional explanations, sometimes examining these in combination (Gronke and Toffey Reference Gronke and Toffey2008; Stein and Garcia-Monet Reference Stein and Garcia-Monet1997). Political elements affecting early voting have usually been overlooked or, at best, used as control variables (Fullmer Reference Fullmer2015). Hence, our first contribution is to examine theoretically and empirically assess the impact of political factors on early voting, together with socioeconomic and institutional factors. In doing so, we advance a framework in which voters' costs and competition between candidates are critical for early voting. Our results show that institutional factors (the density of polling places), political factors (the level of competition between parties in electoral districts) and socioeconomic factors (age) contribute to variations in early versus election-day voting. Lower density of polling places, weaker local competition between parties and younger voters are associated with reduced election-day voting and increased early voting. Levels of early voting are affected not simply by the characteristics of individual citizens but also by the institutional and political contexts within which those citizens vote. Our approach is more complete than previous research.
Our second contribution is to study early voting in a compulsory voting system. In voluntary voting systems, early voting is normally introduced in an attempt to increase turnout (Herrnson et al. Reference Herrnson, Hanmer and Koh2019). Accordingly, studies have focused on whether and why the introduction of early voting affects turnout by reducing abstention. The evidence is far from conclusive (for conflicting US results, see Arceneaux et al. Reference Arceneaux, Kousser and Mullin2012; Berinsky Reference Berinsky2005; Burden et al. Reference Burden, Canon, Mayer and Moynihan2014, Reference Burden, Canon, Mayer and Moynihan2017; Stein and Garcia-Monet Reference Stein and Garcia-Monet1997). In voluntary voting settings, voters with weak or no preferences between candidates can always abstain from voting. Analysis in such systems must address three options – election-day voting, early voting and abstention. Analysing early voting in a context that removes the abstention option focuses attention directly on explaining a voter's choice between election-day voting and early voting, without having to take account of additional factors that lead citizens to stay away from the polls altogether.
Australia's highly effective system of compulsory registration and voting removes the abstention option found in voluntary voting systems: the intensity of voters' preferences is not relevant because voters have no ‘exit’ option. Therefore, Australia is an excellent case for examining the drivers of early voting, since comparisons of early voting and election-day voting can be done without considering abstention and turnout levels. Countries with voluntary voting, in contrast, force us to study the choice between election-day voting, early voting and abstention.
Our third contribution is empirical: we combine two levels of data in our analysis. Previous studies have relied on either individual or aggregate data and usually data drawn from just one election. Although such studies are fruitful, a more comprehensive understanding of early voting is achieved by using both aggregate- and individual-level data. Our aggregate-level analysis combines district-level data drawn from the Australian Electoral Commission for six national elections covering the 2004 to 2019 period, matched with three census data waves of the Australian Bureau of Statistics. The individual-level analysis combines data from the two most recent waves of Australian Election Studies (2016 and 2019). This unique temporal perspective allows us to explore whether the variations in early voting that occurred when it was a relatively unusual mode of voting have persisted or changed as early voting has become a more mainstream activity.
In the next section of this article, we present our theoretical framework and hypotheses. We then explain the Australian case, the data and the variables used in the analysis, before presenting our results. Finally, we discuss key implications of our findings for voters, electoral management bodies and political parties.
Theoretical framework
Our theoretical approach focuses on costs and competitiveness. ‘Direct’ or ‘immediate’ costs of voting to citizens are ‘time, requirements, or effort needed to vote’ (Burden et al. Reference Burden, Canon, Mayer and Moynihan2017: 565) and exclude information costs and the indirect costs to other political actors and to society more generally (Burden et al. Reference Burden, Canon, Mayer and Moynihan2014). This resonates with the resource perspective fundamental to the study of political participation developed by Sidney Verba et al. (Reference Verba, Schlozman and Brady1995). We propose that direct costs condition the type of vote that is cast.
The institutional conditions of voting impose direct costs on voters. For example, the number and placement of polling places will mean that citizens have to travel lesser or greater distances to polling places and spend more or less time queueing to vote. If election-day voting is made relatively expensive for voters through provision of limited polling places that are overcrowded and poorly run, early voting will be more attractive than if there are plentiful, quiet and efficiently run polling places.
The second element is the competitiveness of an election. In a closely fought election contest, it makes sense for voters to wait until election day to vote, since their choice is more likely to be important to the outcome. Rationally, they should vote with the fullest information about the contending candidates. Where the election contest is so lopsided that the likely winners can be predicted well before election day, in compulsory voting systems it makes sense for citizens to get their duty over with before election day.
Both the costs of voting and the competitiveness of elections will affect voters differently. The provision of well-resourced and plentiful polling places will make it easier for young, healthy citizens to vote but may make no appreciable difference to older citizens with very restricted mobility. Similarly, the prospect of making a difference in a closely fought election will be more attractive to politically interested citizens than to uninterested citizens.
Thus, we theorize that early voting versus polling-day voting will be affected by institutional, political and demographic factors. This tripartite approach is well established in the study of other aspects of electoral participation, such as turnout (Powell Reference Powell1986). The approach can be fruitfully applied to analyse early voting. Individuals do not make their voting decisions in isolation: institutional, political and demographic factors will all affect the methods by which they vote.
Institutional factor: cost
In an enforced compulsory voting setting, there is an implicit contract between government and citizens. Since government has made electoral participation compulsory, it has an obligation to allow citizens reasonable access to the ballot (McAllister and Muller Reference McAllister and Muller2018: 105; Newman Reference Newman2004: 2). Recently, achieving this expectation has been incorporated into the organizational performance measures of the Australian Electoral Commission (AEC), Australia's electoral management body (AEC 2021a).
Robert Stein and Greg Vonnahme's (Reference Stein and Vonnahme2008) openness principle – the possibility of a citizen voting at any polling place in their region, rather than being restricted to a single polling place – is a way of meeting this expectation. In contrast to many countries, Australian elections enshrine the openness principle, with voters able to vote at any polling place throughout their electoral division on polling day, or to cast their vote at any polling place within their state, or at some polling places in other states (AEC 2021b). Most Australians who vote in person do so, however, at polling places in their own electoral districts. Studies of electoral turnout in several countries have shown that the number and positioning of local polling places are important factors affecting whether and how citizens cast a ballot (Haspel and Knotts Reference Haspel and Gibbs Knotts2005). In Kenya, Andrew Harris (Reference Harris2021) finds turnout is 2.4% lower in areas with more congested polling places. In the US, Henry Brady and John McNulty (Reference Brady and McNulty2011) show that changes ‘in polling places and increased distances to polling places change turnout behaviour due to increased inconvenience’ (Reference Brady and McNulty2011: 126). In Australia, where polling place congestion will not generally affect turnout because of compulsory voting, citizens could use early voting to avoid the prospect of a lengthy wait to vote on polling day. Other things being equal, voter anticipation of a quick vote at one of many local polling places on election day is likely to reduce early voting, while the anticipation of a lengthy wait at one crowded polling place will increase it.
Hypothesis 1a: A higher number of polling places in an electoral district will be positively associated with polling-day votes and negatively associated with early voting.
The number of polling places in an electoral district may not, however, be the most important factor in access to polling-day voting. Stein and Vonnahme (Reference Stein and Vonnahme2008) capture this in their centralization principle: that citizens can access voting sites close to their residences, workplaces or leisure areas. As noted above, the AEC attempts to make voting accessible. Australian federal electoral districts vary widely in geographic size and population density. For example, the district of Grayndler was just 32 square kilometres in 2019, while Lingiari was 1,348,158 square kilometres, bigger than Peru or Chad. Providing the same number of polling places in these districts would result in very different levels of convenience and cost for voters. However, offering voters enough polling places in Lingiari to ensure the same access as the voters of Grayndler would be prohibitively expensive. Instead, pre-poll and postal voting are offered to Australian voters who live more than 8 kilometres from a polling place. We propose that the level of polling-place density in an electoral district will have a significant effect on when citizens vote.
Hypothesis 1b: A higher density of polling places in an electoral district will be positively associated with polling-day votes and negatively associated with early voting.
Political factor: competition
Political considerations for parties and voters will have an impact on early voting. Parties will try harder to mobilize some early votes than others, while voters with different political orientations will take different views of the costs and benefits of polling-day versus early voting. In majoritarian parliamentary systems with single-member electoral districts, such as the system used to elect the Members of the Australian House of Representatives, the contest in each electoral district is what matters for winning government. This makes the competitiveness of an electoral district a key factor in early voting, for parties and voters alike.Footnote 1
Parties conserve their limited resources by paying minimal or no attention to ‘safe’ districts that they expect either themselves or their opponents to hold comfortably. Instead, parties target the highly competitive districts that might swing either way. This logic also conditions party efforts to mobilize early voters. To get votes ‘in the bank’ in competitive seats, parties are likely to try to mobilize supporters early, so they can concentrate on undecided voters later. Parties may also encourage citizens who are leaning their way to vote early, rather than risking those voters switching sides later. Parties have adopted these strategies in the US (Gimpel et al. Reference Gimpel, Dyck and Shaw2006), the United Kingdom (Townsley and Turnbull-Dugarte Reference Townsley and Turnbull-Dugarte2020) and Australia (Mills Reference Mills2019). In safe districts, any late switchers away from the party are less likely to affect who wins the seat. If parties campaign successfully in this way, we would expect to see more early voting mobilized in competitive electoral districts and less in safe districts.
For voters, district competitiveness will have a different logic. In a district in which the same party normally wins by significant margins, citizens will generally know who will be elected, but compulsory voting still requires them to vote. Casting an early vote becomes an attractive option. Their votes are unlikely to affect the result and they can get their duty out of the way. By the same token, we expect less early voting and more polling-day voting in competitive districts. While parties will want to bank early votes in these districts, it makes sense for voters to wait until polling day to vote, so they have the fullest information (Meredith and Malhotra Reference Meredith and Malhotra2011; Thompson Reference Thompson2004). This logic may apply more strongly to certain subgroups of electors in competitive districts; for example, those who have not already decided who to vote for before the early voting period commences.Footnote 2
Hypothesis 2: More competitive electoral districts will be positively associated with early voting and negatively associated with polling-day voting.
Demographic factor: age
Age is the demographic factor which has been most consistently associated with early voting in international research (Gronke and Toffey Reference Gronke and Toffey2008). Previous Australian studies indicate that older people are more likely to use postal and pre-poll voting (McAllister and Muller Reference McAllister and Muller2018; Rojas and Muller Reference Rojas and Muller2014: 4–5). Graeme Orr (Reference Orr2019: 195) plausibly suggests that since younger people are more mobile, they will be more likely to pre-poll vote. Angelo Rojas and Damon Muller suggest this pattern holds for pre-poll voters voting outside their electoral districts but that older people make greater use than younger people of local pre-poll opportunities (Reference Rojas and Muller2014: 4). Since we combine all pre-poll voting into one variable and most pre-poll votes are now ordinary pre-poll votes, we predict that age will be positively associated with both postal and pre-poll voting.
Hypothesis 3: Age will be positively associated with early voting.
Case, data and variables
Case: the Australian context
In the new Commonwealth of Australia, voting at a polling place on election day was the default option. However, postal voting was introduced for eligible voters at the second federal election in 1902 and has been available for eligible voters at all federal elections since 1918 (Aitkin and Morgan Reference Aitkin and Morgan1971). Voters typically have a four-to-five-week period to apply for and return postal ballots.
In-person early voting, called pre-poll voting in Australia, was introduced for federal elections in 1990. Until the 2010 federal election, voters who attended an early voting centre to cast a pre-poll vote had to complete the same declarations as postal voters and place their votes within envelopes for later verification and processing. From 2010, this requirement was dropped for voters casting a pre-poll vote within their electoral districts. This simplification of the process for casting most pre-poll votes coincided with the start of a rapid increase in pre-poll voting (see Figure 1 left panel). Pre-poll voting takes place for two to three weeks before polling day (AEC 2019).
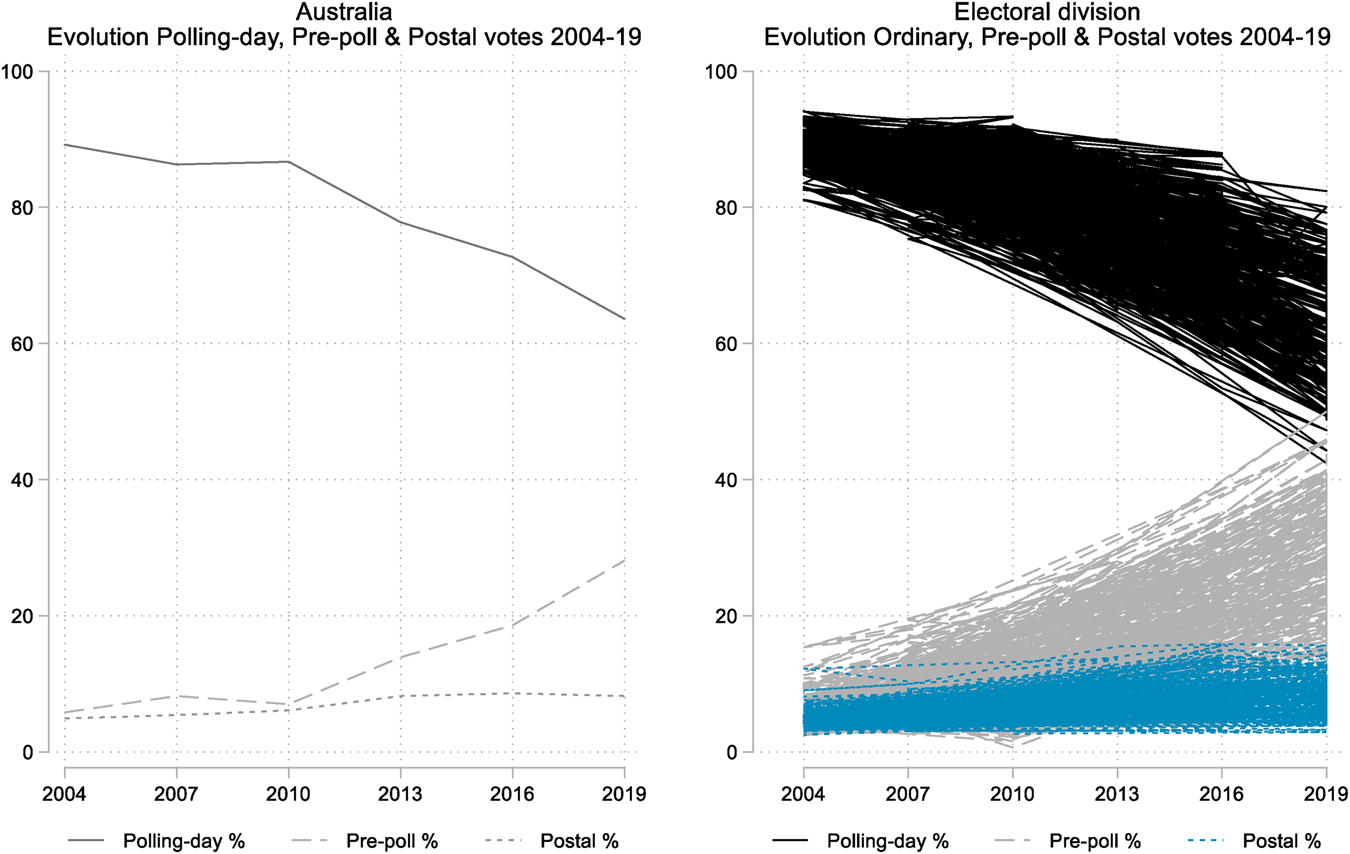
Figure 1. Australia's and Australian Electoral Districts Evolution of In-Person Polling-Day, Pre-Poll and Postal Voting, 2004–2019
Formal access to postal and pre-poll voting has always been restricted in Australian federal elections. Schedule 2 of the Commonwealth Electoral Act 1918 specifies the same eligibility criteria for both types of early voting. These include distance from a polling place, travel, health issues, caring responsibilities, safety, imprisonment, religious restrictions and occupational obligations. Voters who are unable to attend polling places for these reasons can apply to be placed on a ‘general postal voter’ list and automatically receive a postal ballot at every federal election (Commonwealth Electoral Act 1918: ss 184A–186). Reforms to the Act (ss 200DG–200DI) meant that voters still had to have a prescribed reason for requiring a pre-poll vote but no longer had to declare that reason to electoral officials. From the 1998 federal election, suggestions grew that voters were increasingly casting pre-poll votes ‘as a matter of convenience rather than for the grounds specified’ in the Act (Newman Reference Newman2004: 9). While early voting is a matter of access to the ballot for some Australian voters, such as the sick and elderly, for many others, the choice between in-person voting on polling day, pre-poll voting and postal voting is increasingly one of convenience (Maley Reference Maley2018: 19; Orr Reference Orr2019: 195; Rojas and Muller Reference Rojas and Muller2014: 6; Sheppard and Beauregard Reference Sheppard and Beauregard2018).
Data
The advantages of using both aggregate- and individual-level analysis are well known. Focusing only on aggregate data may result in the ecological fallacy. If researchers focus solely on individual data, however, they ignore the important institutional and political factors at the electoral district level that we have outlined above. Combining both approaches provides a more complete analysis.
We rely on three data sources. At the aggregate level, the dependent and institutional independent variables come from the AEC. The aggregate dataset is composed of six federal elections (2004, 2007, 2010, 2013, 2016 and 2019) with 150 electoral districts per election.Footnote 3 For each federal election, we gathered AEC data on the numbers of pre-poll, postal and in-person polling-day votes in each electoral district. Due to legislative changes, the AEC recorded pre-poll votes differently in two periods, from 2004 to 2007 and from 2010 onwards.
The second aggregate-level dataset consists of socioeconomic variables from the Australian Bureau of Statistics (ABS). The ABS collects census data every five years, with the collection points of 2006, 2011 and 2016 falling into our time period. For each district, we have linearly interpolated the values for the relevant election years. Linear interpolation cannot capture short-term shocks, but it is fair to assume that major demographic shifts occur over much more than a year or two.
The individual analysis variables come from the 2016 and 2019 Australian Election Study (AES), a series of surveys since 1987 timed to coincide with federal elections. Only the 2016 and 2019 surveys included questions on the type of voting used by respondents as well as their electoral district (McAllister et al. Reference McAllister, Makkai, Bean and Gibson2017, Reference McAllister, Bean, Gibson, Makkai, Sheppard and Cameron2019).
Dependent variables
Table 1 shows the distribution of the three dependent variables for the six elections. In-person polling-day vote has substantially declined: starting above 89% in 2004 it has declined over 25 percentage points. Postal voting increased by three percentage points between 2004 and 2013 but then plateaued. Pre-poll votes have multiplied more than four times over 15 years (see also Figure 1).
Table 1. Evolution of In-Person Polling-Day, Pre-Poll and Postal Voting in Australian Electoral Districts, 2004–2019 (in percentages)
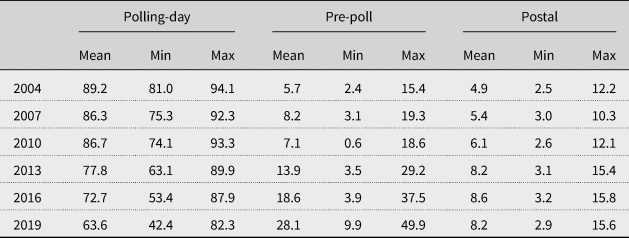
Table 1 also suggests that the trend to early voting has occurred across all electoral divisions. The maximum polling-day vote in any division in 2019 (82.3%) sits just above the minimum polling-day vote in any division in 2004 (81.0%). The right panel of Figure 1 visualizes the evolution of the polling-day vote, pre-poll and postal votes for each of the 150 Australian electoral divisions, showing the differences between the electoral districts within the general trends identified in Table 1.
At the individual level, the AES asked how respondents had voted. In 2016, 69% of respondents reported casting an in-person polling-day vote, with 21% voting in person but early and 10% using a postal ballot, accurately reflecting the balance of polling-day and early voting (McAllister and Muller Reference McAllister and Muller2018: 106). In the 2019 AES, 53% declared they had voted in person on election day, 34% had voted in person before election day, with 12% using postal voting, over-reporting both pre-poll and postal voting.
Independent variables
We present the independent variables grouped according to the different explanations outlined above.
Institutional factors
We gathered AEC data on the number of polling places for each election in each electoral district, ranging from 23 in Holt in 2004 to 172 in Maranoa in 2010. The number of polling places varied both between electoral districts at any election and within electoral districts between elections. We calculated polling place density by dividing the number of polling places in a division by the districts size in square kilometres. Density varies significantly between electoral divisions. The lowest density is for Lingiari, which ranges between 0.000017 and 0.000052 polling places per square kilometres over the period covered. At the other extreme, Grayndler had between 1.48 and 2.18 polling places per square kilometre. We include these variables in both the aggregate and the individual models.
Political factors: aggregate
The competitiveness measure in each electoral district is the difference in the two-party preferred vote (measured between Labor and the Liberal–National coalition) in the district at the previous election.Footnote 4 This ranges from just 0.16% to 45.0%. For ease of interpretation, we have inverted the variable so that higher values show higher levels of competitiveness. We include this variable in the aggregate and the individual models.
We also use the Liberal–National Party coalition's two-party preferred vote in each district to test for any advantage the coalition might possess in mobilizing early votes, and particularly postal votes. This variable ranges from a minimum of 24% (division of Batman 2007) to 74% (Murray 2004).
Political factors: individual
At the individual level, the political orientations of voters may also affect early voting. Research on the relationships between political orientations and forms of voting has so far proved inconclusive. We identify three well-known political orientations – political interest, partisanship and political efficacy – as possibilities from the early voting literature and use them as controls in the individual-level analysis presented below (McAllister and Muller Reference McAllister and Muller2018; Stein and Garcia-Monet Reference Stein and Garcia-Monet1997). The campaign interest measure is a dichotomous variable on whether the respondent watched the electoral debate. The second and third variables are measures of partisan commitment. These are strength of party identification (ranging from no party identification to very strong identification) and whether or not the respondent thought about supporting a different party during the campaign. The political efficacy proxy asks how much difference a respondent thinks voting makes (ranging from 1 to 5). A final measure included concerns potential mobilization: it asks whether respondents were contacted by candidates during the campaign.
Socioeconomic factors
Our main socioeconomic variable of interest is age. At the aggregate level, we use ABS census data on the age profiles of districts and define the age of each district by the proportion of people aged 65 and over. This roughly equates to the Australian retirement age and the age from which more people are likely to start finding it difficult to attend polling places on election day. At the individual level, we use the age of the respondent recorded in the AES surveys.
Drawing on comparative research, we introduce four other demographic variables – education, employment, race and income – as controls in our models (Gronke and Toffey Reference Gronke and Toffey2008; McAllister and Muller Reference McAllister and Muller2018; Rojas and Muller Reference Rojas and Muller2014; Sheppard and Beauregard Reference Sheppard and Beauregard2018). We use census data on the percentage of people with a tertiary qualification in each electoral district. This was calculated by dividing the number of people with such a qualification in an electoral division by the number of people aged 20 years and over who normally reside in that electoral division. We use census data on the percentage of those working full-time in each electoral district. The ABS allows census respondents not to state a response or to state that the question does not apply. We have recalculated the percentages to exclude such responses from the total.Footnote 5 For the individual-level analysis, this variable is a dichotomized response on whether the respondent works full-time or not. The control for race is the Aboriginal and Torres Strait Islander (ATSI) population in each electoral district. We use its logarithmic form, as it originally takes the form of a bimodal distribution. We do not include the individual-level ATSI variable, as less than 1% of the respondents in the AES surveys identified as ATSI. Finally, we include a set of demographic controls at the individual level: gender, home ownership (both dichotomous), place of residence (categories range from a village to a major city) and a continuous measure of income.
Correlations among variables at the aggregate level reach a maximum of 0.7, between tertiary education and polling density and age. At the individual level, correlation peaks at 0.57, between age and owning a house. The Supplementary Material provides a detailed account of each variable.
Since the dependent variables at the aggregate level are continuous, we rely on ordinary least square regression, clustering the errors at the division level and including year fixed effects. The dependent variable at the individual level is nominal with three categories – election-day, pre-poll and postal voting. Accordingly, we rely on multinomial logistic regression, following Ian McAllister and Damon Muller (Reference McAllister and Muller2018), but we cluster errors at the division level. It could be argued that the data are hierarchical (individuals nested in electoral divisions, states and territories and years). However, the standard requirement for multilevel models are at least 20 groups and 30 observations per group (Heck and Thomas Reference Heck and Thomas2000). Many of the electoral divisions in the AES sample do not reach such figures – observations range from a minimum of 2 (McNamara) and 4 (McMillan) to a maximum of 66 (Canberra and Grayndler). Furthermore, when estimating the intraclass correlation (ICC), it is below 0.025.Footnote 6
Results
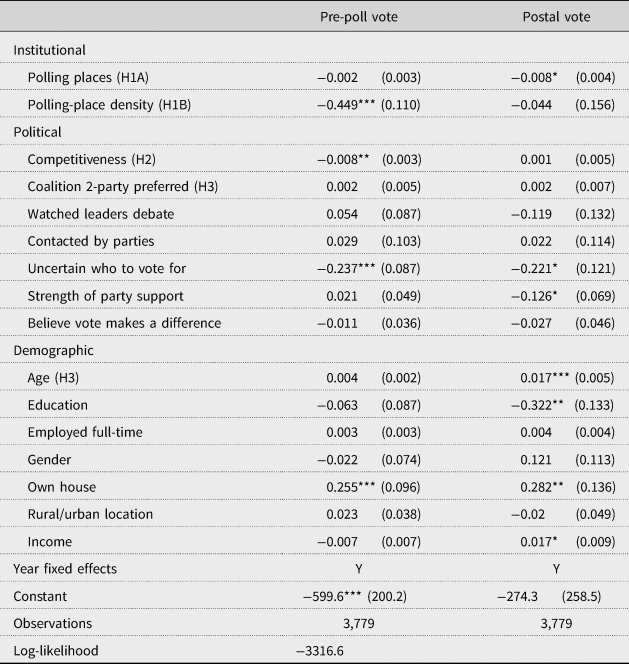
Table 2 presents the results for the aggregate analysis of 863 electoral divisions for the 2004–2019 period.Footnote 7 The third column presents the results for election-day voting while the fourth and fifth display the results for pre-poll and postal voting, respectively. The models show a quite high explained variance, over 0.7 for ordinary and early voting and 0.48 for postal voting.
Table 2. Institutional, Political and Socioeconomic Variables and Voting Type, Aggregate Analysis
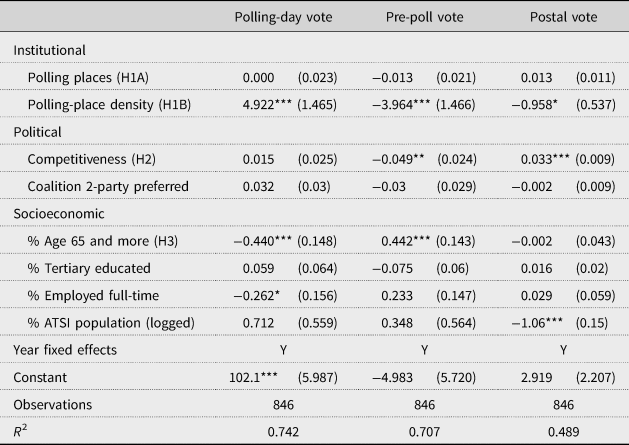
Notes: *** p < 0.01, ** p < 0.05, * p < 0.10.
From an institutional perspective, we have argued that the number of polling places could affect the type of vote that is cast (H1A), but, more importantly, their density will do so (H1B). The non-significant results of the number of polling places on the type of votes cast is aligned with our two arguments. The density of the polling places shows a significant and positive relation with the percentage of polling-day votes.Footnote 8 For every point that the density of polling places increases, the percentage of polling-day votes increases by five points.Footnote 9 In contrast, the same variable shows a significant and negative association with pre-poll voting and a negative, though not significant, relationship with postal voting. Hence, as the density of polling places changes so does the configuration of the types of votes cast.
When discussing H2, we noted that the competitiveness of electoral districts presented competing logics for parties and voters. In more competitive districts we should observe a higher proportion of early voting as parties try to get votes ‘in the bank’. However, early voting should be reduced as voters wait for all the possible information before making their decisions.
Our results support the voter perspective, at least for pre-poll voting. The competitiveness variable coefficient in column 3 is positive: more competitive electoral divisions show higher rates of election-day voting, although the relationship is not significant. The negative coefficient for pre-poll voting matches the expectation that less competitive divisions will show significantly higher proportions of pre-poll voting. For each percentage point in the margin of victory, the proportion of pre-poll voting increases by almost half a point. The coefficient for postal voting shows a positive and significant sign. This might suggest that parties are successful at harvesting more postal votes in competitive districts but cannot transfer this strategy to pre-poll votes. The contrasting coefficients indicate that separating different early voting formats as different dependent variables is important. We do not find any association between the strength of coalition voting and pre-poll or postal voting.
Age is related to the type of vote cast, according to H3. Older districts in our study do display lower proportions of polling-day voting and higher percentages of early voting. The logged percentage of ATSI population is negatively and significantly related with postal voting. In districts with a higher proportion of full-time workers, polling-day voting is less popular, although this relation is weak and it is not reinforced by positive correlations with either pre-polling or postal voting. Finally, tertiary education has no relationship with the type of vote cast.
In order to assess whether the results were influenced by any specific election year or state, we have re-estimated the analyses, excluding each of the six elections (robustness check 1 available in the Supplementary Material) and each of the states (robustness check 2), both showing similar results. We have also included other variables, such as income, that are highly correlated with education and the results remain the same.Footnote 10
Overall, the aggregate analysis finds that the density of polling places (H1B), the competitiveness of the electoral division (H2) and its proportion of elderly people (H3) relate to the type of vote cast. Furthermore, it suggests further conclusions. First, pre-poll and postal voting have different drivers. Second, the results for pre-poll voting seem to be the reverse of those for ordinary voting. When a variable displays a positive and significant coefficient over ordinary voting, it is negative for early voting. Postal voting, however, does not seem to follow any pattern related to ordinary and pre-poll voting.
We now move to the results for the individual-level analysis (Table 3). The institutional variables for the number of polling places and their density are in line with H1A and H1B. As the number of polling places increases, the log odds of casting a pre-poll or a postal vote decline compared with ordinary voting. Furthermore, and completely aligned with the results of the aggregate analysis and H2, as the density of the polling places increases, the odds of pre-poll voting decline significantly. The relationship with postal voting is negative but not significant.
Table 3. Institutional, Political and Socioeconomic Variables and Voting Type, Individual Analysis
Note: *** p < 0.01, ** p < 0.05, * p < 0.10.
Regarding the political variables, the negative coefficient for district competitiveness suggests that individuals in less competitive divisions have a higher disposition to use pre-poll voting compared with election-day voting. This is consistent with the aggregate-level findings for H2. The variable is not significant for postal voting. In districts where the coalition enjoys a higher vote, postal and pre-poll voting increase but not significantly. Among the other control political variables we included, those uncertain about which party or candidate to support are significantly less likely to opt for a postal or pre-poll vote compared with voting on election day, which follows our expectations. The results regarding partisan strength are unclear. Stronger party supporters show a positive sign for pre-poll voting versus election-day voting, although the coefficient is not significant. By contrast, stronger party supporters are less likely to rely on postal voting. The proxies for political interest, political efficacy and being contacted by a party during the campaign show no significant relationships with the dependent variables.
We noted earlier the possibility that voters would delay voting in competitive settings only if they were uncertain about who to vote for. To assess this possibility, we interacted the competitiveness variable with voters' uncertainty about who to vote for. The interaction shows limited support for this interpretation. The coefficients are positive but far from conventional significance levels for pre-polling and only at the 10% level for postal voting (see the table in the Supplementary Material).
At the demographic level, age (H3) is correlated with increased postal voting compared to ordinary voting but shows no correlation with pre-polling. If older voters cannot easily access a polling place, they are equally unlikely to be able to access a pre-poll voting centre and instead will rely on postal voting. Higher-educated voters rely less on pre-polling and postal voting than on ordinary voting. House owners tend to rely more on pre-polling and postal voting versus polling-day voting, while those with higher incomes also rely more on postal voting than ordinary voting. Gender, employment status and rural or urban residential location do not affect the type of vote cast.
Multinomial logistic models present coefficients in log-odds units forms. Marginal effects can help in the interpretation of the results, as they offer an approximation to the amount of change in the dependent variable that is produced by a one-unit change in one of the independent variables. In order to make results more tangible, we have estimated the marginal effects of changes in the independent variables of interest on the three methods of voting, keeping the rest of the variables constant.
Figure 2 conveys the patterns for each independent variable under examination. It shows that as the number of polling places increases, so does the probability that individuals will rely on polling-day votes rather than pre-poll votes. Postal voting does not seem to be affected. Polling-place density tells a similar story, as it negatively affects the likelihood of individuals relying on pre-poll voting. Clearly, the higher the density of polling places, the lower the use of pre-poll votes. As electoral district competitiveness increases, individuals are less likely to rely on pre-poll voting in relation to ordinary voting, while the same variable does not seem to affect postal voting in the same way. Finally, age shows that while the probability of an 18-year-old casting a postal vote is 6%, it rises to 15% among 78-year-olds.
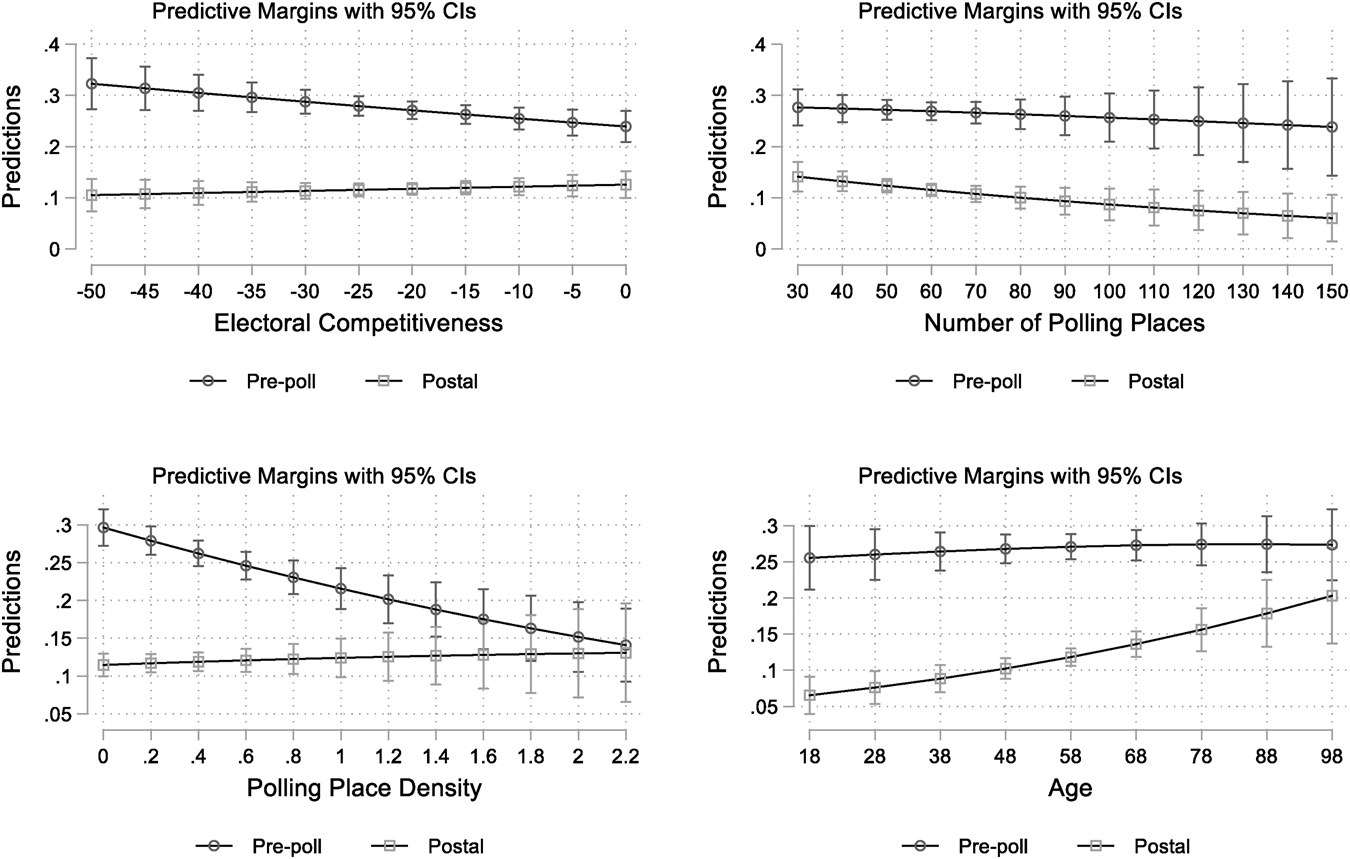
Figure 2. Marginal Effects of Independent Variables of Interest on Pre-Poll and Postal Voting
Summarizing the results of the individual analysis, the number of polling places (H1A), their density (H1B), district competitiveness (H2) and age (H3) relate to the type of vote cast. These results align with those from the aggregate analysis.
Discussion and conclusion
In this article we have addressed the determinants of early voting in a unique way. First, by providing a theoretical framework that focuses on costs and competitiveness, we have demonstrated the value of combining political, institutional and socioeconomic explanations for early voting. Our integrated perspective provides a more complete picture of early voting correlates than the literature currently offers. Second, the focus on Australia, with its enforced compulsory voting, is fruitful. By removing turnout, we focus our attention directly on the alternatives of election-day voting and early voting. Third, our aggregate dataset covering six federal elections from 2004 to 2019, complemented with individual-level AES survey data for the two most recent elections, shows the value of combining aggregate- and individual-level analysis.
The results seem to support all three hypotheses. Increased provision of polling places was associated with decreased early voting in both the aggregate- and individual-level data. The level of electoral competition between parties also appeared to relate to early voting. With pre-poll voting, this relation indicated that some voters were taking charge of the timing of their votes by waiting until polling day to vote in tight electoral district contests and voting earlier where the outcome looked assured. The results for postal voting were more consistent with a scenario in which parties were able to get postal votes ‘in the bank’ in more competitive seats. Finally, we found evidence that increased age reduced polling-day voting and increased pre-poll voting (Table 2) or postal voting (Table 3).
Our findings have implications for major stakeholders in elections, including voters. They suggest that crucial drivers of early voting are mainly out of the hands of individual voters and instead in the broader institutional and political contexts in which those voters find themselves. Individual voters have no control over the provision of polling places, or the level of competitiveness of their districts. Nonetheless, many citizens seem to be informed about the institutional and political conditions in their districts to use early voting provisions to their advantage, either by voting early to reduce the costs of voting where polling places are sparsely provided, or by voting early where the electoral campaign seems irrelevant to the outcome in their seats. By the same token, where the outcome is uncertain, more voters delay their judgements until polling day.
Older voters seem less likely to wait for polling day to vote. The aggregate- and individual-level data are slightly inconsistent regarding which forms of early voting they favour. However, the key point remains that early voting in Australia seems to be of benefit to one of the major demographic groups that it is designed to serve.
Turning to institutional stakeholders, we find that an important determinant of polling-day voting versus pre-poll voting (and perhaps also postal voting) is the density of polling places in an electoral district. Financial constraints on electoral management bodies such as the AEC, as well as their technical decisions about the allocation of polling places, will have consequences for the numbers of votes that are cast early and on polling day. If legislators are unhappy about the rise in early voting and the effective extension of election day into a longer election period (Mills Reference Mills2019), increasing electoral management body budgets to provide more polling-day venues would likely help dampen demand for early voting.
What are the implications of our research for the contestants? On the face of it, the rise of pre-poll voting has not seen parties ‘bank’ as many early votes as they might like in the electoral districts most likely to determine who wins government. More postal votes may be cast in these electoral districts than in less competitive districts (Table 2). If so, that suggests that parties have been able to use the postal-vote application process to encourage early voting in battleground seats but have either not had the resources or not found the strategies to transfer this success to pre-poll voting. A more positive implication for party officials and candidates is that the disruption to traditional rhythms of effective campaigning posed by early voting might be less than parties fear, since the crucial voters in competitive electoral districts remain more likely than others to wait until polling day to vote.
The finding that the lack of competitiveness has a positive impact on early voting opens an electoral and a normative strand of research. Specifically, if early voting becomes the norm, particularly in uncompetitive seats, how should parties respond with the timing of their major campaign events? Normatively, how long should pre-poll periods run, in order to balance the needs of citizens with the needs of candidates and parties? This article suggests several future empirical avenues of research. There are differences in the results from the aggregate- and individual-level data that could be explored. Additional aggregate-level variables could be included in future analysis. For example, we have shown that the density of polling places on election day is a relevant factor in early voting. However, we have not analysed whether the number and density of early polling places play any role (see Fullmer Reference Fullmer2015). At this stage, we only have included two AES surveys. Future iterations of the AES may provide opportunities to confirm and strengthen the individual-level analysis presented here. Finally, our research could be extended from Australia to other electoral contexts. A priori, our contextual hypotheses regarding institutional and political factors should travel to other settings. This article proposes that approaches combining relevant institutional, political and socioeconomic determinants at both the contextual and individual levels are those that are most likely to advance understanding of levels of early voting.
Supplementary material
The supplementary material for this article can be found at https://doi.org/10.1017/gov.2023.12.
Acknowledgements
Ferran Martinez i Coma acknowledges support from the Australian Research Council Discovery Project (Grant Number DP 190101978). We would like to thank Sam Hannan-Morrow from the AEC for assistance with locating data, as well as Sofia Ammassari, Max Groemping, Ignacio Lago, Duncan McDonnell, Lee Morgenbesser, participants at the 2021 EIP Annual Workshop and the 2021 Australian Political Studies Association Conference, and the two anonymous reviewers, for constructive feedback on earlier versions of the article. All errors are our own.


 Open access