


Social media summary
A new review of virtual water trade in light of groundwater use and sustainability highlights remaining challenges: considering all water sources while distinguishing groundwater; improving estimates of storage and dynamics; and better integrating ecological needs for water.
1. Introduction
Water on Earth is a limited resource, with more or less quickly renewable reservoirs. It follows a conceptually simple cycle at continental to global scales: solar energy evaporates water from oceans, lakes, streams and soils, and vegetation carries water from the soil to the atmosphere as it transpires while using solar radiation to assimilate carbon (photosynthesis). Evaporated and transpired water in the atmosphere then provides precipitation of liquid and solid water, which replenishes soil and surface water bodies through infiltration and surface runoff and recharges shallow and deep groundwater. Details of these processes, including water pathways, thermodynamics, transit and residence times, can be very complex and difficult to quantify across the spatial and temporal scales of interest.
Importantly, groundwater is by far the largest stock of liquid freshwater available for human use (99%), and the most slowly renewed. The average residence time of groundwater in the world's aquifers is approximately 1400 years (Shiklomanov, Reference Shiklomanov1997), but rates of groundwater turnover vary widely among and within aquifers (Befus et al., Reference Befus, Jasechko, Luijendijk, Gleeson and Bayani Cardenas2017; Wada et al., Reference Wada, van Beek, van Kempen, Reckman, Vasak and Bierkens2010). Consequently, groundwater management is key, and ensuring sustainable use of groundwater resources is an important challenge. Human development of groundwater resources, including large-scale deployment of irrigation systems, has often led to water imbalances or ‘mining’ of groundwater, causing drastic lowering of groundwater levels and associated storage. This is a form of unsustainable groundwater use, as the resource is being overexploited and thus will not be physically (or economically) available after a certain period of time if depletion continues. In practical terms, non-renewable water use may induce long-term groundwater depletion (GWD), as well as reduced surface water discharge and degradation of water quality in various forms.
Prior to large-scale water transfers between natural basins and before significant global trade of water-intensive commodities such as grains, GWD was primarily a local issue. Understanding of its causes and potential solutions required primarily regional studies of hydrogeology. Globalization has now led to worldwide trading of ‘virtual water’ (water consumption associated with a commodity), and studies of the relevant issues now require global and international information, going beyond biophysical processes and the natural water cycle. Projections of climate change and its uncertainty further complicate global and regional estimates and predictions of groundwater sustainability (as defined in Section 3). In view of these issues, and despite their challenges, the sustainability of (ground) water resources has been assessed globally in light of water sources (Rost et al., Reference Rost, Gerten, Bondeau, Lucht, Rohwer and Schaphoff2008; Siebert & Döll, Reference Siebert and Döll2010), population and climate changes (Vörösmarty et al., Reference Vörösmarty, Green, Salisbury and Lammers2000), agricultural sustainability (Dalin et al., Reference Dalin, Wada, Kastner and Puma2017; Scanlon et al., Reference Scanlon, Faunt, Longuevergne, Reedy, Alley, McGuire and McMahon2012; Wada et al., Reference Wada, van Beek and Bierkens2012) and overall GWD (Gleeson et al., Reference Gleeson, Wada, Bierkens and van Beek2012; Konikow & Kendy, Reference Konikow and Kendy2005). The global storage and distribution of groundwater continue to fuel interest and concern (Gleeson et al., Reference Gleeson, Befus, Jasechko, Luijendijk and Cardenas2016), and regional assessments demand attention for historical understanding (Alley & Alley, Reference Alley and Alley2017; Rodell et al., Reference Rodell, Famiglietti, Wiese, Reager, Beaudoing, Landerer and Lo2018) and perspective in light of projected climate change (Green et al., Reference Green, Taniguchi, Kooi, Gurdak, Allen, Hiscock, Treidel and Aureli2011; Taylor et al., Reference Taylor, Scanlon, Döll, Rondell, van Beek, Wada and Treidel2013).
Agriculture accounts for 90% of human freshwater consumption (consumptive use of surface water and groundwater), largely dominating the industrial and domestic sectors globally. About 40% of this consumption is now from groundwater, and most regions experiencing GWD (Rodell et al, Reference Rodell, Famiglietti, Wiese, Reager, Beaudoing, Landerer and Lo2018; Wada et al., Reference Wada, van Beek, van Kempen, Reckman, Vasak and Bierkens2010) are large agricultural production areas. The importance of groundwater as an irrigation source varies across the world: the ratios of the total area with groundwater irrigation to the total irrigated land are approximately 44%, 38%, 32%, 24% and 19% in America, Asia, Europe, Oceania and Africa, respectively (Siebert et al., Reference Siebert, Burke, Faures, Frenken, Hoogeveen, Doll and Portmann2010). The fraction of area irrigated with groundwater has increased rapidly since the 1960s, including in the USA and India (Konikow, Reference Konikow2011; Siebert et al., Reference Siebert, Burke, Faures, Frenken, Hoogeveen, Doll and Portmann2010). The volume of cumulative GWD in the USA increased from about 200 km3 in 1960 to 1000 km3 in 2008 (Figure 1). This trend is expected to continue in the coming decades, as water and food demands are projected to increase individually by 55% and 60%, respectively, to 2050 (Ferroukhi et al., Reference Ferroukhi, Nagpal, Lopez-Peña, Hodges, Mohtar, Baher and Keulertz2015).
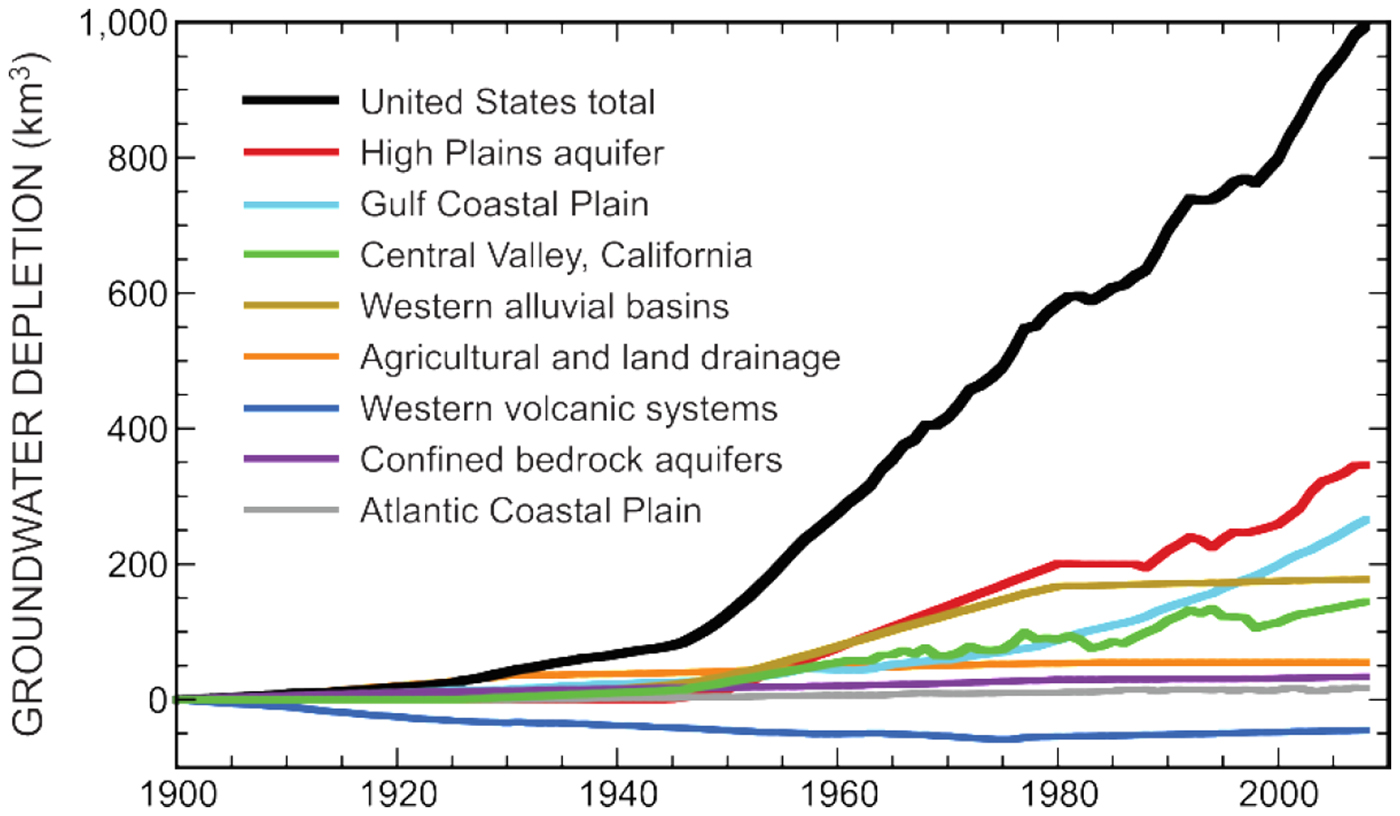
Fig. 1. Annual cumulative groundwater depletion in regions of the USA from 1900 to 2008. Source: Konikow (Reference Konikow2013).
In this review, we highlight findings about the use of groundwater resources for food production globally, the sustainability of this use and how this affects food and water security in both food-producing and food-importing regions. We present the current state of knowledge regarding the critical issue of the sustainability of water use for food production and pinpoint key research directions ahead towards an improved understanding of this major global phenomenon.
2. Water use for global food production and virtual water flows via international food trade
Given the importance of agriculture for global water use (90% of freshwater consumption and 70% of freshwater withdrawals) and the globalization of food production and supply, many scientific studies have recently focused on agricultural water use and transfers of water resources via food trade. Allan (Reference Allan1997) coined the term virtual water to refer not to the physical volume of water contained in food commodities (such as the water physically present in a tomato), but to the volume of water that was consumed by the crop during its growing period. Here, ‘consumed water’ refers to the water that is evapotranspired during crop production and is no longer immediately available to the producing location. Other terms have been used to refer to this water consumption associated with food commodities, such as ‘water footprint’ or ‘embedded water’, which are equivalent to the ‘virtual water content’ (VWC; in cubic metres of water per ton of product) of a product.
When focused on water consumption by agricultural crops, VWC (m3water/tonnecrop, or Lwater/kgcrop) is the ratio of evapotranspiration (ET; m3water/m2land) to yield (Y; tonnecrop/m2land) over the growing season (Hanasaki et al., Reference Hanasaki, Inuzuka, Kanae and Oki2010).
Crop VWC can be split into ‘blue’ and ‘green’ components, if one can determine how much ET is satisfied by rainwater (green ET) and how much additional water is applied via irrigation (driving blue ET). For most groundwater irrigation systems, conveyance losses are considered negligible.
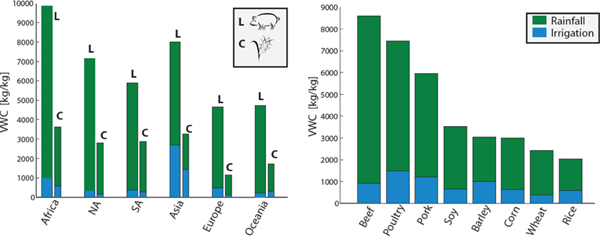
Across regions, VWC values are mainly influenced by varying climates and agricultural practices. Arid climates have a higher evaporative demand for water, which increases the ET and thus VWC. Places with intensive farming practices will have relatively high crop yields, which can help increase water use efficiency and decrease total VWC. Continental-scale patterns of crops and livestock VWC are shown in Figure 2. Note that Africa exhibits the largest crop VWC (about 3500 m3/tonne). This is primarily driven by low yields throughout the continent. In contrast, Europe exhibits the lowest crop VWC (about 1200 m3/tonne) because of its overall high yields and relatively low aridity. Importantly, most studies of crop water use have distinguished ‘green’ (rainfed only) and ‘blue’ (irrigation) water uses, as irrigated and rainfed production have many important differences in both socioeconomic and biophysical terms. Globally, irrigation is most important for food produced in Asia (Figure 2A) and represents a larger fraction of water use for maize than for wheat (Figure 2B).

Fig. 2. Mean virtual water content (VWC) by water source. The blue portion of the bar represents the blue VWC (from irrigation water); the green portion shows the green VWC (from soil moisture). Left panel: Mean VWC for each of the six regions: Africa, North America, South America, Asia, Europe and Oceania. Thick bars represent livestock (L) products: beef, pork and poultry. Thin bars show crops (C): barley, maize (corn), rice, soy and wheat. Right panel: Global average VWC for each of the unprocessed livestock and crop products. The units are kilograms of water per kilogram of crop, equivalent to litres of water per kilogram of crop or m3/Mg (1 Mg = 1 tonne). Source: Konar et al. (Reference Konar, Dalin, Suweis, Hanasaki, Rinaldo and Rodriguez-Iturbe2011).
VWC is also highly variable across agricultural products. On a global average, for example, soybean is shown to have a higher total VWC than wheat (Figure 2B). Similarly, meat products, in particular beef, have a much higher VWC (by mass, but also per kilocalorie) than grains. This is because meat's VWC accounts for the water consumed to produce all of the livestock feed required for the animal throughout its lifetime, and calorie conversion by animals from plants has a low efficiency (e.g., 10–40 calories of plant are needed for 1 calorie of beef meat; Eshel et al., Reference Eshel, Shepon, Makov and Milo2014).
Virtual water trade (VWT) refers to the exchanges of virtual water between different regions via the exchange of physical goods (e.g., food commodities). In other words, VWT is the amount of water embedded in traded goods. This concept was introduced to highlight the hidden water resources consumed by countries that import food produced abroad, and thus virtually import some of their trade partners’ water resources. In other words, food importers are important driving forces of water resource consumption occurring in their trade partner countries. To estimate the water resource use embedded in food trade, the general equation is as follows: VWT i,j,c = VWC i,c × T i,j,c, where VWT i,j,c is the VWT (i.e., water embedded in trade, m3/year) of crop c from region i to j; VWC i,c is the VWC (i.e., amount of water embedded in each unit of crop c, m3/tonne) in region i and T i,j,c is the trade of crop c from region i to j (tonne/year).
International VWT via food trade has been increasing rapidly between the mid-1980s to the late 2000s. Dalin et al. (Reference Dalin, Konar, Hanasaki, Rinaldo and Rodriguez-Iturbe2012) found that both the number of country pairs trading with each other and the global volume of international VWT approximately doubled from 1986 to 2007 (Figure 3). The increase in VWT volume is mainly due to a rise in international food trade itself, although it increased less rapidly than trade in industrial goods over the same period. Consequently, water resource management, particularly groundwater management, has shifted from a local/regional issue to an increasingly international issue (Aeschbach-Hertig & Gleeson, Reference Aeschbach-Hertig and Gleeson2012).
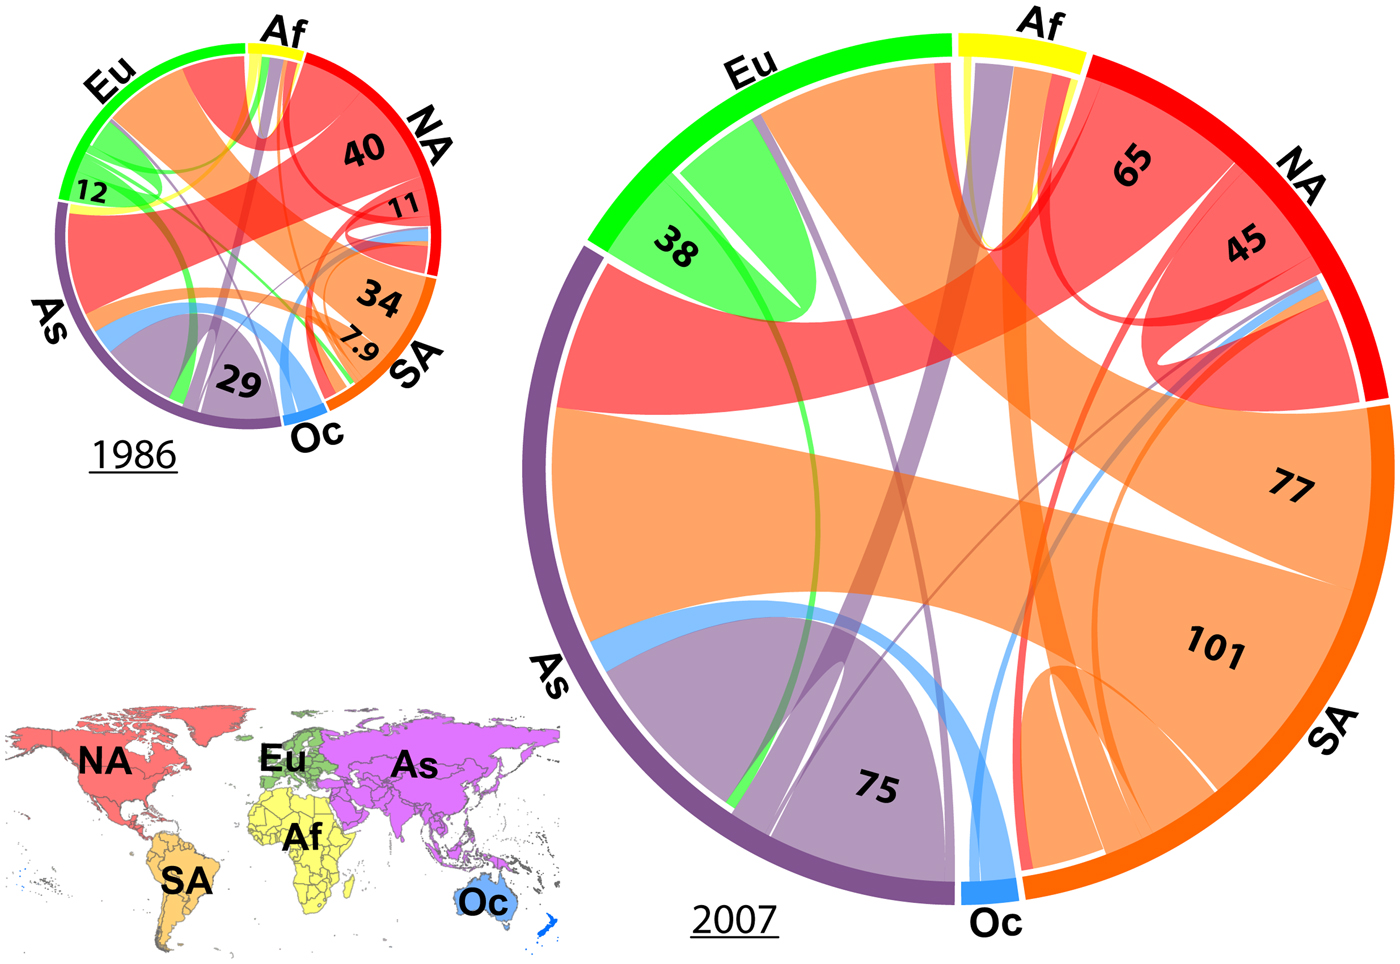
Fig. 3. Virtual water trade via international food trade (in billions of cubic metres) in the years 1986 and 2007, grouped by region (Af = Africa; NA = North America; SA = South America; Oc = Oceania; As = Asia; Eu = Europe). The map in the lower left provides a key to the regional colour scheme. The colour of each ribbon indicates the region of export. Source: taken and modified from Dalin et al. (Reference Dalin, Konar, Hanasaki, Rinaldo and Rodriguez-Iturbe2012).
The growth of VWT volume takes place unevenly among the world's regions (Figure 3). Exports from South America to Asia contributed the most to the VWT volume increase between 1986 and 2007 (30%), followed by internal trade in North America (11%). South America has become a major virtual water exporter, with exports to all other main regions except North America and negligible imports. Asia more than doubled its imports, importing mostly from South America (39%) and North America (25%), with an important internal VWT (29%). Exports from North America to Europe have shrunk, whereas exports from North America to Asia have increased (by 60%), but less than North American internal trade did (mostly between the USA, Canada and Mexico; by 310%); therefore, North American internal trade is now comparable in volume with North American exports to Asia (Figure 3) (Dalin et al., Reference Dalin, Konar, Hanasaki, Rinaldo and Rodriguez-Iturbe2012).
Konar et al. (Reference Konar, Dalin, Hanasaki, Rinaldo and Rodriguez-Iturbe2012) show how the ranking of countries in terms of virtual water exports changes when the type of water source is considered. For example, the USA, India and Pakistan are the top three exporters of blue virtual water, while Argentina and Brazil fall from positions 2 and 3 for green water VWT to positions 6 and 9 for blue VWT, respectively. These changes are due to both climatic and technological considerations of the countries of export. Some countries with very widespread irrigation use and arid climates are highlighted, such as Iraq and Morocco, both being in the top five exporters of blue virtual water. While these countries do export these crops and associated commodities, it is really their exceptionally high blue VWC (i.e., high use of irrigation water per unit crop) that drives them to be amongst the top exporters of blue virtual water.
Importantly, although the distinction between ‘green water’ (water stored in the soil, the only source of water for rainfed crops) and ‘blue water’ (supplied as irrigation from streams, lakes, reservoirs and groundwater) was made early on in VWT studies (Mekonnen & Hoekstra, Reference Mekonnen and Hoekstra2011), groundwater has seldom been distinguished from other sources of irrigation (e.g., focusing only on groundwater use; Marston et al., Reference Marston, Konar, Cai and Troy2015). Moreover, only a few recent VWT studies include, beyond volumes of water consumed, the notion of environmental impact or sustainability of water use (e.g., Dalin et al., Reference Dalin, Wada, Kastner and Puma2017; Mekonnen & Hoekstra, Reference Mekonnen and Hoekstra2016; Yano et al., Reference Yano, Hanasaki, Itsubo and Oki2015).
3. Sustainability of water use for global food production and international trade
3.1. Sustainability of water use for global food production and implications for water and food security
Water is key for sustainability as it is essential for human survival, ecosystem health and socioeconomic development. This role was highlighted by the United Nations’ International Decade for Action, centred on ‘Water for Life’ (2005–2015; UN, 2015a). Water sustainability is multifaceted and often coupled with development for societal goals, raising the question, ‘Is sustainable development an oxymoron?’ That is, at what point do human activities overwhelm natural resources? In particular, sustainable water management for agriculture is a major concern (OECD, 2010). Rising global population is the primary driver of increased agricultural water use. Increasing wealth also leads to greater demand for water-intensive food commodities; thus, there is a projected need to double food production by 2050 (OECD, 2010).
Because surface water and groundwater are coupled (more or less strongly in different regions), groundwater sustainability is a subset of overall agricultural water sustainability. The term ‘sustainability’ is often used without any definition in various contexts. The US National Groundwater Association (NGWA) has picked the following as their consensus definition of groundwater sustainability: “the development and use of groundwater resources to meet current and future beneficial uses without causing unacceptable environmental or socioeconomic consequences” (Alley et al., Reference Alley, Reilly and Franke1999), together with a definition of resilience, which encompasses the “ability of a system to resist long-term damage and the time taken to recover from a perturbation” (https://www.ngwa.org/what-is-groundwater/groundwater-issues/groundwater-sustainability).
Metrics of groundwater sustainability may include the ‘sustainable yield’ of particular aquifers. Sustainable yield of an aquifer has been critiqued mainly due to dependency on the local and regional groundwater recharge in several studies (Alley, Reference Alley2007; Konikow & Leake, Reference Konikow and Leake2014; Sophocleous, Reference Sophocleous2000). In general, we do not endorse the use of sustainable yield because the definition (e.g., the amount of groundwater that can be safely pumped from an aquifer) remains controversial due to a combination of hydrogeophysical and socioeconomic factors. Furthermore, quantitative assessments of set definitions are often highly uncertain (Maimone, Reference Maimone2004). In arid to semi-arid regions, where groundwater is the most reliable source of irrigation water, annual groundwater recharge is typically a very small fraction of (recent) historical annual precipitation, and many deep aquifers were recharged (originally charged) under prehistoric conditions that may have been much wetter.
Despite these challenges, tools for assessing changes in subsurface water storage have improved dramatically in recent decades. At regional scales (on the order of 100,000 km2), GRACE satellite measurements of gravity changes (e.g., Fukuda et al., Reference Fukuda, Yamamoto, Hasegawa, Nakaegawa, Nishijima and Taniguchi2009; Long et al., Reference Long, Scanlon, Longuevergne, Sun, Fernando and Save2013) have enabled precise assessments of trends and intra-annual dynamics of terrestrial and (combined with hydrological models) aquifer water storage. These measurements are supplemented by borehole water-level measurements, geophysical surveys and simulations of aquifer systems conditioned upon these types of measurements. Thus, it is possible to detect trends and it is even feasible to project changes in groundwater levels associated with changes in land use, management and climate. Generally, the skill and confidence in such estimates increase with spatial scale and over moderate timescales. Wada and Bierkens (Reference Wada and Bierkens2014) developed a Blue Water Sustainability Index; they concluded that approximately 30% of global water use is unsustainable historically, and they projected increasing unsustainability.
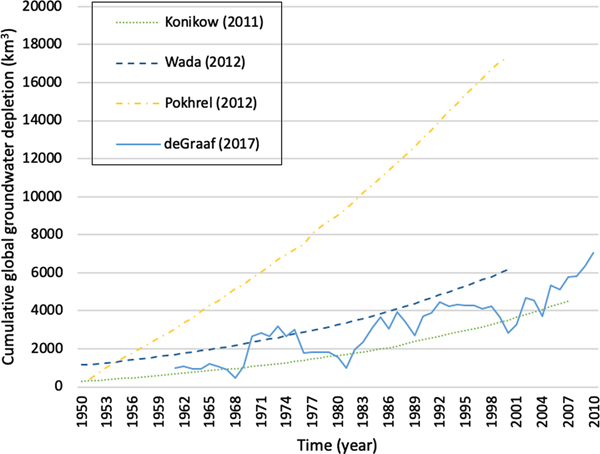
A range of methods has been applied to quantify the sustainability of groundwater use across different scales, and uncertainties often remain large. Wada et al. (Reference Wada, Reager, Chao, Wang, Lo, Song and Gerdner2017) summarized recent changes in ‘land water storage’, including GWD from regional to global scales. Methods of estimation included regional statistics of traditional borehole water measurements, GRACE satellite-derived storage changes, numerical groundwater flow models (e.g., MODFLOW) and models combined with in situ groundwater measurements and satellite data. GWD values were reported in km3/year, which are scale dependent and vary dramatically across the globe. Global estimates were also highly variable (~27–455 km3/year) depending upon the method, time period and regional extent of the assessment. In their maximum confining scenario (Figure 4), de Graaf et al. (Reference de Graaf, van Beek, Gleeson, Moosdorf, Schmitz, Sutanudjaja and Bierkens2017) estimated total GWD over 1960–2010 at 7013 km3, which is comparable to previous published estimates of volume- and flux-based approaches. Their estimated depletion calculated as the deficit between groundwater recharge and abstraction for cells where more water is abstracted than recharged (Figure 4) (de Graff et al., Reference de Graaf, van Beek, Gleeson, Moosdorf, Schmitz, Sutanudjaja and Bierkens2017, not shown, and flux-based method as used in Pokhrel et al., Reference Pokhrel, Hanasaki, Yeh, Yamada, Kanae and Oki2012) shows much larger depletion volumes of 26,700 km3 over 1960–2010. The difference in estimated depletion can be explained by the increase in surface water capture, which is not included by calculating the recharge–abstraction difference, but is included in the groundwater model. Thus, de Graaf et al. (Reference de Graaf, van Beek, Gleeson, Moosdorf, Schmitz, Sutanudjaja and Bierkens2017) recommended using a lateral groundwater model, accounting for groundwater–surface water interactions, when studying the sensitivity of aquifers to storage changes. Associated values of the corresponding regional contributions to sea-level rise were estimated globally at less than 1 mm/year for all but one study. We note that the Konikow (Reference Konikow2011) estimates are not generated by a global model, but based on observations (field data, remote sensing) and on local hydrogeological knowledge.
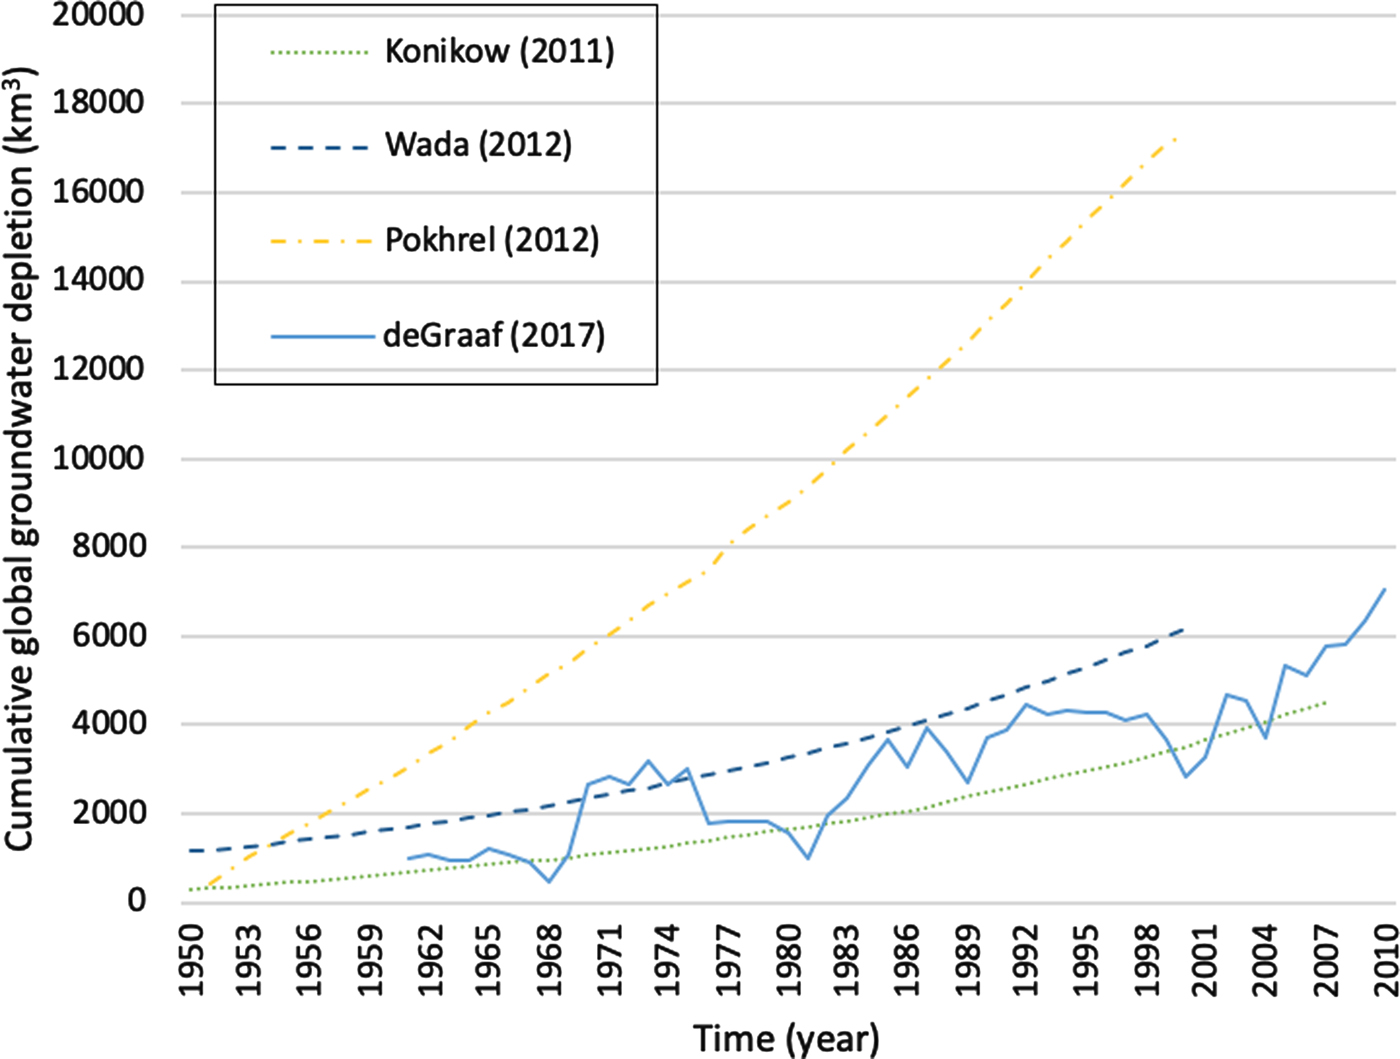
Fig. 4. Cumulative groundwater depletion (in km3) between 1950 and 2010 from various studies. Sources: taken and modified from Aeschbach-Hertig and Gleeson (Reference Aeschbach-Hertig and Gleeson2012) and de Graaf et al. (Reference de Graaf, van Beek, Gleeson, Moosdorf, Schmitz, Sutanudjaja and Bierkens2017).
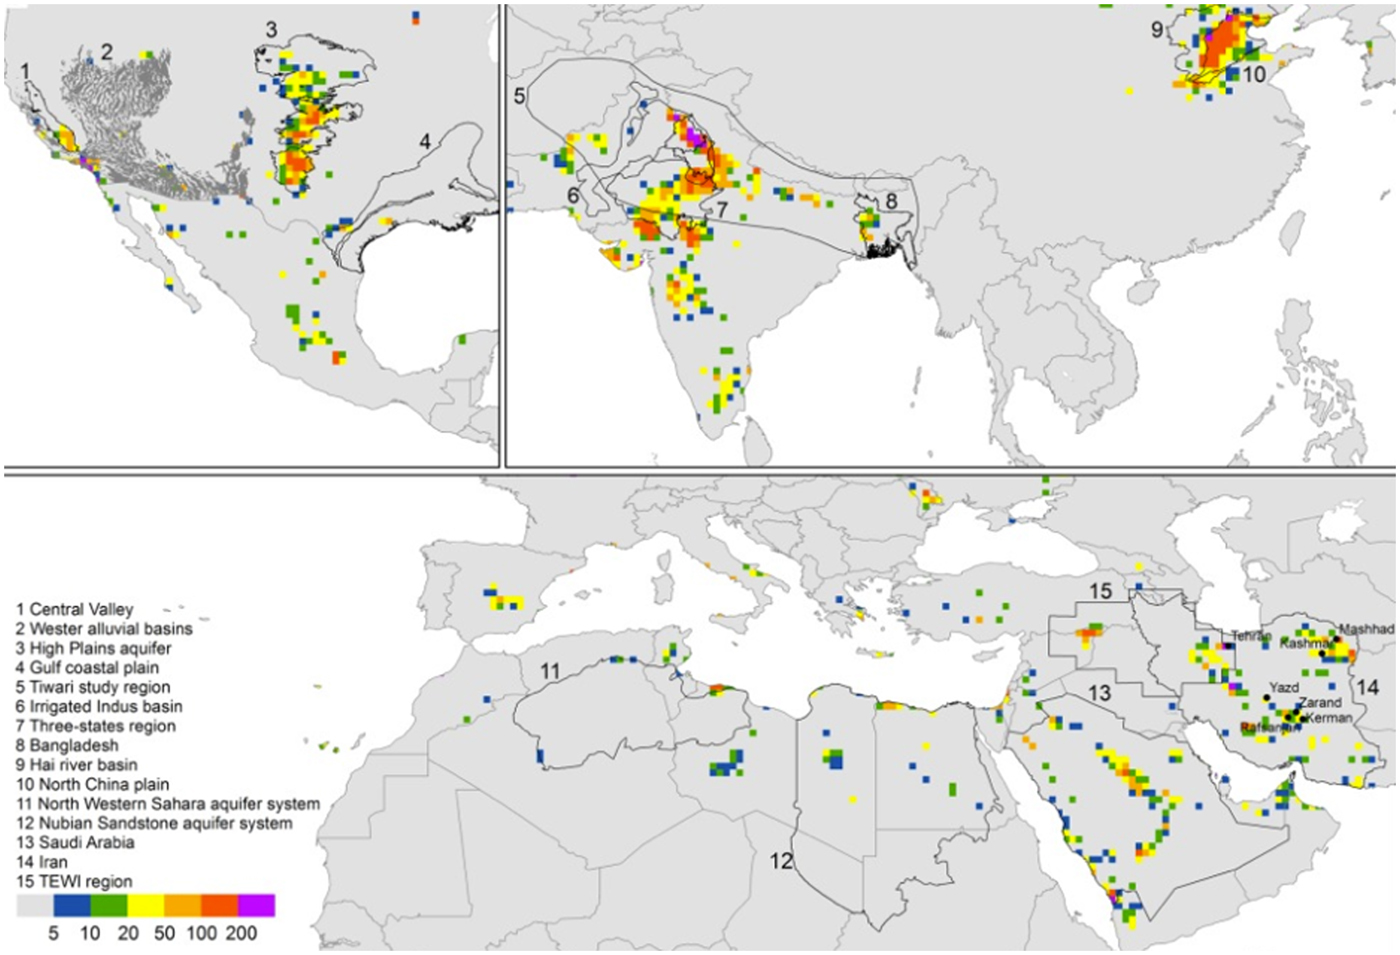
Taylor et al. (Reference Taylor, Scanlon, Döll, Rondell, van Beek, Wada and Treidel2013) reviewed the status of GWD and associated sea-level rise estimates, cautioning that, “Direct observations of GWD continue to be hampered by a dearth of ground-based observations, which not only limits our understanding of localized groundwater storage changes but also our ability to constrain evidence from GRACE satellite observations at larger scales (≥150,000 km2).” They also noted that GWD is most pronounced in parts of Asia (China and India) and North America (Table 1). The regions of greatest GWD are areas of high groundwater pumping for irrigated agriculture, such as the southern Ogallala (or High Plains) aquifer in Texas, USA, northern India and the North China Plain (Figure 5). A recent regional study in eastern Australia (Le Brocque et al., Reference Le Brocque, Kath and Reardon-Smith2018) used detailed groundwater-level data to identify net GWD along with a high degree of spatial and temporal variability over the period of 1989–2015.
Table 1. Continental-level metrics from various global studies: groundwater use in irrigation, groundwater depletion and groundwater depletion embedded in traded crops.


Fig. 5. Map of groundwater depletion (mm/year) estimated by Döll et al. (Reference Döll, Müller Schmied, Schuh, Portmann and Eicker2014) for various regions for the period 1980–Reference Döll2009. Source: Döll et al. (Reference Döll, Müller Schmied, Schuh, Portmann and Eicker2014). TEWI = Tigris–Euphrates–Western Iran.
Notably, the quantification of long-term GWD is necessary but not sufficient for assessing the sustainability of groundwater-based irrigation. In addition to depletion, decreasing groundwater storage may affect groundwater discharge to wetlands, streams and associated ecosystems that are particularly vulnerable to decreased groundwater supply. We do not propose new measures or indicators of groundwater sustainability, but there are several studies and reports addressing potential indicators (e.g., Canadian Council of Ministers of the Environment, 2017; UNESCO, 2007). Indicators of groundwater sustainability are discussed later in this section.
The water and food securities of food trade partners are connected. Indeed, food security in importing regions depends on the water conditions in their trade partners. On the other hand, water security in food-exporting regions depends on the food demand and price in the importing regions.
Water can be considered as both a tradable and a non-tradable good. Non-tradable goods are, for example, ecosystem services such as soil fertility, while tradable goods are, for example, food commodities and fossil fuels. Some water, such as bottled water, is traded globally; however, most water resources cannot be traded due to low economic value compared to the cost of transportation, but water does provide non-tradable ecosystem services (e.g., for tourism) and is also an essential input for traded goods like food commodities. Moreover, water can be moved across neighbouring basins for different uses.
These (non-)tradable characteristics of water as a good and a resource are important for sustainability. In terms of global sustainability, trade goods should be considered globally and non-trade goods should be considered in terms of local impacts. In the case of carbon footprint, the effects of greenhouse gas emissions (global warming and its impacts) occur globally; therefore, a reduction of greenhouse gas emissions anywhere is effective and potentially marketable (e.g., carbon credits). However, in the case of water footprint, food demand (cause) occurs globally, while its potential impacts (e.g., water depletion) occur locally. Unlike greenhouse gas emissions, a certain amount of agricultural water use will have varying impacts across regions (depending upon whether the region is water abundant or water scarce).
Another point is that food production causes not only water consumption that can be embedded in traded products, but also moves water, via ET, to the atmosphere. This water vapour then physically moves across basins or even continents. This process of ‘precipitation recycling’ (Eltahir & Bras, Reference Eltahir and Bras1994) can result in additional water availability elsewhere. Despite recent insights into the social dimensions of moisture recycling (Keys & Wang-Erlandsson, Reference Keys and Wang-Erlandsson2018), to our knowledge, recycled precipitation has not been marketed or traded, probably due to large uncertainties in its estimated amount and space–time distribution.
Both surface water and groundwater are used for irrigation in food production. They are distinct due to their different reservoir residence times (generally much longer for groundwater) and source types (point/line source for surface water and non-point/areal source for groundwater). These differences between irrigation sources cause different water–food–land relationships. Groundwater is often easier to access with a lower initial cost than surface water because it flows slowly under the land where irrigation is needed. Although groundwater and surface water can produce both food as tradable goods and non-tradable ecosystem services, groundwater is much closer to the land (non-trade goods), and the impacts of water use for food production occur more locally in the case of groundwater than surface water. In other words, the cause of (ground)water use for food and ecosystem services and the impacts of (ground)water depletion/problems occur at a smaller (local) scale for groundwater, but a larger (regional/basin) scale for surface water. However, the recent rise in global food trade changed water–food–land relationships because the cause of (ground)water use for food has now shifted to the global scale (global demand for food, feed and fuel). So, water resources for irrigation have become globalized, even though the impacts occur locally.
Groundwater resource management is often more challenging to regulate than surface water resource management because of the invisibility of the resource and the uncertainties about the amount of water stored and the dynamics of groundwater resources. In addition, another difference of management between groundwater and surface water is spatial scale. Local resource management is typically connected with land for groundwater and while management is done at the regional/basin scale for surface water. With increasing global food trade, the gap in management scale becomes even larger: local–global for groundwater and regional/basin–global for surface water.
Matching of spatial scale of manageable water resources and tradable water resources is key for sustainable water use for food production. The global economy causes food trading with water footprints, which may impact the local environment. Therefore, visualization of the groundwater footprint by food trade (e.g., Dalin et al., Reference Dalin, Wada, Kastner and Puma2017) is an important step towards understanding sustainable groundwater use for food production.
Water footprint with indices normalized by hydrological condition (wet area or dry area) is one of the potential indices that is different from carbon footprint. Trade/non-trade goods and manageable/less manageable concepts of groundwater use for food production can be also considered for global sustainability.
An increasing number of studies have introduced various indicators to evaluate the sustainability of human water use or the degree of exploitation of available water resources (Hanasaki et al., Reference Hanasaki, Kanae, Oki, Masuda, Motoya, Shirakawa, Shen and Tanaka2008; Vanham et al., Reference Vanham, Hoekstra, Wada, Bouraoui, de Roo, Mekonnen and Bidoglio2018; Wada et al., Reference Wada, van Beek, van Kempen, Reckman, Vasak and Bierkens2010, Reference Wada and Bierkens2014). Such indicators can be related to particular agricultural products and then combined with trade data to include aspects of environmental impact and sustainability of water use in VWT analysis.
These indicators have highlighted regions with major water insecurity through analyses at country (Seckler, Reference Seckler, Barker and Amarasinghe1999) or grid levels (Mekonnen & Hoekstra, Reference Mekonnen and Hoekstra2016), on an annual (Wada et al., Reference Wada and Bierkens2014) or monthly basis (Hoekstra et al., Reference Hoekstra, Mekonnen, Chapagain, Mathews and Richter2012; Scherer et al., Reference Scherer and Pfister2016) and also integrating both temporal scales (Brauman et al., Reference Brauman, Richter, Postel, Malsy and Florke2016) and studying water availability and sustainability outcomes under a range of scenarios (Wada et al., Reference Wada and Bierkens2014).
Most water scarcity metrics are based on risk categories, such as ‘high water stress’ if the use-to-availability ratio is greater than 0.4 and ‘very high water stress’ if it is greater than 0.8 (Alcamo et al., Reference Alcamo, Henrichs and Rosch2000). Other metrics introduced a threshold to define water scarcity conditions. For instance, the Falkenmark indicator (Falkenmark, Reference Falkenmark1989) measures the number of people per unit flow of available freshwater, considering 1700 m3/cap/year as a threshold to define a situation of ‘water scarcity’. In the framework of life-cycle assessment, other indicators have been introduced (Kounina et al., Reference Kounina, Margni, Bayart, Boulay, Berger, Bulle and Humbert2013) to assess the potential environmental impact of water use. These indicators aim at quantifying the potential impact based on freshwater use inventory schemes (Boulay et al., Reference Boulay, Bouchard, Bulle, Deschenes and Margni2011) weighted by local characterization factors that transform inventory flows into environmentally equivalent flows (Pfister et al., Reference Pfister, Bayer, Koehler and Hellweg2011).
More recently, Yano et al. (Reference Yano, Hanasaki, Itsubo and Oki2016) proposed a local ‘water unavailability’ factor to weight the water footprint of agriculture based on water availability, hence providing information on the sustainability of crop production. Yano et al. (Reference Yano, Hanasaki, Itsubo and Oki2016) were the first to distinguish green, surface water and groundwater resources, but their study lacks specific analyses at the crop level and at the sub-national and sub-basin scales. Brauman et al. (Reference Brauman, Richter, Postel, Malsy and Florke2016) identified the regions that are most vulnerable to water shortage with a water depletion metric, but without looking at green water scarcity, even though green and blue water sources are highly connected (Falkenmark, Reference Falkenmark2013; Vanham et al., Reference Vanham, Hoekstra, Wada, Bouraoui, de Roo, Mekonnen and Bidoglio2018). Gleeson et al. (Reference Gleeson, Wada, Bierkens and van Beek2012) also shed light on the impacts of human water withdrawals on groundwater resources, showing that, on a global average, we use groundwater 3.5 times faster than the sustainable rate. They introduced the concept of the groundwater footprint, defined as the area-averaged ratio of abstraction to recharge (where the contribution to environmental streamflow is first deduced from the recharge), with data sources and models similar to those used by Wada et al. (Reference Wada, van Beek, van Kempen, Reckman, Vasak and Bierkens2010) (i.e., PCR-GLOBW and national groundwater use statistics). Tuninetti et al. (Reference Tuninetti, Tamea and Dalin2019) introduced the crop-specific ‘water debt’ indicator, comparing crop water use to availability of green, surface water and groundwater resources from grid cell to watershed and at a national scale.
3.2. Quantification of groundwater depletion for food production and trade
A few studies are emerging that are linking these analyses of water sustainability with international food trade on the model of VWT analysis (e.g., Mekonnnen & Hoekstra, Reference Mekonnen and Hoekstra2016; Yano et al., Reference Yano, Hanasaki, Itsubo and Oki2015) with the aim of providing additional information compared to simply volume-based estimates of water use, by accounting for local conditions affecting water resource availability or renewability. Hoekstra and Mekonnen (Reference Hoekstra and Mekonnen2016) focused on surface water irrigation for UK imports, comparing it to runoff net of other upstream uses, but did not consider groundwater use or green water. Considerations of GWD and trade were recently done for the first time (Dalin et al., Reference Dalin, Wada, Kastner and Puma2017), although they were not presented alongside estimates of sustainability for surface and green water.
The first crop-specific estimates of GWD for irrigation were done by Dalin et al. (Reference Dalin, Wada, Kastner and Puma2017), and these were used to quantify the amount of GWD in international food trade. Previous estimates of GWD were rarely linked to the particular reason for the groundwater abstraction, and never to specific agricultural products. However, this is necessary in order to be able to link the estimates of GWD for irrigation with food trade data (see the VWT equation in Section 2) and to attribute this unsustainable water use to the final consumer of these water-intensive products. Dalin et al. (Reference Dalin, Wada, Kastner and Puma2017) focused on the unsustainable use of groundwater in its hydrogeophysical sense (i.e., the volume of GWD resulting from groundwater abstraction for irrigation, estimated as abstraction minus net natural recharge and irrigation return flow). Marston et al. (Reference Marston, Konar, Cai and Troy2015) also used the term ‘volume of groundwater per commodity unit’ to discuss virtual groundwater transfers within the USA. Although they focused on stressed aquifers, the link between traded products and depletion was not made explicit. Similarly to previous studies (e.g., Gleeson et al., Reference Gleeson, Wada, Bierkens and van Beek2012; Wada et al., Reference Wada, van Beek, van Kempen, Reckman, Vasak and Bierkens2010) that analysed GWD in general, Dalin et al. (Reference Dalin, Wada, Kastner and Puma2017) found that GWD for irrigation is increasing over time (by 22% from 2000 to 2010, with a doubling in China), and that this is largely concentrated in a few hotspot regions, notably North America, the Middle East and North Africa (MENA) region, Pakistan, India and China. Globally, this was mainly associated with wheat and rice production.
Dalin et al. (Reference Dalin, Wada, Kastner and Puma2017) found that 11% of the GWD embedded in crop production was exchanged via international trade. This is less than the share of total crop water use embedded in trade, likely because countries with the highest GWD (e.g., the MENA region, India) trade relatively less than others (e.g., France or Brazil). The volume of virtual GWD trade increased by 44% from 2000 to 2010 globally, with the greatest increases in exports from India (doubling) and imports by China (tripling; Dalin et al., Reference Dalin, Wada, Kastner and Puma2017). These exchanges are dominated (two-thirds) by exports from only three countries: Pakistan (33% of total GWD trade flows), the USA (25%) and India (10%) (Figure 6). China is the largest net importer (10% of the total flows), while other key importers include Iran, Mexico and the USA (Dalin et al., Reference Dalin, Wada, Kastner and Puma2017).
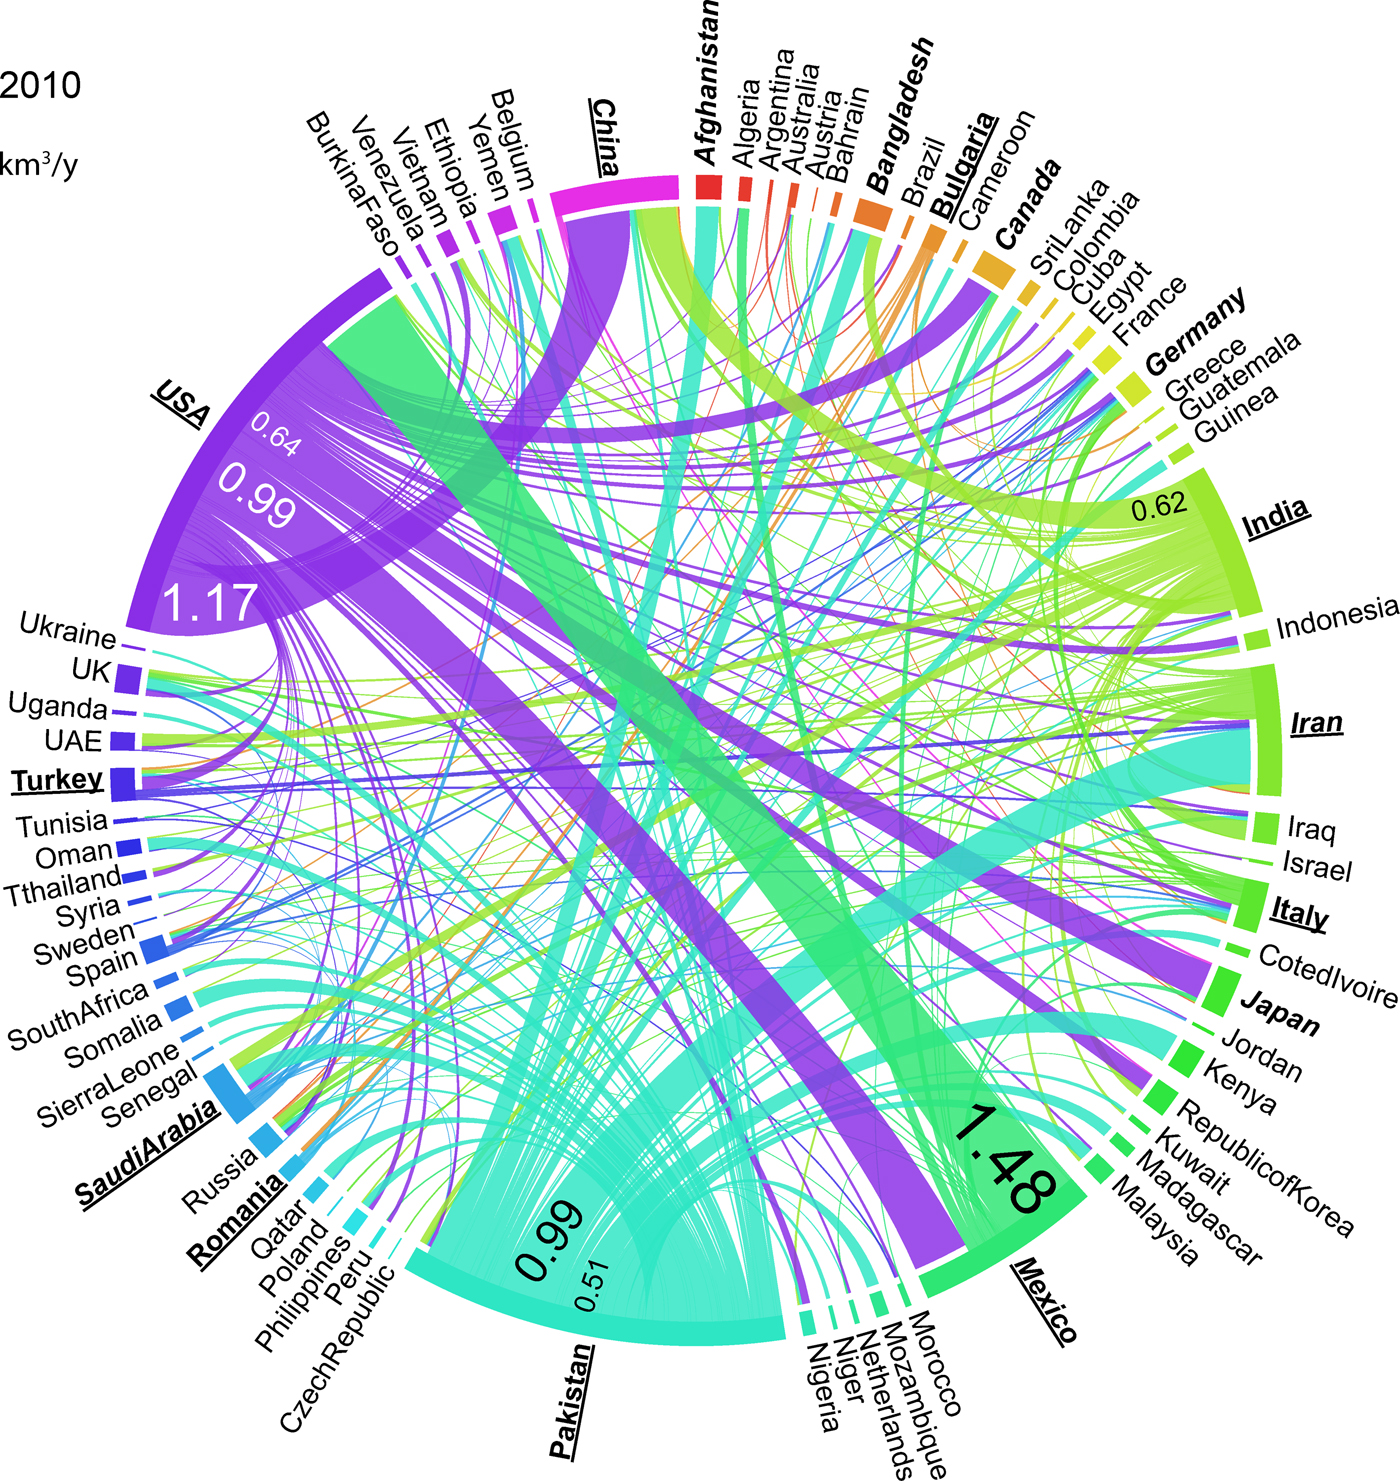
Fig. 6. Embedded groundwater depletion in the international trade of crop commodities in 2010. Volumes are in units of cubic kilometres per year. The top ten importers are shown in bold font and the top ten exporters are underlined. Ribbon colours indicate the country of export. Source: Dalin et al. (Reference Dalin, Wada, Kastner and Puma2017).
Importantly, several countries are among both the top exporters (i.e., producers of crops irrigated from overexploited aquifers) and the top importers (i.e., dependent on foreign crops also produced unsustainably): the USA, Mexico, China, Iran and Saudi Arabia (Dalin et al., Reference Dalin, Wada, Kastner and Puma2017). These countries are thus exposed to risks to their food supply both domestically and via imports.
This study showed that most countries in the world are sourcing large parts of their food imports from countries that irrigate the specific crops with water from overexploited aquifers (e.g., nearly 90% of sunflower trade and 77% of maize trade comes from countries using overexploited aquifers to produce these crops; Dalin et al., Reference Dalin, Wada, Kastner and Puma2017). Note that a limitation of this study, similarly to all global VWT studies to date, is that the trade data resolution (national scale) forces us to use national averages for the GWD content for each commodity. This means exports from one country may come from one producing region and not another (growing the same crop with a distinct GWD content), but this information is not available.
This study further highlights how GWD might affect most of the world (i.e., not only producing countries, but also importing ones) via trade linkages. With regards to future projections, this highlights that not only are there complexities in projecting where future food will be grown and how much groundwater it will consume and deplete, but also it is difficult to predict trade patterns and how possible shocks in production or prices due to groundwater exhaustion will propagate throughout the global food system (Puma et al., Reference Puma, Bose, Chon and Cook2015).
4. Conclusions and future research directions
We have highlighted key issues related to tracking groundwater use in food production and trade, discussing the complexity of both sustainability metrics for crop water use and groundwater storage and flows, and some difficulties in their estimation. Importantly, the distinct consideration of groundwater resources as a supply of irrigation water is only recently emerging in VWT studies. In addition, sustainability metrics for crop water use have also largely ignored groundwater resources so far. These two emerging avenues are particularly important to providing sound scientific support for local and global processes aiming to reach the UN Sustainable Development Goals (SDGs) by the year 2030.
We draw from this discussion three broad recommendations for future research aimed at improving the understanding, accounting and application of the sustainability of water use for food production and trade.
First, VWT and crop water use analysis should distinguish groundwater resources from other water sources given their particular characteristics, including long-term storage, slower renewal and local factors influencing management. Ideally, all water sources should be considered to account for natural coupling between them, as well as linkages with water infrastructures, including trans-basin transfers. Distinguishing different sources while considering them all allows comparison of crop water use with the availability of renewable water resources and informs on the overall sustainability of this use. VWT studies recently started to go beyond the accounting of water volumes consumed and to account for local conditions (such as climate) that affect the amount of renewable water resources available for food production in different regions. However, developing approaches for estimating water use sustainability in agriculture that account both for all water sources and for their linkages remains an important challenge for future research. In addition, information on the sub-national origin of exported food would allow more precise tracking of the sustainability of traded foods with regards to water use in the area of production (e.g., link to a specific aquifer), such as with emerging country-specific and commodity-specific datasets (e.g., Trase, 2018, as used by Flach et al., Reference Flach, Ran, Godar, Karlberg and Suavet2016). In most studies to date, national averages of VWC need to be applied to exported foods due to trade data being available at the national level only. Such analysis showing the role of trade in unsustainable water use could inform trade policy for improving the sustainability of food production and consumption.
Second, and an important barrier to the previous task, many improvements are needed for GWD estimates, including modelling, data collection and data analyses. Further evaluations of estimated groundwater abstraction for irrigation with on-site measurements are needed, as well as associated monitoring of groundwater levels. A challenge is that groundwater level is measurable, but the associated volume of storage depends upon site-specific knowledge of aquifer properties. For this reason, global estimates of aquifer storativity need to be further developed and improved (e.g., de Graaf et al., Reference de Graaf, van Beek, Gleeson, Moosdorf, Schmitz, Sutanudjaja and Bierkens2017). General policies on groundwater management and sustainability will need to be informed by scenarios of future demand and availability of water for agriculture. Strides in modelling of aquifer storage and dynamics of groundwater flows, potentially aided by the launch of the GRACE Follow-On satellite mission, will be important to inform such projections.
Third, there is a debate about the definition of sustainability indicators in terms of how to consider competing water uses such as industrial, domestic, irrigation of non-food crops (e.g., crops for feed or biofuels) and, importantly, ecological water needs. The latter is highlighted in two of the SDGs (numbers 15 and 16 on biodiversity conservation) that should be integrated with the food security (number 2) and water security (number 6) goals. Currently, commonly used values for ‘environmental flow requirements’ are mainly arbitrary, and a constant ratio of observed flow to high flow is applied uniformly across all continents. Moreover, these values are often only removed from surface runoff before comparing this (surface runoff minus environmental flow requirement) to surface water use, while there is no equivalent to compare groundwater use (i.e., there are no estimates for environmental ‘groundwater’ requirement), except for the contribution of aquifers to streamflow as in Gleeson et al. (Reference Gleeson, Wada, Bierkens and van Beek2012).
Although this review was cast in a global context, scaling up from local water management and groundwater resources to regional and continental scales remains a major challenge. Disaggregation of water sources across the scales of interest comes with varying levels of uncertainty stemming from data sources, process models and methods for extrapolating or projecting drivers in space and time. Even so, estimates are needed for management and policy decisions made for present and projected future conditions. This review did not focus on climate change and potential increases in climate variability over much of the globe. It should be noted that groundwater supplies provide a natural buffer to the relatively high-frequency variability in surface water resources and irrigation demands associated with rising temperatures and prolonged dry periods. Integrated systems models are needed to assess combined effects of changing patterns of precipitation, temperature and atmospheric carbon dioxide levels, which may increase crop water use efficiency. Applications of such process-based models at high spatial and temporal resolutions globally remain challenging.
Author ORCIDs
Carole Dalin, 0000-0002-2123-9622; Tim R. Green, 0000-0002-1441-8008.
Acknowledgements
The authors thank Marta Tuninetti for her help in reviewing indicators of water sustainability, as well as Yoshihide Wada and Landon Marston for advice on an earlier version of this manuscript. The USDA is an equal opportunity provider and employer. Mention of trade names or commercial products is solely for the purpose of providing specific information and does not imply recommendation of endorsement by the USDA.
Author contributions
C.D. designed the review with help from T.R.G. and M.T. All authors wrote the paper.
Financial support
C.D. acknowledges the funding support of the UK Natural Environment Research Council (NERC Independent Research Fellowship NE/N01524X/1). M.T. was partially supported by the Japanese Science and Technology Agency (JST) as part of the Belmont Forum.
Conflict of interest
The authors declare no conflict of interest.
Ethical standards
This research and article complies with Global Sustainability’s publishing ethics guidelines.


 Open access