


Introduction
Tef (Eragrostis tef (Zucc.) Trotter) has traditionally been an important cereal crop in Ethiopia, but it has recently received global attention particularly as a ‘healthy food’ due to the absence of gluten and gluten-like proteins in its grains (Spaenij et al., Reference Spaenij, Kooy and Koning2005). In Ethiopia, tef is the first cereal crop in terms of acreage, followed by maize and wheat. It covers an estimated area of 3.02 million ha of land (CSA, 2018). With an estimated production of 5.3 million tonnes per year, tef also ranks second following maize (CSA, 2018). Currently, the national average yield of tef is about 1.7 t ha−1 (CSA, 2018), which is far below its potential yields of 2.5 t ha−1 on farmers’ fields (Assefa et al., Reference Assefa, Chanyalew and Tadele2013). The low yields have been attributed to traditional crop management practices, land degradation and soil fertility depletion, limited use of external inputs, poor soil fertility and low soil nutrient status, especially nitrogen (N), phosphorus (P), potassium (K) and sulphur (S) as well as some micronutrients (Agegnehu et al., Reference Agegnehu, Vanbeek and Bird2014; Tesfaye et al., Reference Tesfaye, Agegnehu, Gebeyehu and Haile2004; Zeleke et al., Reference Zeleke, Agegnehu, Abera and Rashid2010), resulting from the mono cropping and excessive leaching of soil nutrients (Law-Ogbomo and Law-Ogbomo, Reference Law-Ogbomo and Law-Ogbomo2009).
A blanket recommendation of N and P fertilizer (64-20-0 kg NPK ha−1) in the form of urea and diammonium phosphate (DAP) has been used regardless of the diversity of agroecological conditions and soil types in Ethiopia. Such recommendations fail to consider differences in soil type (Sileshi et al., Reference Sileshi, Kihara, Tamene, Vanlauwe, Phiri and Jama2022), farmers resource endowment, risks (e.g., lodging, disease and climate risks) or allow for changes in input and output prices. Moreover, the nutrients in the blanket recommendation are not well-balanced, and their continued use can gradually exhaust soil nutrient reserves. As crop response declined with widespread deficiencies of nutrients other than N and P, farmers are losing interest in these fertilizer recommendations. In most Ethiopian soils, N, P, S, boron (B) and zinc (Zn) deficiencies are widespread; some soils are also deficient in K, copper (Cu), manganese (Mn) and iron (Fe) (Dibabe et al., Reference Dibabe, Bekele and Assen2007; EthioSIS, 2016). The recent soil fertility map of Ethiopia shows deficiencies of N (86% of sites), P (99%), K (7%), S (92%), B (65%) and Zn (53%) (EthioSIS, 2016). Tef is grown in diverse climatic zones and altitudes, ranging from sea level to 2800 m asl and sites with varying annual rainfall (750–850 mm) and temperature ranges of 10–27 oC (Ketema, Reference Ketema1993). Interestingly, tef can thrive well in both waterlogged and moisture-deficit conditions. As a result, it is widely grown on Vertisols (Ketema, Reference Ketema1993). Although Vertisols are good in their nutrient status, they are characterised by high clay content, which crack when dry and swell when wet (IUSS Working Group WRB, 2014).
Responses of tef to N and P have been documented in tef-growing areas of Ethiopia, but little has been done to establish yield responses to macronutrient (N, P, K and S) and micronutrient (Zn, B) and nutrient use efficiency (NUE). In agroecosystems, NUE is important for profitability and environmental sustainability. For example, cereal N use efficiency is composed of the efficiency of N uptake and the conversion of total crop N uptake to grain (Fageria and Baligar, Reference Fageria and Baligar2005). Application of excess N is normally a major cause of low NUE (Meisinger et al., Reference Meisinger, Schepers, Raun, Schepers and Raun2008), with an average recovery rate of about 38% of applied N by cereals. Crop N use efficiency may be low even with low N application rates because of limited plant growth due to biotic or abiotic constraints, including deficiencies of P and other essential nutrients (Bekunda et al., Reference Bekunda, Galloway, Syers, Scholes, Bationo, Waswa, Kihara and Kimetu2007). Low NUE can result from unsuitable fertilizer recommendations that should account for the cash limitations and risks affecting resource-poor farmers. Improving tef productivity could be achieved through optimised fertilizer use that is rationally differentiated according to agroecological zones, soil types (Sileshi et al., Reference Sileshi, Kihara, Tamene, Vanlauwe, Phiri and Jama2022) and socioeconomic circumstances of farmers. Information is scanty on the level of crop yield response to N, P, K and S under balanced fertilisation and profitability on smallholder farms in most parts of Ethiopia. Therefore, this study was conducted with the objectives of (1) quantifying tef yield response to N, P, K and S fertilizers under balanced application of macro- and micronutrients on Vertisols; (2) determining the agronomic optimum rates of each nutrient across four AEZs and (3) quantifying the agronomic use efficiency of N and P for tef.
Materials and Methods
Description of experimental sites
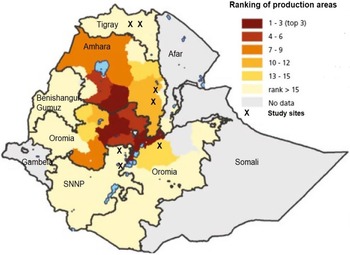
Tef is grown mainly in Amhara, Oromia, Southern Nations Nationalities and Peoples Region (SNNPR) and Tigray regions (Tadele and Hibistu, Reference Tadele and Hibistu2021). Figure 1 shows the tef growing areas ranked according to production. The study was carried out for three years (2014–2016) during the main cropping season in four districts across northern, central and southern Ethiopia. The study sites were located in Laelay Maychew district in Tigray region, Becho and Ada’a districts in Oromia region and Dalocha district in the SNNPR (Figure 1). In each district, three sites were selected, and the same set of trials were established on farmers’ fields. Farmers were selected through consultations with extension agents and scientists in the different regions. All trials were implemented on Vertisols across four agroecological zones (AEZs). The dominant soils of the study areas are Vertisols, which contain more than 40% clay in the surface horizons and close to 75% in the lower profiles. These soils are important to Ethiopian agriculture and account for 25% of all highland soils that are cropped (IUSS Working Group WRB, 2014). But their high yield potential has not been realised because of the constraints related to their physical properties and their moisture regime (Abebe, Reference Abebe1998; Finck and Venkateswarlu, Reference Finck and Venkateswarlu1982). The sites covered four agroecological zones, namely: (1) SM4 (Cool sub-moist mid highlands); (2) M3 (Tepid moist mid highlands); (3) SH3 (Tepid sub-humid mid highlands) and (4) SM3 (Tepid sub-moist mid highlands). Generally, SH3 is characterised by altitudes above 2000 m, high rainfall (>1000 mm) and higher soil organic carbon, N and exchangeable K contents than the other three AEZs (Table 1).

Figure 1. Location of the study sites in relation to the major tef production areas (adapted from Tadele and Hibistu, Reference Tadele and Hibistu2021).
Table 1. Characteristics of the study areas in the five regions of Ethiopia based on agroecological zones

Source: (MoARD, 2005).
Experimental design and treatments
On each location, seven rates of N, six rates each of P and S and eight rates of K fertilizers were established. The experiment was designed to determine the dose–response of tef to N, P, K or S individually under balanced application of the other remaining macro- and micronutrients (Zn, B). For example, for determining the response of tef to N, all other nutrients were kept constant (i.e., 30 kg P, 66 kg K, 30 kg S, 5 kg Zn and 1 kg B ha−1), and the N rate was varied as indicated in Table 2. Similarly, to determine the response of tef to P, the P rates were varied but the N, K, S, Zn and B rates were kept constant at 92 kg N, 66 kg K, 30 kg S, 5 kg Zn and 1 kg B ha−1. The response of tef to K was also determined by varying the K rates holding N, S, Zn and B rates constant at 92 kg N, 30 kg P, 30 kg S, 5 kg Zn and 1 kg B ha−1. To determine the response of tef to S, the S rates were varied but the N, P, K, Zn and B rates were held constant at 92 kg N, 30 kg P, 66 kg K, 5 kg Zn and 1 kg B ha−1 (Murphy et al., Reference Murphy1968). This design and the nutrient rates were chosen based on experience from earlier work especially the EthioSIS map (EthioSIS, 2016) and after consultations with researchers in the different regions. The EthioSIS map shows the levels of deficiencies of N, P, K, S, B and Zn in different regions. The experiment was designed in such a way that responses to N, P, K or S rates individually could be determined under balanced application of the other nutrients. Nitrogen was applied in two splits (i.e., half at planting and the remaining half at 35–45 days after planting). Full doses of P, K and S fertilizers were basal applied at planting close to the seed drilling line. In addition, B and Zn fertilizers were foliar applied. Urea, triple-superphosphate, muriate of potash (KCl), calcium sulphate (CaSO4), zinc sulphate (ZnSO4) and Borax were used as sources of N, P, K, S, Zn and B, respectively. The experiments were managed strictly following all recommended agronomic practices on a timely manner.
Table 2. Treatments and fertilizer application rates

The treatments were laid out in a randomised complete block design with three replications on each farmer’s field, and the work was done totally on 36 farmer’s field during the activity period. The spacing between rows, plots and replications was 20 cm, 1 m and 1.5 m, respectively. Tef variety (Kuncho) was used as test crop in the experiment and sown using either a manual row maker or by drilling at each row.
Data collection
Grain yield was recorded as the weight of the air-dried seeds harvested from the net plot of each plot in kg. At maturity, the whole plant, including leaves, stems, and panicles from the net plot area were harvested and after drying, the biomass was measured. Seed moisture content was measured using a gravimetric method. Total biomass (on dry matter basis) and grain yields (adjusted to a moisture content of 12.5%) were converted to kg ha−1 for statistical analysis. The total above-ground biomass yield (straw and grain) of tef is an important agronomic parameter which can be influenced by soil or applied nutrient (Mirutse et al., Reference Mirutse, Haile, Kebede, Tsegay and Yamoah2009).
Statistical analysis
Linear mixed modelling
A linear mixed modelling framework was used to determine variation in yield with the different levels of each nutrient (N, P, K and S separately) by agroecology combining study site and years. The linear mixed modelling framework (in PROC MIXED of the SAS system) was chosen for the different levels of analyses because it allows modelling of hierarchical or clustered data through inclusion of both fixed and random effects. The fixed effects in the model were agroecology, year, nutrient rate and their interaction effects; site was the random effect. The random effect was specified in such a way that data from one site are more correlated than data from another site. Some locations did not have data for some years. Therefore, the Kenward–Roger method for approximating the degrees of freedom was applied to adjust the denominator degrees of freedom (Spilke et al., Reference Spilke, Piepho and Hu2005). The initial model was of the following form:
 $$\matrix{
{Y = \;\mu + AEZ + year + rate + AEZ \times year + AEZ \times rate + year \times rate} \hfill \cr
{\quad \; + AEZ \times year \times rate + site + \varepsilon } \hfill \cr
} $$
$$\matrix{
{Y = \;\mu + AEZ + year + rate + AEZ \times year + AEZ \times rate + year \times rate} \hfill \cr
{\quad \; + AEZ \times year \times rate + site + \varepsilon } \hfill \cr
} $$
where μ is the grand mean yield (kg ha−1), AEZ is the agroecological zone, rate is the rate of application (kg ha−1) for the nutrient under study, site is the random component and ϵ is the error term. Then, the intra class correlation coefficient (ICC) was calculated as the ratio of the covariance estimate of the random effect and the covariance estimate for the residual + random effect. For each nutrient, the ICC estimates how much of the total variation in yield is accounted for by the site.
The variations in yield with fixed effects were considered significant when p ≤ 0.05. Least square estimates and their 95% confidence intervals (CI) were used for statistical inference. This is because the 95% CI functions as a very conservative test of hypothesis and it also attaches a measure of uncertainty to sample statistic (du Prel et al., Reference du Prel, Hommel, Röhring and Blettner2009). The means for two or more levels of a fixed effect were considered to be significantly different from one another only if their 95% CI were non-overlapping.
Dose–response modelling
To determine the agronomic optimum rate of the nutrient in question, nutrient response functions were compared and used as deemed appropriate. When determining the response to one nutrient, all other nutrients were kept constant. For example, when determining the response to N, all other nutrients were kept constant and only N rates were varied. The relative performances of the models were established through examination of the omnibus test, the significance of model coefficients and the goodness-of-fit statistics especially the Akaike information criterion as recommended by (Sileshi, Reference Sileshi2021). Based on preliminary analyses, the asymptotic function was deemed adequate to determine N and P response. The asymptotic function is given as yield (Y): Y = a–bc x , where a is yield at the plateau (i.e., expected maximum), b is the amplitude (gain in yield due to nutrient application), c is a curvature coefficient and X is the nutrient rate applied. The least square estimates of yield from the linear mixed models were used in all dose-response modelling.
Estimating agronomic efficiency (AE)
The third step of analyses quantified the agronomic efficiency (AE) of N (AEN), P (AEP), K (AEK) and S (AES) inn each AEZ. Agronomic efficiency is the amount of additional yield obtained for each additional kilogram of nutrient applied (Agegnehu et al., Reference Agegnehu, Nelson and Bird2016; Fageria and Baligar, Reference Fageria and Baligar2005). AE is an integrated index of fertilizer nutrient recovery efficiency and physiological use efficiency. Therefore, it closely reflects the impact of the applied nutrient. Here, AEN, AEP, AEK and AES were computed as
 $$AE = {{G{Y_{f - }}G{Y_u}} \over Q}$$
where GYf is the grain yield of the fertilized plot (in kg ha−1), GYu is the grain yield (in kg ha−1) of the plot where the nutrient in question was omitted and Q is the quantity of N, P, K or S applied (kg ha−1).
Results
Variations in grain yield and total biomass with N rates
Tef grain yield and total biomass significantly (p < 0.05) varied with year, N application rates and the various interaction effects (Table 3; Supplementary Table S1–S3). The interclass correlation coefficient (ICC) indicated that 28.5% of the variation in grain yield was associated with site (Supplementary Table S1). The highest tef grain yields recorded in SM4, M3, SH3 and SM3 were 1.6, 2.2, 1.4 and 1.6 t ha−1 at application of 138, 92, 115 and 69 kg N ha−1, respectively (Table 3). The corresponding yield increments were 62, 92, 26 and 24% over the control without N application.
Table 3. Tef grain yield response to N, P, K and S in the different agroecological zones of Ethiopia

Agroecological zones: SM4 (Cool sub-moist mid highlands), M3 (Tepid moist mid highlands), SH3 (Tepid sub-humid mid highlands) and SM3 (Tepid sub-moist mid highlands).
Total above-ground biomass significantly (p < 0.05) increased with increase in N application rates (Supplementary Table S3). The highest total biomass yields of 8.1 t ha−1 was obtained with 69 kg N ha−1 in SM3 and M3. In SM4 and SH3, the highest total biomass yields were achieved with 115 kg N ha-1 (Supplementary Table S3). The harvest index declined with increasing N rates exceeded 46 kg ha−1 except in M3 (Supplementary Figure S1).
Using nutrient dose–response functions, the agronomic maximum yields (i.e., asymptotic yields) due to N application rates were estimated at 1.8 t ha−1 in SM4, 2.2 t ha−1 in M3, 1.5 t ha−1 in SH3 and 1.7 t ha−1 in SM3. The N rates that achieve the asymptotic yields were estimated at 69 kg N ha−1 in SM4, SM3 and SH3 but 92 kg N ha−1 in M3 (Figure 2a–d; Table 4). The highest gain in yield due to N application (i.e., amplitude) was 1.1 kg ha−1 recorded in M3, followed by 0.7 kg ha−1 in SM4, 0.5 kg ha−1 in SH3 and 0.4 kg ha−1 in SM3 (Table 4). The agronomic optimum N rate increased grain yields by 22–126% over the no input control, with the highest increase being in M3. The agronomic optimum N rate also yielded 2-4% higher than the currently recommended NP fertilizer in all AEZs except SH3 (Supplementary Table S2).

Figure 2. Grain yield response of tef to increasing N, P, K and S rates on Vertisols in the different agroecological zones. Circles and solid black lines represent the measured and fitted values, respectively. Dashed grey lines represent the 95% confidence intervals. Agroecological zones are SM4 (Cool sub-moist mid highlands), M3 (Tepid moist mid highlands), SH3 (Tepid sub-humid mid highlands) and SM3 (Tepid sub-moist mid highlands).
Table 4. Predicted maximum yields (kg ha−1), amplitudes (kg ha−1) and the agronomical optimum nutrient rate (kg ha−1) using the asymptotic dose–response model

Agroecological zones: SM4 (Cool sub-moist mid highlands), M3 (Tepid moist mid highlands), SH3 (Tepid sub-humid mid highlands) and SM3 (Tepid sub-moist mid highlands).
Variations in grain yield and total biomass with P rates
Grain yield and total biomass significantly (p < 0.05) varied with year, P rates and some of the interaction effects (Table 3; Supplementary Table S1–S3). In all AEZs, the lowest grain yield was recorded in the P omission treatment (Table 3; Figure 2e–h). Lower grain yields were recorded in SH3 than in the other AEZs. Generally, higher grain yields due to P application were recorded in M3 compared to the other AEZs (Table 3). The increase in total biomass was also consistent with P rates (Supplementary Table S3). As in N, the harvest index showed a decreasing trend with increasing P rate in SM4 and SH3, but the opposite trend in M3 (Supplementary Figure S1).
Using nutrient response functions, the asymptotic yields with P application were estimated at 1.4, 2.4, 1.9 and 1.3 t ha−1 in SM4, M3, SH3 and SM3, respectively (Table 4). The P rates that achieve the asymptotic yields were estimated at 20 kg P ha−1 in SM4 and SH3 but 30 and 10 kg P ha−1 in M3 and SM3 (Figure 2; Table 4). The gain in yield due to P application was estimated at 0.6 kg ha−1 in M3, 0.9 kg ha−1 in SH3, but the gain in SM4 and SM3 was not significantly different from zero (Table 4). The agronomic optimum P rate increased grain yields by 26–190% over the no input control (Supplementary Table S2). The agronomic optimum P rate also yielded 6–10% higher than the currently recommended NP fertilizer in all AEZs except SH3.
Variations in grain yield and total biomass with K rates
The highest grain yields were recorded at 90 and 75 kg K ha−1 in SM4 and M3, respectively, and at 30 and 60 kg K ha−1 in SH3 and SM3, respectively, with the corresponding yield increases of 300, 9, 18 and 25%, as compared with the control without K application (Table 3). There were no clear trends in yield response with K application rates. Parameters of the response functions could also not be estimated due to the erratic yield responses to the K rates in all AEZs except SM4 (Table 3). The highest total biomass yields were recorded at 108 K kg ha−1 in SM4 and SM3, whereas in M3 the highest total biomass was obtained from application of 105 kg K ha−1 (Table 4). However, in SH3 biomass estimates were highly variable and very large uncertainty was revealed by the 95% CI (i.e., both negative and positive estimates). The agronomic optimum K rate increased grain yields by 31–162% over the no input control in M3, SH3 and SM3 (Supplementary Table S2). The agronomic optimum K rate also yielded 1.4–1.8% higher than the currently recommended NP fertilizer in all AEZs.
Variations in grain yield and total biomass with S rates
As in K, the grain and biomass yields recorded with the different S rates did not show clear trends in the different AEZs (Table 3). Negligible yield increase was observed due to the application of S in different AEZs; lower yields were observed in SH3 and SM3 with S application as compared with the control (i.e., without S application). Parameters of the response functions could also not be estimated due to the erratic yield responses to the S rates in all AEZs (Table 3). In all AEZs, the agronomic optimum rate was provisionally estimated at 10 kg S ha− 1.
Agronomic nutrient use efficiency
Across the different N rates, AEN was highest in SM4 followed by M3 and the lowest was recorded in SH3 (Figure 3). The highest AEP was recorded in M3 followed by SH3, while the lowest was recorded in SM4. Both AEN and AEP showed a decreasing trend with increasing N and P rates in all AEZs (Figure 3). The decline in AEN was steeper in SM3 than in the other AEZs, whereas AEP showed steeper decline in SM3 than the other AEZs (Figure 3).

Figure 3. Trends in agronomic efficiency of N, P, K and S on Vertisols in different agroecological zones. Agroecological zones are Agroecological zones: SM4 (Cool sub-moist mid highlands), M3 (Tepid moist mid highlands), SH3 (Tepid sub-humid mid highlands) and SM3 (Tepid sub-moist mid highlands).
Discussion
The results show that N application increases grain and total biomass yield up to a certain rate beyond which a plateau is reached. Increasing tef straw yield is equally important as increasing grain yield because straw is a valuable source of animal feed, plastering houses and cash income for farmers (Bayable et al., Reference Bayable, Tsunekawa, Haregeweyn, Alemayehu, Tsuji, Tsubo, Adgo, Tassew, Ishii, Asaregew and Masunaga2021; Dereje et al., Reference Dereje, Alemu, Adisu and Anbessa2018). However, the harvest index was reduced at higher N rates indicating greater allocation to straw at the expense of grains in some conditions. At higher N rates yields were also reduced. This is probably due to lodging, which might have been caused by excessive N at the higher rates. Tef is very sensitive to lodging because of high soil N or high external N application. Generally, tef harvest index is lower than other small grain cereals (Ekero et al. Reference Ekero, Haile, Lelago and Bibiso2021).
The optimal N rates for tef production in SM4, M3, SH3 and SM3 were found to be 69, 92, 46 and 46 kg N ha−1 (Table 3). A lower yield response to N applications, for example in SH3, might be due to poorer drainage and prolonged waterlogging that is characteristic of Vertisols. Application of 46 kg N and 10 kg P ha−1 was found to be the most economical fertilizer rates for tef production, as compared with other treatments (Dereje et al., Reference Dereje, Alemu, Adisu and Anbessa2018).
Although the yield increase with P rates was not the same across AEZs (Table 3), responses significantly differed among years. Productivity of cereal crops is widely limited by the availability of P in the soil, whereas the most important factors controlling the availability of P to plant roots are its concentration in the soil solution and the P-buffer capacity of the soil. Suboptimal P nutrition may lead to yield losses in the range of 10–15% of the maximal yields (Shenoy and Kalagudi, Reference Shenoy and Kalagudi2005). In general, the yield increase in response to P rate under balanced fertilisation could be due to the facilitated uptake of other essential nutrients which might help to boost plant growth and yield. The application of P ensures the utilisation of N and storage of carbohydrates in roots, thus improving NUE (Mengel et al., Reference Mengel, Secer and Koch1981). We were unable to analyse the effect of nutrient interactions on use efficiency because the design of the experiment did not allow us to do so. We recommend future studies to examine these interactions using factorial combinations of nutrients and nutrient rates. Based on the response curves, application of 10 and 30 kg P ha−1 could be the optimum rates in SM4 and M3, respectively, and 20 kg P ha−1 in SH3 and SM3. This is in agreement with the findings of similar studies on Vertisols for tef (Mirutse et al., Reference Mirutse, Haile, Kebede, Tsegay and Yamoah2009; Tamiru et al., Reference Tamiru, Kassa, Abera, Agegnehu, Gurumu, Abera and Muleta2018). According to Berhe et al. (Reference Berhe, Gebretsadik, Edwards and Araya2013), grain yield of tef could be increased by 50% under balanced fertilizers, in contrast to the yield obtained from the use of N and P fertilizer only.
The results are in agreement with the work of Assefa et al. (Reference Assefa, Tana and Abdulahi2016), who found that application of 20 kg P ha−1 increased biomass yield from 2.2 t ha−1 to 5.3 t ha−1. The increasing trend observed in biomass yields could be attributed to the availability of balanced macro- and micronutrients, which may have resulted in increased and proportional vegetative growth, especially plant height.
Application of K fertilizer at different rates did not show clear trends in both grain yield and total biomass across AEZs. This is probably because the soils have sufficient concentration of K (Murphy, Reference Murphy1968). This result is in agreement with the findings of Dawit and Reed (Reference Dawit and Reed2002). In contrast, Misskire et al. (Reference Misskire, Mamo, Taddesse and Yermiyahu2019) reported that application of 100 kg KCl ha−1 increased total dry matter and grain yield of tef significantly. The asymptotic nonlinear regression did not fit the yield response K and S in all AEZs. Despite the lack of insignificant yield responses to K rates on Vertisols, however, it is suggested that application of the minimum rate of 15 kg K ha−1 could be desirable to maintain soil K reserve for sustainable crop production. When K levels in soil and plant are adequate, it plays an important role in NO3 – translocation from root to shoot as an accompanying counter (Marschner et al., Reference Marschner, Kirkby and Engels1997). Adequate level of K is also known to play a key role in plant tolerance to biotic and abiotic stresses, including diseases, pests, drought and salinity (Wang et al. Reference Wang, Zheng, Shen and Guo2013).
In this study, grain yield and total biomass of tef did not significantly differ with S application rates across the different AEZs. The dose–response curves also did not show any clear pattern for S in SM3-AEZ. Itanna (Reference Itanna2005) reported that all soil types other than Nitisols, Andosols and Vertisols contain soluble S in adequate amount for crop production in Ethiopia. Previous studies indicate that land degradation, removal of crop residues, crop uptake and use of non-S fertilizers are major causes of S deficiency (Dibabe et al., Reference Dibabe, Bekele and Assen2007; Itanna, Reference Itanna2005). The findings of Weil and Mughogho (Reference Weil and Mughogho2000) showed that failure to supply S in the form of artificial fertilizers contributes to S deficiency in Africa. K and S may not be limiting currently, but if not applied at all they may eventually become limiting in the long-run especially is their uptake increases due to lower N and P limitations. Thus, based on soil status, application of K and S at the minimum rates of 15 kg K ha−1 and 10 kg S ha−1 may be important to maintain soil K and S levels.
High agronomic efficiency could be obtained if the yield increment per unit applied N is high because of reduced losses, increased N recovery and uptake (Ruisi et al., Reference Ruisi, Frangipane, Amato, Frenda, Plaia, Giambalvo and Saia2015). The AEN recorded with application of 46 and 92 kg N ha−1 was in the range commonly reported (0–31 kg increase kg−1 N) in previous studies (Gezahegn et al., Reference Gezahegn, Eshetu, Tafes and Feleke2021; Giday et al., Reference Giday, Gibrekidan and Berhe2014). The low AEN recorded at higher N rates could be explained by the fact that addition of N fertilizer on initial high soil N content may have resulted in high biomass accumulation but low grain yield. In this study, AEN decreased with the increase in N rates in all AEZs. This indicates a more efficient use of N by tef at lower rates than higher rates of N application under balanced fertilisation. Dargie et al. (Reference Dargie, Wogi and Kidanu2018) showed that the AEN decreased with increased rates of N on Vertisols and Cambisols. Other studies also reported the decrease in AEN for cereals with increased N levels (Agegnehu et al., Reference Agegnehu, Nelson and Bird2016; Fageria and Baligar, Reference Fageria and Baligar2005). Tarekegne and Tanner (Reference Tarekegne and Tanner2001) reported agronomic efficiency of 12.6–29 kg wheat grain increase kg−1 applied N and recovery efficiency of 32–56% on a Vertisols. An increase in the rate of N application usually decreases the agronomic and recovery efficiency of N in cereal (Agegnehu et al., Reference Agegnehu, Nelson and Bird2016; Raun et al., Reference Raun, Solie, Johnson, Stone, Mullen, Freeman, Thomason and Lukina2002).
Improving the efficiency of P fertilizer use for crop growth requires enhanced P acquisition by plants from the soil and increased use of P in processes that lead to faster growth and better allocation of biomass to the harvestable parts (Veneklaas et al., Reference Veneklaas, Lambers, Bragg, Finnegan, Lovelock, Plaxton, Price, Scheible, Shane and White2012). AEP showed a decreasing trend with increasing P fertilizer rates in all AEZs, although the trend in the AEP decline in SH3 was slighter than in other AEZs. In this study, effects of the treatments on AEP were consistent with the findings of previous studies (Tarekegne and Tanner, Reference Tarekegne and Tanner2001). The seemingly very low values of AEP in SM4 and SH3 could be attributed to nutrient imbalances or very low level of soil P concentration at the lowest P rate. One of the causes of the current stagnating yield levels is the deficiency or imbalance of nutrients (Rietra et al., Reference Rietra, Heinen, Dimkpa and Bindraban2017). Large P supply often results in high uptake of P and raises the ratio of P to Fe and Zn in plant tissues, resulting in deficiencies of Fe and Zn. Consequently, the AEP of tef could be reduced, as compared with the control without P fertilizer.
Conclusion
Evidently, the most limiting nutrients are N and P in each agroecological zone. It is concluded that tef grain yield and total biomass are significantly increased by N and P application rates in all AEZ. It is also concluded that responses to K are much more site-specific than response to N, P or S. Increasing application rates of K and S above the minimum did not significantly increase yields or biomass in all AEZs. Therefore, application of the lowest levels of both K and S fertilizers is recommended as maintenance strategy. It is also concluded that the optimum rates for tef production are 69 kg N, 20 kg P, 30 kg K and 10 kg S ha−1 in the cool sub-moist mid-highlands and the tepid sub-humid mid highlands; 92 kg N, 30 kg P, 15 kg K and 10 kg S ha−1 in tepid moist mid highlands; but 69 kg N, 10 kg P, 15 kg K and 10 kg S ha−1 in the tepid sub-moist mid highlands. However, further study is required on the nutrient requirement of tef to evaluate the technical and economic efficiencies on other soil types in different agroecological conditions. One of the limitations of this study is the lack of data on nutrient uptake, which is critical for disentangling nutrient-use efficiencies and provide more insights into the variations in response. We recommend further research on nutrient uptake on different soils in the major tef growing areas.
Supplementary material
For supplementary material accompanying this paper visit https://doi.org/10.1017/S0014479722000114
Acknowledgements
The authors thank the Ethiopian Institute of Agricultural Research, Oromia, Amhara, and Tigray Research Institutes for funding this research and generating data. We greatly appreciate the International Center for Tropical Agriculture and Deutsche Gesellschaft für Internationale Zusammenarbeit for organising the data and facilitating and financing the preparation of this manuscript.
Funding Support
Financial support for this work came from the Ethiopian Institute of Agricultural Research, Oromia, Amhara and Tigray Research Institutes and the Deutsche Gesellschaft für Internationale Zusammenarbeit. This work was supported, in whole or in part, by the Bill & Melinda Gates Foundation [INV-005460]. Under the grant conditions of the Foundation, a Creative Commons Attribution 4.0 Generic License has already been assigned to the Author Accepted Manuscript version that might arise from this submission.
Conflicts of Interest
None.


 Open access