


Introduction
Strong evidence supports the high frequency of contrapolar symptoms in patients suffering from a major depressive episode (MDE) [Reference McIntyre, Soczynska, Cha, Woldeyohannes, Dale and Alsuwaidan1–Reference Goldberg, Perlis, Bowden, Thase, Miklowitz and Marangell3]. In a recent systematic review, the presence of three or more (hypo)manic symptoms in unipolar and bipolar depression is reported to range from 23 to 35%, respectively [Reference Vázquez, Lolich, Cabrera, Jokic, Kolar and Tondo4]. These percentages are significantly increased when a lower number of symptoms is considered [Reference Kim, Kim, Citrome, Akiskal, Goffin and Miller5–Reference Angst, Gamma, Benazzi, Ajdacic, Eich and Rossler7]. Yet, despite its clinical relevance, subthreshold hypomania in patients with an ongoing MDE poses several issues in terms of psychopathological characterization, classification, diagnosis, and treatment [Reference Leite, Salgado, Olga and Carvalho8, Reference McElroy, Guerdjikova and Romo-Nava9]. In 2013, the Diagnostic and Statistical Manual for Mental Disorders, Fifth Edition (DSM-5) [10] introduced the “with mixed features specifier” (MFS), applicable to manic, hypomanic and MDEs, both in bipolar disorder (BD) type I and II and in Major Depressive Disorder (MDD). This substantive update was meant to replace the DSM, Fourth Edition, Text Revision (DSM-IV TR) [11] narrow diagnostic category of “Mixed Episode,” providing clinicians with more sensitive criteria, able to address the highly prevalent subsyndromal presentations of mixed states [Reference Vieta and Valenti12, Reference Weibel and Bertschy13]. Furthermore, the fulfillment of the MFS criteria in MDD was expressly indicated by the DSM-5 as a risk factor for the development of BD type I and II, warning clinicians about the need for a clinical evaluation over time, also in the perspective of a potential diagnostic transition. Consequently, the addition of the MFS to MDD was interpreted as a theoretical structural bridge between MDD and BD, positing a more spectrum-oriented approach to mood disorders [Reference Weibel and Bertschy14, Reference Sole, Garriga, Valenti and Vieta15], coherent with the DSM-5 overarching principle of closer integration between the categorical and dimensional model [Reference Sampogna, Del Vecchio, Giallonardo, Luciano, Perris and Saviano16].
Nevertheless, this nosologic change was judged to be controversial by several authors and much of the criticism focused on the diagnostic subtype of the MDE “with mixed features”. Indeed, the threshold number of symptoms was deemed arbitrary, as was the choice to retain as mixed features only those manifestations belonging to the manic polarity, and excluding the so-called “overlapping symptoms” such as irritability, psychomotor agitation, and distractibility [Reference Koukopoulos and Sani17–Reference Kim and Liberal19]. As remarked by several psychopathologists, the DSM neo-Leonhardian taxonomy of mood disorders, based on polarity (depression and mania as extreme poles of a bipolar dichotomy) rather than on the course and recurrence of the episode, constitutes a theoretical model, per se, unsuitable to offer a diagnostic prototype that would properly target the complexity of mixedness in the real-world clinical setting [Reference Malhi, Fritz, Elangovan and Irwin20–Reference Sani and Swann22].
Starting from a lifetime spectrum approach to mood disorders as opposed to the rigid dichotomic DSM classification category, researchers of the Spectrum Project Collaborative Group developed a self-report tool (Mood Spectrum Self-Report [MOODS-SR]) that is functional for a dimensional model-based evaluation of mood episodes. This tool factorizes affective symptomatology into distinct domains (mood, energy, cognition, and rhythmicity), considering subthreshold-level manifestations of unipolar and bipolar mood psychopathology [Reference Fagiolini, Dell’osso, Pini, Armani, Bouanani and Rucci23, Reference Dell’Osso, Armani, Rucci, Frank, Fagiolini and Corretti24]. Similarly, Malhi et al. proposed the so-called Activity Cognition Emotion (ACE) model, which deconstructs any mood episodes into three main components, describing mixed states as the product of nonsimultaneous changes in these domains [Reference Malhi, Irwin, Hamilton, Morris, Boyce and Mulder25], reprising the early Kraepelinian classification [Reference Fagiolini and Cuomo26, Reference Kraepelin27]. Far from being a mere speculative issue, the availability of a valid nosologic framework, accounting for subthreshold hypomania, is fraught with several implications at different levels, including diagnostic recognition, treatment strategy, and research direction [Reference Malhi, Byrow, Outhred and Fritz28–Reference Marcinko and Vuksan-Cusa30]. Indeed, the unavailability of shared operational criteria has also been a limitation for studies aimed at exploring the neurobiological underpinnings of mixed depression. The vast majority of findings on altered monoaminergic function, hypothalamic–pituitary–adrenal (HPA) axis dysfunction, hyperinflammation, and circadian dysregulation in mixed states are derived from research focused on mixed mania [Reference Simonetti, Lijffijt and Swann31]. Therefore, the applicability of the aforementioned pathophysiological mechanisms to mixed depression is purely conjectural.
The present study aimed to identify distinct subgroups using a cross-diagnostic cluster analysis, based on the exploration of mood symptoms, according to a spectrum approach within a cohort of patients admitted with current unipolar and bipolar depression. Cluster analysis is a statistical technique that identifies subgroups as defined by selected features and whose application to heterogeneous and multidimensional disorders, such as MDD, may help to deconstruct disease complexity, contribute to the development and validation of diagnostic criteria, and support tailored treatment plans [Reference Windgassen, Moss-Morris, Goldsmith and Chalder32].
After identifying different clusters, we evaluated how cluster membership could be related to diagnostic categories and clinical and psychopathologic factors, hypothesizing that the degree of contrapolar symptomatology may be related to a more severe clinical phenotype of MDE.
Methods
Sample
A post hoc cluster analysis was performed on a data set derived from a multicenter cross-sectional study, conducted in three Italian University Hospitals (Siena, Catania, and Turin). The sample consisted of 300 adult individuals with a previously established DSM-5 diagnosis of either MDD or BD. The patients were recruited during their hospital stay, after being informed about the study focus and its voluntary nature. Clear assurance of confidentiality, anonymity, and absence of clinical management implications was also provided. Inclusion criteria were: (a) age >18 years at entry of the study, (b) current diagnosis of a MDE, confirmed by the Mini International Neuropsychiatric Interview (MINI) for DSM IV-TR [11], and (c) ability and willingness to sign a written informed consent. The exclusion criteria comprised a current or past diagnosis of any schizophrenia spectrum disorder, organic psychiatric disorder, major neurocognitive disorder, intellectual disability, or any other neurological condition that may have interfered with the comprehensive evaluation of the patient. It was also required that patients had not received any major pharmacotherapy changes in the last 3 weeks. Each center enrolled 100 patients. The Institutional Review Boards at the Universities of Siena, Catania, and Turin reviewed and approved all the study procedures. The data were collected in compliance with the current version of the Helsinki Declaration and were obtained after written informed consent was received. The complete data set is available from the authors upon request.
Assessment
A comprehensive psychiatric diagnostic assessment was conducted using the MINI, while sociodemographic and additional clinical characteristics were collected utilizing a semi-structured interview, used in two previously published studies [Reference Aguglia, Cuomo, Amerio, Bolognesi, Di Salvo and Fusar-Poli33, Reference Cuomo, Aguglia, Aguglia, Bolognesi, Goracci and Maina34]. Patients were also assessed using the Barratt Impulsiveness Scale (BIS-11) [Reference Patton, Stanford and Barratt35, Reference Fossati, Di Ceglie, Acquarini and Barratt36], the Short Form 12-Item Health Survey (SF-12) [Reference Ware, Kosinski and Keller37], the Sheehan Disability scale (SDS) [Reference Sheehan and Sheehan38], the Clinical Global Impression-Severity scale (CGI-S) [Reference Busner and Targum39], and the Seasonal Pattern Questionnaire Assessment (SPAQ) [Reference Raheja, King and Thompson40].
A dimensional evaluation of the current MDE was carried out by completing the last-month version of the MOODS-Self Report (MOODS-SR), developed from the Structured Clinical Interview for Mood Spectrum (SCI-MOODS) [Reference Malhi, Irwin, Hamilton, Morris, Boyce and Mulder25]. It is a psychometrically robust questionnaire, specifically structured for a dimensional assessment of mood episode phenomenology. It consists of 161 items, coded as present or absent, for a span of at least 3–5 days over the past month and organized into three depressive and three (hypo)manic domains. MOODS-SR items are targeted at examining energy levels, cognitive features, and affective symptoms, including signs and subthreshold manifestations of mood dysregulation. An adjunctive domain assesses disturbances and rhythmic changes in neurovegetative functions. The MOODS-SR was shown to be reliable with a substantial agreement between the self-report and the interview formats, as expressed by intraclass correlation coefficients (ICC) ranging from 0.88 to 0.97 [Reference Dell’Osso, Armani, Rucci, Frank, Fagiolini and Corretti24].
The internal structure of MOODS-SR was further divided into six depressive factors (depressive mood, psychomotor retardation, suicidality, drug illness-related depression, psychotic features, and neurovegetative symptoms) and five manic factors (psychomotor activation, mixed instability, spirituality/mysticism/psychoticism, mixed irritability, and euphoria), identified by subsequent factorial analyses studies [Reference Cassano, Benvenuti, Miniati, Calugi, Mula and Maggi41, Reference Cassano, Mula, Rucci, Miniati, Frank and Kupfer42]. The domain and factor scores were obtained as a count of the specific MOODS-SR items endorsed. The scoring procedures are described in detail at www.spectrum-project.org and in the cited papers [Reference Cassano, Benvenuti, Miniati, Calugi, Mula and Maggi41, Reference Cassano, Mula, Rucci, Miniati, Frank and Kupfer42].
Statistical analyses
Descriptive statistics were reported as frequencies and percentages for categorical variables and as a mean and standard deviation for continuous variables with a normal distribution; nonnormal variables were reported as mean, median, and interquartile range (IQR). For each variable, the normality of the distribution was tested using a Shapiro–Wilk test. A Spearman’s correlation test was used to determine the correlation between the number of depressive and the number of (hypo)manic items in the total sample and the two main diagnostic groups.
In this study, we carried out a k-means cluster analysis based on the scores of the six MOODS-SR depressive and (hypo)manic domains.
The optimal number of clusters was determined using the NbClust package [Reference Charrad, Ghazzali, Boiteau and Niknafs43] implemented in the R software. The NbClust package allows for the comparison of 30 distinct clustering validity indices and recommends the best solution according to a majority rule, that is, the optimal number of clusters is the one supported by the relative majority of the cluster validity indices. The search for the optimal number of clusters was a priori set between one and five, with three being selected as the optimal number of clusters. After the clusters were formed, an initial set of one-way analyses was performed to verify whether the distribution of a group of sociodemographic and clinical variables differed among the clusters. The variables that were tested included: gender, age, age at disorder onset, primary diagnosis (BD vs. MDD), DSM-5-MFS diagnosis, Koukopoulos Mixed Depression (KMxD) diagnosis [Reference Sani, Vohringer, Barroilhet, Koukopoulos and Ghaemi44], current psychotic ideation, current suicidal ideation, lifetime hospitalizations, lifetime suicide attempts, comorbidity of any anxiety disorders, substance use disorders, cluster A, cluster B, and cluster C personality disorders, family history of mood disorders, CGI-S score, BIS-11 total score, SDS total score, SPAQ total score, SF-12 Physical Component Summary (SF-12-PCS) score, and SF-12 Mental Component Summary (SF-12-MCS) score. The assessment of DSM-5-MFS and KMxD criteria was carried out through the analysis of clinical records and by using proxy criteria derived from H.D.R.S., Y.M.R.S., and M.I.N.I. items. This reviewing procedure was independently conducted by three trained adult psychiatrists with a substantial experience in the field of mood disorders. The overall mean percentage agreement was 88.50% (range, 82–100%). We also assessed if there were significant intercluster differences in the scores of the internal depressive and (hypo)manic MOODS-SR factors.
The differences between the clusters were verified with suitable one-way analyses (ANOVA, Kruskall Wallis, and chi-square tests), depending on the normal/nonnormal distribution of the variables. If significant intergroup differences were detected, we performed appropriate pairwise post hoc comparisons, adjusted for multiple comparisons (post hoc analysis with Tukey’s adjustment). Finally, a subset of variables (i.e., the ones proven to significantly differ between the Mixed and the Moderate clusters, and also “suicidal ideation”) were modeled as outcomes of generalized linear models (GLMs) (logistic, Poisson or normal, depending on the distribution of the outcome), while the MOODS-SR factors represented the assumed predictors.
The coefficients of the GLM were estimated using elastic-net penalty regularization. The H2O R package [Reference Nykodym, Kraljevic, Hussami, Rao and Wang45] was used to fit the logistic regression with the elastic-net penalty. The elastic-net technique optimally combines two penalties on the coefficients being estimated, the Least Absolute Shrinkage and Selection Operator (LASSO) (L1) and the Ridge (L2). Both penalties mitigate the impact of nonrelevant or collinear predictors, by shrinking their coefficients toward zero in the estimation process. This provides a more robust and direct identification of relevant variables, compared to the iterated stepwise approach based on classical regression inference. Thus, under the elastic net method, relevant predictors are indicated by an absolute coefficient greater than 0, instead of by a p-value under the significance threshold used in the classical inferential approach. Finally, the GLM performance measures, that is, area under the ROC curve (AUC), R squared (R 2) and Akaike’s information criterion (AIC) were estimated using 10-fold cross-validation to avoid overfitting, considering the relatively limited sample size.
All statistical analyses were performed using the R Statistical software [46] and associated specific R packages like Emmeans [Reference Russell47] and DescTools [48]. The H2O R package [Reference Nykodym, Kraljevic, Hussami, Rao and Wang45] was used to fit the logistic regression with the Elastic net penalty. Statistical significance was assessed by using a 5% threshold except for the Elastic net regression analysis.
Results
Characteristics of the total sample
The sample consisted of 300 patients of which 155 (51.7%) had a primary diagnosis of MDD while 145 (48.3%) were affected by BD. Females represented 60.7% of the sample while the mean age was 50.1 (14.7). DSM-5 threshold criteria for MFS were met only by 44 subjects (14.7%), while 165 qualified for the KMxD diagnosis. The mean (median) number and {IQR} of the depressive MOOD-SR items endorsed by the patients with MDD and by the patients with BD were 33.65 (36) {18} and 38.28 (40) {17} respectively, whereas, the mean (median) number and {IQR} of the manic MOOD-SR items experienced by unipolar and bipolar patients were 8.61 (6) {12} and 12.76 (11) {12}, respectively.
The Spearman’s rank correlation test showed a weak positive correlation between total depressive and total manic MOODS-SR component scores within the total sample (p = 0.292; p < 0.001) and also within both main diagnostic groups (MDD: p = 0.299; p < 0.001; BD: 0.224; p < 0.05). The characteristics of the total sample are reported in Table 1.
Table 1. Sociodemographic and clinical characteristics of the sample.

Cluster analysis
Thirteen out of the 30 validity indices implemented in the NbClust package selected a three-cluster solution, which was therefore adopted as the optimal clustering fit. The number of patients in cluster one (n = 98), two (n = 158), and three (n = 44) accounted for 32.7, 52.7, and 14.6% of the total sample, respectively. After comparing the cumulative scores of the depressive and (hypo)manic MOODS-SR domains for each of the three clusters and the trend of the severity-illness related measures across them, they were labeled as Mild (cluster 1), Moderate (cluster 2), and Mixed (cluster 3) (see Figure 1). Indeed, we were able to detect a group characterized by intermediate levels of depressive symptoms and low levels of (hypo)manic symptoms (Mild cluster), a group with high levels of depressive symptoms and intermediate levels of (hypo)manic symptoms (Mixed cluster) and a large group (Moderate cluster) with depressive and manic symptomatology levels overlapping with those recorded for the Mixed and Mild cluster, respectively.

Figure 1. Radar chart representing the distribution of the MOODS-SR domains across the three clusters.
A significant main group effect was observed on all scores of the MOODS-SR domains and post hoc tests were run to determine the pairwise differences (see Table 2 for numerical results and Figures 1 and 2 for graphical representations). The Mild cluster was significantly lower than Mixed on all domains and was also significantly lower than Moderate on all domains, except for “cognition manic.” The Mixed cluster was significantly higher than Moderate on all domains, except “mood depressive,” “energy depressive,” and “rhythmicity.” The Mixed and Moderate clusters had similar total average scores in depressive domains, being both significantly higher than Mild. On the other hand, the total average scores of the Mild and Moderate clusters on (hypo)manic domains did not differ significantly but both were significantly lower than Mixed.
Table 2. Comparison between the clusters in MOODS-SR domains and MOODS-SR factors.

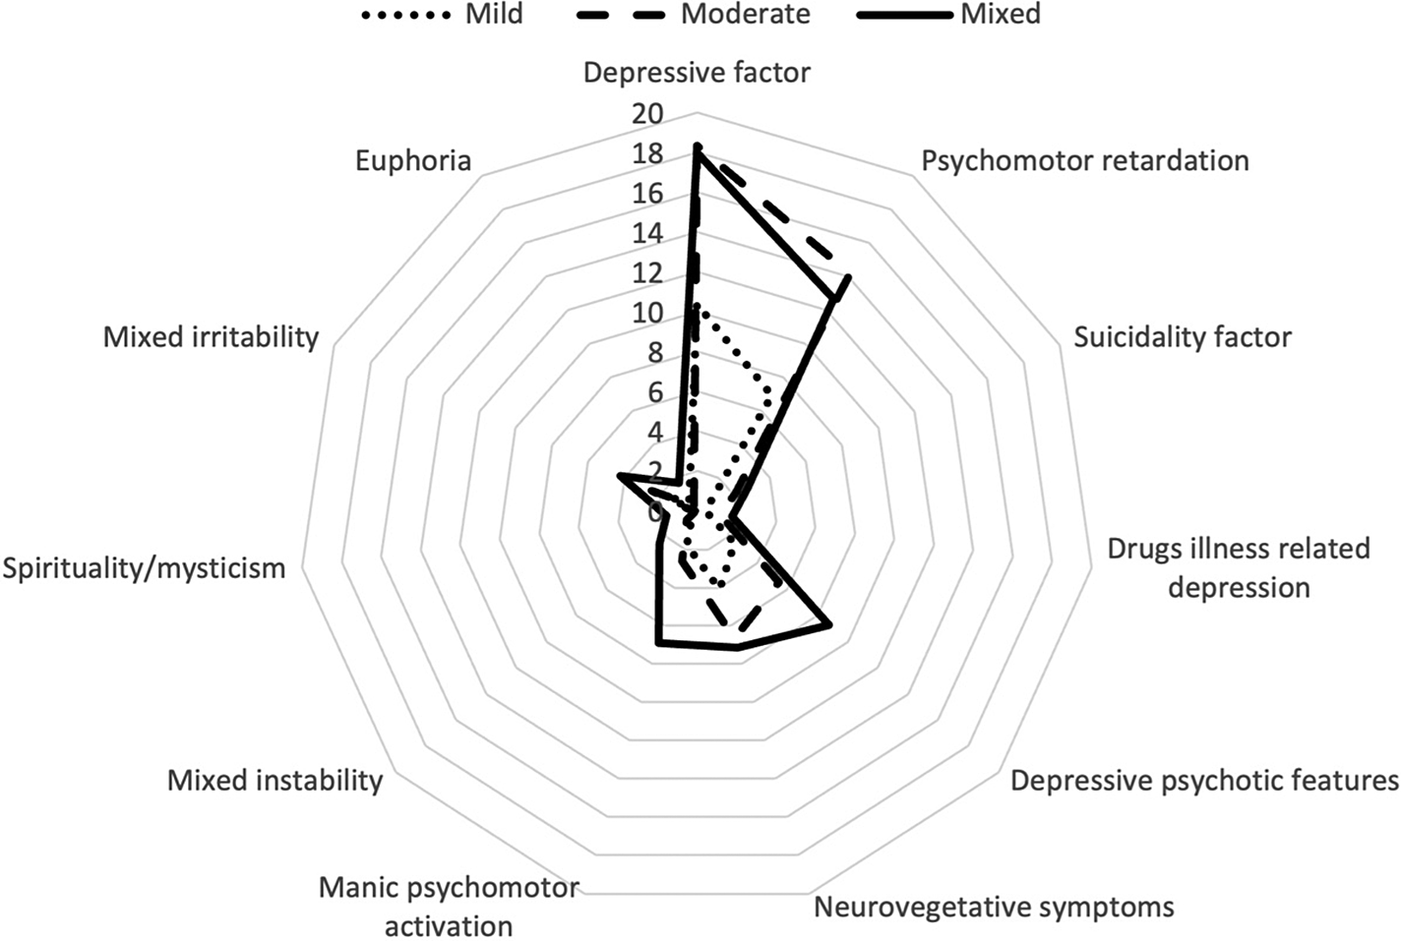
Figure 2. Radar chart representing the distribution of the MOODS-SR factors (according to factor analyses by Cassano) across the three clusters.
A significant main group effect was also observed in all scores of the MOODS-SR factors. With regard to (hypo)manic symptomatology, the Mixed cluster reported significantly higher scores in all (hypo)manic factors than both the Moderate and the Mild clusters, while these differed significantly from each other only in “mixed irritability” (Moderate > Mild) and in “euphoria” (Mild > Moderate). Regarding the depressive factors, the Mild cluster showed significantly lower scores for each factor compared to the Mixed and the Moderate clusters, which instead only differed significantly from each other in “psychomotor retardation” (Moderate > Mixed), “suicidality factor” (Mixed > Moderate), “depressive psychotic” features (Mixed > Moderate), and “drugs illness-related depression” (Mixed > Moderate).
Comparisons among clusters
Clinical, diagnostic, and severity variables
There were no gender differences among the three clusters. Significant intercluster differences were found for current age and age at onset of disorder, with post hoc analysis indicating that patients belonging to the Mixed group were significantly younger and had an earlier onset of disease compared to the other two clusters (Mild and Moderate).
Patients with BD were significantly less likely to be present in the Mild cluster than in the Moderate and Mixed clusters. The DSM-5 MFS did not differentiate the three subgroups, unlike the diagnosis of KMxD, which was significantly more prevalent in the Mixed cluster.
Regarding the psychiatric comorbidities, we did not find any significant difference in the prevalence of anxiety disorders across the three subgroups. Conversely, a significantly higher rate of a comorbid cluster B personality disorder, as well as a significantly lower rate of a comorbid cluster C personality disorder among patients belonging to the Mixed cluster, was observed.
When a subset of disease-severity and psychometric variables was considered, significant between-group differences were found for CGI-S, BIS-11, SPAQ, SDS, SF-12 Physical Component Summary (PCS) and SF-12 MCS scores, current psychotic and suicidal ideation, lifetime suicide attempts and the number of hospitalizations, with Mixed cluster patients reporting higher or worse values on each of these measures (except for the SF-12 MCS). Subsequent post hoc pairwise comparisons showed that the Mixed and Mild clusters significantly differed on each of these outcomes. On the other hand, significant differences between the Mixed and Moderate clusters were restricted to BIS-11 total score, current psychotic ideation, lifetime hospitalizations, and suicide attempts. Significant differences between the Mild and Moderate clusters were instead limited to CGI-S scores and current suicidal ideation (see Table 3).
Table 3. Comparison between the clusters on clinical characteristics, diagnostic features, and psychometric measures.

Note: The “>”symbol means that the median/mean value of the cluster on the left side of the symbol is statistically different and higher than the cluster on the right side of the symbol, the “≃” symbol means that the median/mean value of the cluster on the left and right sides of the symbol are not statistically different.
Abbreviations: BIS-11, Barratt impulsiveness scale score; KMxD, Koukopoulos mixed depression; MFS, mixed features specifier; SDS, Sheehan disability scale; SF-12 MCS, short form 12 item health survey mental component summary; SF-12 PCS, short form 12 item health survey physical component summary; SPAQ, seasonal pattern questionnaire assessment. Significant differences between groups are reported in bold, cut-off p-value is 0.05.
Regression analyses
The results of the GLMs are detailed in Table 4. The MOODS-SR factors, identified as positive or negative predictors for the outcomes considered, are indicated by nonzero values for standardized coefficients, with higher values expressing a greater magnitude of influence on the respective outcomes.
Table 4. Regression of MOODS-SR Factors with the selected variables.

Note: Significant variables in bold.
Abbreviations: AIC, Akaike’s information criterion; AUC, area under the ROC curve; BIS-11, Barratt impulsiveness scale score; GLM, general linear model; R 2, R squared; Stand. coeff., standardized coefficients.
Discussion
In the present study, we aimed at clustering a sample of inpatients admitted for a MDE in the context of either MDD or BD, based on a spectrum evaluation of mood symptomatology to ascertain whether subthreshold contrapolar symptoms may act as discriminant and moderating severity factors of a current MDE. Before performing the cluster analysis, we checked the relationship between the depressive and (hypo)manic components, finding a similar positive correlation between the number of depressive and manic/hypomanic items, experienced by patients with BD or MDD. This linear relationship had already been found in a previous study by Cassano et al. in a sample that included patients with remitted recurrent unipolar depression and patients with current bipolar depression [Reference Cassano, Rucci, Frank, Fagiolini, Dell’Osso and Shear49].
Actually, the relationship between depressive and manic symptoms has been investigated by several cross-sectional and longitudinal studies, none of which found support for the core assumption of a robust negative correlation between contrapolar symptoms, posited by the unidimensional model of BD, as no fixed relation pattern was identified [Reference Johnson, Morriss, Scott, Paykel, Kinderman and Kolamunnage-Dona50–Reference Sato, Bottlender, Schroter and Moller52]. Thus, depressive and (hypo)manic symptoms might be conceived as two separate dimensions, independently fluctuating even in their subdomains and this conceptualization would imply an orthogonal, rather than a linear approach to nosology, better encompassing the highly heterogeneous realm of mixed forms [Reference Malhi, Fritz, Elangovan and Irwin20, Reference McIntyre, Young and Haddad53].
The K-mean clustering analysis identified three numerically inhomogeneous transdiagnostic clusters, showing distinct profiles of MOODS-SR domains scores. As expected, BD patients were proportionally more represented in the Mixed cluster compared with the other two, but the post hoc analysis revealed a statistically significant difference in BD diagnosis distribution only between the Mixed and Mild clusters. Considering only the Moderate and Mixed clusters, as they share similar levels of depressive symptomatology and BD prevalence rates, the analysis of the between-groups differences on MOODS-SR factors suggests the presence, in our sample, of two phenotypes of bipolar depression distinguished by different combined degrees of inhibition and hyperactivation. Our findings can be added to those of previous studies, to show evidence for heterogeneity in bipolar depression with the identification of subtypes, based on clinical and psychopathological dimensions rather than nosologic categorization (i.e., BD type I and II) [Reference Perich, Hadzi-Pavlovic, Frankland, Breakspear, Loo and Roberts54–Reference Chen, Tu, Huang, Bai, Su and Chen56].
In the present study, we also investigated the pattern of distribution across the clusters of two alternative diagnostic constructs for “Mixed depression.” The prevalence of DSM-5 MFS was higher among the Mixed cluster patients with a percentage of 25%, but no significant mean effect of group was found. This finding may appear in contrast to the results of a recent study involving unipolar and bipolar patients suffering from MDE [Reference Takeshima and Oka57], which identified the clinical presentation with DSM-5 MFS criteria as the second strongest association with the cluster burdened by greater illness severity. Some methodological differences can partially account for this contrast in findings (i.e., different mood symptomatology assessment tools, disparities in sample size, recruitment procedures, interrater reliability levels, care settings, and the heterogeneity of the study population). Consequently, we may surmise that the DSM-5 MFS plays the role of a highly specific marker of mixedness, identifying more dramatic mixed presentations while leaving a large portion of mixed episodes underdiagnosed [Reference Kim, Kim, Citrome, Akiskal, Goffin and Miller5, Reference Takeshima and Oka57].
Interestingly, the alternative diagnostic construct of mixed depression, proposed by Koukopoulos (KMxD) [Reference Sani, Vohringer, Barroilhet, Koukopoulos and Ghaemi44], presented higher prevalence rates than DSM-5 MFS in each of the three clusters and it was found to discriminate the Mixed group from the Mild and Moderate ones after a post hoc analysis. Taken together, these findings appear to be consistent with the arguments questioning the diagnostic validity of the DSM-5-MFS, deemed to be poorly sensitive, and phenomenologically focused on pure manic manifestations but unable to capture the critical excitatory and dysphoric components of mixed depression [Reference Bertschy, Gervasoni, Favre, Liberek, Ragama-Pardos and Aubry58, Reference Malhi, Fritz, Allwang, Burston, Cocks and Devlin59]. These components have instead been incorporated into the KMxD criteria and, accordingly, the scores of the “mixed instability” and “mixed irritability” MOODS-SR subdomains were significantly higher in the Mixed cluster compared to the Mild and Moderate ones.
The study of the distribution across the clusters of the select sociodemographic, psychometric, and clinical variables revealed an overall disease-severity gradient from the Mild to the Mixed cluster. The Mixed cluster exhibited a strong association with most of the illness severity, quality of life, and outcomes measures considered, qualifying as a more severe clinical phenotype, consistent with well-established mixed presentations described in the literature [Reference Perugi, Angst, Azorin, Bowden, Mosolov and Reis2, Reference Brancati, Vieta, Azorin, Angst, Bowden and Mosolov60, Reference Angst, Cui, Swendsen, Rothen, Cravchik and Kessler61]. Compared to the patients in Mild and Moderate clusters, those belonging to the Mixed one were characterized by younger age and an earlier onset of disease, a higher number of hospitalizations and previous suicide attempts, the more likely presence of psychotic and suicidal ideation, greater levels of impulsivity, worse self-reported health and higher disability scores. Furthermore, within the Mixed cluster, we recorded higher comorbidity rates of any cluster B personality disorders or any substance use disorder. However, after post hoc pairwise comparisons between the Moderate and Mixed clusters, both characterized by similar MOODS-SR depressive total scores, statistically significant differences were limited to the number of hospitalizations and suicide attempts, psychotic ideation, comorbidity of cluster B personality disorders, and higher impulsiveness levels.
Finally, the potential correlations between the previously mentioned discriminant variables and the MOODS-SR depressive and hypomanic factors were explored. The regression model for the variable “suicide attempts” revealed that—excluding the intuitive correlation with the “suicidality factor”—the main predictors were represented by two (hypo)manic factors, namely “manic psychomotor activation” and “mixed instability,” consistent with the available evidence on the impact of these domains on the psychopathogenic pathway to suicidal behaviors in mood disorders [Reference Sampogna, Del Vecchio, Giallonardo, Luciano and Fiorillo62–Reference Balazs, Benazzi, Rihmer, Rihmer, Akiskal and Akiskal65]. In particular, as suggested by a comparative assessment of the two separate regression models for suicidal ideation and lifetime suicidal attempts, marked emotional lability and dysphoria may be supposed to exert a critical role in governing the transition from suicidal thought to suicidal acts.
Interestingly, the only negative predictor of lifetime suicide attempts was represented by “spirituality-mysticism-psychoticism,” confirming the religious-spiritual dimension as a protective factor against suicidal attempts [Reference Lawrence, Oquendo and Stanley66, Reference Saiz, Ayllon-Alonso, Sanchez-Iglesias, Chopra and Mills67]. Regarding the predictors for the outcome “lifetime hospitalizations,” contrary to the expectation of overlap with the predictors for suicidal attempts, we observed a slightly greater relevance of MOODS-SR factors belonging to the depressive pole. Specifically, psychomotor retardation may be seen as a symptomatic marker of remarkable importance in guiding clinicians whether to opt for patient’ hospitalizations [Reference Bennabi, Vandel, Papaxanthis, Pozzo and Haffen68–Reference Mauras70]. On the other hand, the level of impulsivity exhibited by our patients was associated with a greater number of positive predictors among the MOODS-SR hypomanic factors. Specifically, the mixed irritability factor presented the highest coefficient, followed by the depressive factor. The presence of subthreshold hypomanic symptoms during an MDE could, therefore, exert a multiplying effect on the proportion of impulsiveness already intrinsic to the depressive episode in both bipolar and unipolar patients [Reference Dervic, Garcia-Amador, Sudol, Freed, Brent and Mann71–Reference Hambrich, Nemes, Soare and Cozman73]. Finally, the regression analysis carried out for the variable “comorbid cluster B personality disorder” (represented mainly by a borderline personality disorder—BDP) showed a pattern of positive and negative predictors that appears consistent with the phenomenological characterization of BPD. The significant comorbidity of BPD observed among Mixed cluster patients is not surprising but widely reported in the literature [Reference Frias, Baltasar and Birmaher74–Reference Azorin, Kaladjian, Adida, Fakra, Belzeaux and Hantouche76]. Indeed, the phenomenological and clinical similarities between some mixed episodes and BDP represent critical arguments in the psychopathological debate about the possible inclusion of this personality disorder within the bipolar spectrum [Reference Smith, Muir and Blackwood77–Reference Aguglia, Mineo, Rodolico, Signorelli and Aguglia79].
This study is subject to several limitations that should be considered when interpreting the results. Firstly, the sample size was not large enough to allow for additional homogeneous subgroups (and therefore to estimate alternative optimal clustering solutions) since sufficient power would have been lost if further trait differences between smaller cluster groups were defined.
Secondly, the MOODS-SR questionnaire inquires only whether the item occurred for at least 3–5 days in the past month, without providing any additional information on the entire duration of occurrence and the intensity of each item. Also, given that the instrument assesses the current and lifetime symptoms, that occurred any time in the last month, there might be a recall bias.
Thirdly, since complete pharmacotherapy data are missing, our findings cannot be adjusted for them. Finally, the multicenter nature of the study may have resulted in differences in the policies adopted for patient’ hospitalizations and the definition-criteria of suicide attempts.
Conclusion
Using a cluster analysis based on a mood spectrum evaluation, this study identified three transdiagnostic clusters in a sample of acutely depressed patients. In support of our hypothesis, the magnitude of subthreshold (hypo)manic symptoms was related to greater clinical severity, regardless of the main categorical diagnosis. The transdiagnostic composition of each cluster and the orthogonal relationship observed in each group between depressive and manic symptoms, would seem to challenge the unipolar–bipolar dichotomy, supporting the existence of a continuum between the two opposite poles and the consequential need for a dimensional probabilistic approach to mood disorder diagnosis. Furthermore, in line with other studies, our results portray the attempt made by the DSM-5 to provide a reliable nosological framework for intra-MDE hypomania through the introduction of the DSM 5-MFS as unsuccessful, because of the intrinsic limits of that diagnostic category in targeting the whole realm of mixed states. On the other hand, this study represents an attempt at subtyping MDEs based on an in-depth exploration of mood spectrum phenomenology, and challenging the limitations of current categorical systems and polythetic diagnostic criteria. The identification of validated subtypes may aid in improving the classification performance and in guiding therapeutic choices (e.g., the use of antidepressants and the selection of a specific class), allowing a reasonable risk stratification regardless of the diagnostic categorical label. Furthermore, patients clustering based on the deconstruction of affective psychopathology may be functional for research into distinct underlying biological processes and for the subsequent development of personalized treatments [Reference Maj, Stein, Parker, Zimmerman, Fava and De Hert80].
Data Availability Statement
The raw data supporting the conclusions of this article will be made available by the authors, without undue reservation.
Acknowledgments
This work was developed within the framework of the DINOGMI Department of Excellence of MIUR 2018-2022 (Law 232/2016). The authors thank Catherine Ruth Halstead for the proofreading of the manuscript.
Author Contributions
Conceptualization: A.F.; Data curation: A.A., S.B., C.C., A.G., A.C.; Investigation: L.M., A.R., A.A., S.B., A.G.; Methodology: C.C.G.A.S.; Software: S.B., A.G., G.A.S.; Supervision: M.A., E.A.; Validation: G.M., M.A., E.A.; Writing—original draft: L.M., A.R., A.A., C.C.; Writing—review and editing: G.M., M.A., E.A.
Conflicts of Interest
E.G. is/has been a consultant and/or a speaker and/or has received research grants from Allergan, Angelini, Doc Generici, FB-Health, Janssen, Lundbeck, Otsuka, Fidia, and Recordati. M.A. is/has been a consultant and/or a speaker and/or has received research grants from Angelini, FB-Health, Janssen, Lundbeck, Otsuka, Pfizer, Recordati, and Glaxo. A.C. is/has been a consultant and/or a speaker and/or has received research grants from Angelini, Lundbeck, and Otsuka. A.F. is/has been a consultant and/or a speaker and/or has received research grants from Allergan, Angelini, Apsen, Boehringer Ingelheim, Doc Generici, FB-Health, Janssen, Lundbeck, Mylan, Otsuka, Polifarma, Recordati, Sanofi Aventis, Sunovion, and Vifor. G.M. is/has been a consultant and/or a speaker and/or has received research grants from Janssen, Otsuka, Lundbeck, Angelini, Sanofi, Boehringer, Fb-Health, and Recordati. A.A., S.B., C.C., A.G., L.M., A.R., and G.A.S. have no conflict of interest.


 Open access
Comments
No Comments have been published for this article.