


INTRODUCTION
Salmonellosis is the most common human bacterial foodborne illness in the USA [Reference Mead1, Reference Scallan2]. In 2009, there were 7039 laboratory-confirmed cases of Salmonella infections reported in the USA with an incidence of 15·2/100 000 [3]. Considering the large number of cases that go unreported, the actual number of human cases is estimated to be as high as 1·03 million every year [Reference Scallan2]. Significant progress has been made in terms of reducing the incidence of foodborne infections due to bacterial pathogens such as Shigella, Yersinia, Shiga toxigenic Escherichia coli, Campylobacter and Listeria (i.e. 25–55% reduction in incidence by the end of 2009 relative to 1996–1998 rates). However, during the same time period there has been only a 10% decrease in the incidence of human salmonellosis [3].
Salmonella is a common enteric bacterium colonizing the gastrointestinal tract of many animal species including pigs [Reference Rabsch4]. Salmonella Typhimurium (STM) is one of the most common Salmonella serotypes detected in swine faeces [Reference Wilkins5–Reference Akoachere7]. The presence of Salmonella-infected pigs at slaughter significantly increases the likelihood of cross-contamination of pig carcasses [Reference Botteldoorn8]. Contaminated pork and pork products then serve as sources of foodborne salmonellosis in humans [Reference Jansen, Frank and Stark9]. STM is the second most common cause of foodborne salmonellosis in humans next to S. enteritidis [3]. About 14% of all reported foodborne outbreaks of Salmonella infections are attributed to contaminated pork products [Reference Greig and Ravel10]. Thus, the value of reducing the prevalence of STM infection in the slaughter-age pig population to improve food safety is well recognized.
Pigs infected with STM often remain asymptomatic and shed bacteria into the environment for a varying period of time [Reference Nielsen11, Reference Osterberg and Wallgren12]. This is problematic when attempting to detect infected pigs in a timely manner, and restricts our ability to apply intervention measures to control the infection spread among pigs. The detection challenge is further complicated by an intermittent faecal shedding pattern of the bacterium by the infected pigs [Reference Ivanek13]. Additionally, STM can survive in the environment for up 80 days [Reference Arrus14]. The number of bacteria shed in the faeces of infected pigs, together with their ability to survive and replicate in the environment, contributes to the overall bacterial load in the environment, which facilitates indirect transmission. New infections occur when susceptible pigs are exposed to the pathogen in the environment, which includes the pathogen present on the hides of pigs. In practice, most commercial grower-finisher pig farms have some measure in place for excreta disposal (and pathogen removal) from pens on a daily basis, such as slatted floor space with a pit holding underneath, open gutter flush system or a flush system under the slat [15, 16]. Depending on the faeces removal system in place (hereafter used interchangeably with the term ‘cleaning’), the efficiency of pathogen removal (in terms of the proportion of faeces removed from the environment through cleaning) will vary across farms.
Although faeces removal from barn surfaces is routinely used on pig farms, the effectiveness of these cleaning practices as a control effort has not been thoroughly evaluated. For example, the combinations of cleaning frequency and efficiency that would be required to control STM infection in a pig herd are not known. To address this question we used a mathematical modelling approach, in which the transmission of STM occurs from the contaminated environment to the susceptible host. The basic reproduction number (R 0) and the number of infectious pigs at the time of slaughter were used as measures of STM transmission. R 0 is defined as the average number of secondary cases produced by one typical infected individual during its entire period of infectiousness in a completely susceptible population [Reference Anderson and May17]. As such, R 0 is a very informative quantity that measures the maximum reproductive potential for an infectious disease [Reference Diekmann and Heesterbeek18]. The prevalence of STM-infected pigs at slaughter age has food safety relevance.
The objective of this study was to improve our understanding of the role that cleaning could play in the control of STM spread in a typical pen of a grower-finisher pig herd managed under an all-in/all-out production system using a mathematical modelling approach. The proposed model further considers the mechanism in which infection transmission is affected by the intermittent shedding pattern as well as the bacterial shedding load and persistence in the environment. The grower-finisher pigs were used as a model system because a higher prevalence of STM in slaughter-age pigs poses an increased risk of cross-contamination of pork products at the slaughter plant [Reference Botteldoorn8].
MATERIALS AND METHODS
Model formulation
To describe STM transmission within a pig pen, we modified the standard Susceptible-Infected-Recovered-Susceptible (SIRS) model structure to include the free-living pathogen in the Environment (E) compartment and subdivided the Infected group into three compartments (Fig. 1) to represent the variation in the pattern [Reference Ivanek13] and rate of STM faecal shedding [Reference Scherer19, Reference Vu20] over the entire period of STM infection. Specifically, the three subgroups of STM-infected pigs are: Infectious 1 (I 1), Latent (L), and Infectious 2 (I 2). I 1 denotes the first continuous period of shedding after Susceptible (S) pigs become infected. Latent (L) pigs are infected but temporarily non-shedding (i.e. non-infectious). This state is followed by the intermittent Infectious state (I 2) where individuals resume shedding after a short period of non-shedding in state L. A pig in state I 2 could stop shedding temporarily (i.e. enter the L state) and then cycle between I 2 and L several times (describing intermittent shedding) during the total length of infection. Infectious pigs in the I 1 or I 2 state will eventually recover from the infection (and will be considered temporarily immune to re-infection). Recovered (R) pigs lose their immunity over time and eventually revert to full susceptibility (i.e. they enter state S).
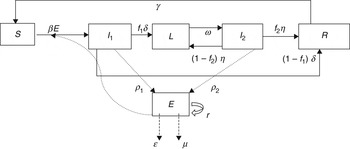
Fig. 1. Flow diagram illustrating the dynamics of Salmonella Typhimurium transmission in grower-finisher pigs.
The spread of STM infection in the pig population depends on the indirect transmission rate, susceptible host density, and the free-living pathogen density in the environment. The infectious animal sheds bacteria in the environment, where they can replicate and survive for a long period of time. In addition to STM excreted in the faeces from the infectious hosts, the natural decay and replication of free-living STM in the environment and cleaning practices determine the overall bacterial load in the environment. Transmission through encounters of susceptible pigs with the free-living bacteria in the environment is included in the model to represent indirect faecal–oral transmission.
In theory, direct transmission of STM from an infectious to a susceptible pig may occur. However, it should be noted that direct transmission can only occur if a susceptible animal ingests bacteria in the fresh faeces from the recto-anal region of an infectious animal, which is probably the only body part that can get contaminated with the animal's own, freshly excreted faecal material. All other parts of the animal's body are most likely contaminated by contact with the pen environment that is already contaminated with faeces of multiple pigs, including those concurrently infectious and those that were infectious several days earlier. Thus, ingesting bacteria from a contaminated animal hide, other than the freshly contaminated recto-anal region, should not be viewed as the direct transmission but as the indirect transmission due to animal–animal contact. As such, the extent of true direct transmission can be considered negligible compared to the extent of indirect transmission. Therefore, our model of STM transmission accounts for the indirect transmission only.
The transmission of STM infection in a grower-finisher pig pen is described by using a system of nonlinear ordinary differential equations (ODEs):
 $$\displaystyle{{{\rm d}S} \over {{\rm d}t}} = - \beta ES + \gamma R{\rm}, $$
 $$\displaystyle{{{\rm d}I_1} \over {{\rm d}t}} = \beta ES - \delta I_1 {\rm}, $$
 $$\displaystyle{{{\rm d}L} \over {{\rm d}t}} = f_1 \delta I_1 {\rm + (1} - f_2 {\rm )}\eta I_2 - \omega L{\rm}, $$
 $$\displaystyle{{{\rm d}I_2} \over {{\rm d}t}} = \omega L - \eta I_2 {\rm}, $$
 $$\displaystyle{{{\rm d}R} \over {{\rm d}t}} = f_2 \eta I_2 + (1 - f_1 )\delta I_1 - \gamma R{\rm}, $$
 $$\displaystyle{{{\rm d}E} \over {{\rm d}t}} = \rho _1 I_1 + \rho _2 I_2 + rE\left( {1 - \displaystyle{E \over K}} \right) - (\varepsilon + \mu )E{\rm,} $$
Parameter notations and definitions for the ODE system are given in Table 1. The time step used was 1 day. The parameter β is the rate of STM indirect transmission, δ is the rate that pigs move out of I 1, with a fraction (f 1) moving into the L state, and the remaining fraction (1 – f 1) moving into the R state. When latent pigs (L) start to shed again, they move to I 2 at rate ω. A fraction (f 2) of the pigs in I 2 recover and the rest move back to the L state at rate η. Thus, infected pigs can cycle between L and I 2 at specific rates. The infection with STM imparts transient protective immunity; therefore, the recovered pigs become susceptible after the loss of immunity at rate γ. The parameters, ρ 1 and ρ 2 represent the bacterial shedding rates per animal/day for pigs that are in I 1 and I 2 states, respectively. The parameter r is the rate of STM replication in the pen environment. The pathogen growth rate is modelled as a logistic growth with an environmental carrying capacity, K. The parameters ε and μ represent the rate of STM removal through cleaning and the natural pathogen decay in the environment, respectively. In reality, STM is consumed by all animals in the herd, not only the susceptible ones. However, this rate of STM consumption by the hosts is negligible compared to the rates of its growth in the environment and shedding by infectious animals, and the overall pathogen depletion rate from the environment (ε + μ) [Reference Caraco and Wang21, Reference Dwyer22]. Thus ingestion of STM by hosts can be neglected as justified by Dwyer [Reference Dwyer23].
Table 1. Notations and definitions of the parameters and their baseline values and distributions for sensitivity analysis of the Salmonella Typhimurium (STM) transmission model among grower-finisher pigs raised in an all-in/all-out system of production

n.a., Not applicable.
* The baseline rate of 1·61 and the sensitivity analysis values 1·26 and 2·25 correspond to the cleaning efficiency of 80%, 70%, and 90%, respectively.
Most grower-finisher farms follow an all-in/all-out system of production [24], where they receive weaned pigs 6–10 weeks of age and raise them for 14–20 weeks before selling the pigs for slaughter [Reference Wolter25, Reference Brumm26]. Therefore, this production system was considered as the most relevant for our model. Several simplifying assumptions were made to assure model tractability and interpretation:
-
(i) Initially, all but one of the incoming pigs are considered to be free of infection. While this is not always true, it is an important simplifying assumption to help us understand STM transmission dynamics in a grower-finisher facility using a deterministic mathematical model. The sensitivity of the model to this assumption was tested and the implications were discussed.
-
(ii) Pigs are dispersed randomly in the pen environment, and therefore are all equally likely to contact free-living STM.
-
(iii) The pig population does not change during the production period, i.e. there is no loss due to mortality or culling before pigs reach slaughter age. STM infection seldom causes clinical illness or death in pigs. About 2% of all pigs are lost due to mortality from other causes prior to reaching slaughter age [Reference Maes27]. However, these losses were considered to have a negligible effect on prevalence at slaughter age. The model's sensitivity to this assumption was tested and discussed.
-
(iv) The environment contaminated through faecal shedding of infectious pigs and through growth of free-living bacteria in the environment is the only source of STM infection in the pen; other sources of infection, such as infected pigs in neighbouring pens, insects, rodents and birds, were not considered. This model setup allows for the evaluation of STM transmission within a pig pen in isolation of these other sources (see Discussion).
Analysis of this model was performed by using a combination of analytical and numerical approaches. For numerical analysis, the system (I)–(VI) was solved using the ‘lsoda’ ODE solver in R (R Foundation, Austria).
Basic reproduction number (R0 )
R 0 is used as a threshold to determine whether or not the disease can invade the population of susceptible hosts successfully. In general, disease invasion is not possible (i.e. the disease-free equilibrium is locally asymptotically stable) when R 0 <1, but when R 0 > 1 the disease-free equilibrium is unstable and an outbreak is expected to occur [Reference Hethcote28]. The disease-free equilibrium (DFE) for system (I)–(VI) is given by:
 $$S^* = N,\quad{\rm where}\,N = S + I_1 + L + I_2 + R.$$
To calculate R 0 for the system (I)–(VI), we used the next-generation matrix method of van den Driessche & Watmough [Reference van den Driessche and Watmough29]. The next-generation matrix (H) for the system (I)–(VI) is given in the Supplementary online Appendix. The expression for R 0 is the spectral radius of matrix H [Reference van den Driessche and Watmough29]:
 $$R_0 = \textstyle{1 \over 2}\left[ {R_{01} + \sqrt {R^2 _{01} + 4R_{02} R_{03}}} \right]{\rm}, $$
where
 $$R_{01} = \displaystyle{r \over {(\varepsilon + \mu )}}{\rm}, \quad{\rm} R_{02} = \displaystyle{{\beta N} \over {\varepsilon + \mu}} {\rm,} \quad R_{03} = \left( {\displaystyle{{\rho _1} \over \delta} + \displaystyle{{\,f_1 \rho _2} \over {\,f_2 \eta}}} \right).$$
The term R 01 can be interpreted as the contribution to R 0 from the free-living pathogen in the environment expressed as the expected number of secondary colony-forming units (c.f.u.s) of pathogen produced by 1 c.f.u. of pathogen during its time in the environment. The term R 02 is the expected number of new infectious pigs (I 1) produced by 1 c.f.u. of pathogen during its time in the environment. The term R 03 is the expected number of c.f.u.s of pathogen shed by an infectious pig during its entire infectious period.
Parameter estimates
Table 1 summarizes the parameter values and the sources from which they were obtained. Parameters δ, ω, and η were estimated as the reciprocal of the mean sojourn time an infected pig spends in the continuous shedding (I 1), latent carrier (L), and intermittent shedding (I 2) states, respectively, for pigs challenged with either 106 or 109 c.f.u. STM, using the approach and data reported in [Reference Ivanek13]. Exponential distributional assumptions for these parameters were made in the method used to derive these rates by Ivanek et al. [Reference Ivanek13], which have been retained here. Similarly the parameters f 1 and f 2 were estimated from the ratio of the transition intensities using the approach and data reported previously [Reference Ivanek13] for pigs challenged with either 106 or 109 c.f.u. STM. The confidence limits for transition intensity ratios were computed with the normality assumption on the log scale [Reference Christopher30], so we retained this distributional assumption for f 1 and f 2. The STM shedding rates (ρ 1 and ρ 2) by pigs in states I 1 and I 2 were based on the shedding reported for pigs in I 1 (∼105 c.f.u./g faeces) and for pigs in I 2 (∼103 c.f.u./g faeces) [Reference Scherer19] and the fact that an individual grower-finisher pig produces an average of 1 kg (1000 g) of faecal material per day [Reference Vu20]. Pigs shed STM at a rate that closely satisfies lognormal distribution [Reference Scherer19], and we have used the lognormal distribution for ρ 1 and ρ 2 accordingly.
Published data on the indirect transmission rate (β) are lacking. Thus we estimated this value through calibration by matching the prevalence of pigs shedding STM predicted by our model to the prevalence of shedders within a pen reported in a longitudinal field study in three Danish farrow-to-finish swine herds known to be infected with STM [Reference Kranker31]. The transmission rate of β = 7·5 × 10−11/day per bacterial unit in the environment best described the early stage of reported STM infection outbreak. The STM natural decay rate in the environment, μ, was estimated from [Reference Arrus14] where STM survival of up to 80 days has been reported, using the reported initial and final count of bacteria over a given time interval in manure from feeder pigs stored at 25°C. Specifically, it was calculated as
 $$\mu = [\log (C_0 ) - \log (C_{\rm t} )]/\Delta t = 0\! \cdot\! 12,$$
indicating that an average STM survives for 8·3 days in the environment. In the above equation, log = natural logarithm, C 0 = initial STM count = 104, C t = final STM count = 1, Δt = time interval = 80 days. The model's sensitivity to the estimate of μ was assessed in the sensitivity analysis (Table 1). To test the potential role of the reported long-term persistence of STM in the environment, an additional sensitivity analysis was conducted with μ = 0·0125 that corresponds to STM survival of 80 days. While it is known that STM can replicate in fresh cattle and poultry manure [Reference Himathongkham32, Reference Traub-dargatz33], to our knowledge there is no published information on the rate of STM growth in fresh pig faeces. There is, however, evidence for the growth of S. Choleraesuis in pig manure [Reference Gray and Fedorka-Cray34]. That study reported that growth rate of S. Choleraesuis shed from pigs infected for <4 days was zero, and for those shed after 4 days and 7 days of infection were 0·18 and 0·54, respectively. We, therefore, used the average of the three growth rates (r = ∼ 0·25) for STM in pig manure and assessed the robustness of this assumption in the sensitivity analysis (Table 1). An additional sensitivity analysis was conducted to assess the role of a potential fast replication of STM in the environment with r = 0·5. In the absence of a known distribution for β, μ, and r, we assumed a uniform distribution around their baseline values to assess their impact on R 0 and STM prevalence at slaughter age.
The faeces (and pathogen) removal is partly affected by the type of floor surface on the barn. According to the 1996 record, there were essentially four types of floor surfaces (slatted, solid concrete, partially slatted, dirt) in US pig barns. About 40% of the grower-finisher pigs were raised in barns with slatted floors, 31% in barns with concrete floors, 24% in partially slatted floors, and the remaining 1% on dirt floors [35]. Similarly, the manure management method varies across production systems ranging from manual, mechanical, pit-holding to flush open-gutter, and the flush under slat method of cleaning the barn surfaces [15]. The slatted floor types are designed to work the faecal waste through the slats by the animal traffic into a pit-holding or an alley below [16]. Additionally, the flush system of cleaning may be applied either in a continuous or intermittent manner. Due to the variability in floor type and waste management practices on farms, it is impossible to pick a particular value of cleaning efficiency and frequency. The baseline numerical simulations were run assuming cleaning (i.e. faeces removal) occurred once a day with an 80% reduction of the pathogen load per cleaning. This daily per cent reduction corresponds to the removal rate of 1·61/day [converted using equation ε = −log(1 − proportion of STM removed) as described in [Reference Bani-Yaghoub36]]. In the sensitivity analyses, we allowed the per cent reduction to vary between 70% and 90% to accommodate a potential variation in cleaning efficiency across grower-finisher pig farms and our lack of knowledge about the estimate. Furthermore, the impact of different combinations of cleaning efficiency, frequency, and pathogen shedding levels on R 0 and STM prevalence at slaughter age were evaluated. It should be noted that by assuming the efficiency of cleaning is <100% we are assuming that a certain percentage of the total faecal material excreted by all pigs in 1 day will remain on the barn surfaces at any time. For example, with 80% cleaning efficiency, there will be 0·2 × 50 = 10 kg faeces remaining on the barn surface after cleaning (where 50 is the amount of faeces produced by N = 50 pigs in 1 day considering that one pig produces on an average 1 kg faeces per day). It may appear as though the amount of faecal material in the environment will increase without bound over time for a cleaning efficiency of 80%. However, this is not the case. Assuming that cleaning is performed once every day and always with the same efficiency, the faecal material on the barn floor will build up slightly for the first few days, but eventually reach a plateau after which there will be negligible increase. In the example of 80% efficiency, the amount of faeces that remained after cleaning on day 0 (10 kg) will accumulate until it reaches a plateau at 12·5 kg within 10 days. Below, we prove that the accumulated faecal material has an upper bound, determined by the initial amount of faeces and the efficiency of cleaning.
Suppose that the amount of faecal material remaining after cleaning on day 0 (x 0) is equal to 10 kg. If x n denotes the amount of faeces remaining on the barn surface after cleaning on day n, then the following will hold true:
 $$\eqalign{& x_0 = x_0 = 10\,{\rm kg}\,({\rm faeces}\;{\rm remaining}\;{\rm after}\;{\rm cleaning} \cr&\hskip46pt {\rm} {\rm on}\;{\rm day}\;0), \cr& x_1 = x_0 + (0\! \cdot\! 2)x_0 \,{\rm kg}\,({\rm faeces}\;{\rm remaining}\;{\rm after} \cr&\hskip22pt {\rm day}\;{\rm 1}\;{\rm of}\;{\rm cleaning}), \cr& x_2 = x_0 + (0\! \cdot\! 2)x_0 + (0\! \cdot\! 2)^2 x_0 \,{\rm kg}\, \cr&\hskip22pt ({\rm faeces}\;{\rm remaining}\;{\rm after}\; {\rm day}\;{\rm 2}\;{\rm of}\;{\rm cleaning}),} $$
In general, for a given cleaning efficiency (CE), the amount of faeces in the environment on day n is
 $$\hskip-2pt\eqalign{x_n = & x_0 \left[ {1 + (1 - CE) + (1 - CE)^2 + \cdots + (1 - CE)^n} \right] \hskip-33pt\cr = & x_0 \left[ {1 + (1 - CE) + (1 - CE)^2 \cdots\hskip2pt \cdots\hskip-1pt + (1 - CE)^n} \right]\hskip-33pt \cr = & x_0 \sum _{{\,j = 0}} ^n (1 - CE)^{\, j}.}\hskip-33pt $$
Using the properties of geometric series, the above sum has the upper bound x
0/CE (i.e $x_0 \Sigma _{{j = 0}} ^n (1 - CE)^j \leqslant {\displaystyle{x_0} \over {CE}}$
). Hence, the accumulated amount of faeces remaining on the barn surface is inversely proportional to the cleaning efficiency.
$x_0 \Sigma _{{j = 0}} ^n (1 - CE)^j \leqslant {\displaystyle{x_0} \over {CE}}$
). Hence, the accumulated amount of faeces remaining on the barn surface is inversely proportional to the cleaning efficiency.
Little is known about the average length of a pig's active immunity to STM infection following recovery. Pigs are known to produce an antibody response against STM from experimental infection [Reference Nielsen11]. The antibodies are sustained for a long time after the pigs cease to shed STM in the faeces. Assuming that the presence of STM antibodies in a pig correlates with the pig's immunity to re-infection, we considered that immunity lasts about 100 days following recovery [Reference Nielsen11, Reference Ivanek13]. The corresponding rate of moving from the recovered to susceptible state was thus γ = 1/100 per day. The effect of this parameter on the shedding prevalence in pigs at market age was assessed in the sensitivity analysis. The distributional assumption for the duration of immunity was taken from Ivanek et al., who used an exponential distribution to estimate the duration of antibody response [Reference Ivanek13].
The maximum volume of the environmental compartment, V e (i.e. the amount of faecal material in the environment) was calculated using equation (VIII) assuming a minimum cleaning efficiency of 60% in a herd of N = 50 pigs each producing 1 kg faeces per day. The corresponding value of V e is 33·3 kg. The robustness of the model to this assumption was assessed in the sensitivity analysis by reducing V e to 3·33 kg.
The dynamics of STM spread and potential control measures
The dynamics of STM transmission following the introduction of an infectious pig into a naive pig population was assessed numerically by solving the system of ODEs (I)–(VI) to predict the prevalence of pigs in each state of infectiousness over time. Furthermore, the parameters appearing in the analytical expression of R 0 [equation (VII)] were substituted by their baseline values (given in Table 1).
Sensitivity analysis
The sensitivity analysis was performed by simulating 10 000 iterations of the ODE model with I 1(0) = 1, L(0) = 0, I 2 = 0, R(0) = 0 and E(0) = 0 to assess the influence of parameters on R 0 using equation (VII) and on shedding prevalence in the slaughter-age pigs (i.e. 150 days of growing-fattening period). The simulation was executed using the Monte Carlo method as described in [Reference Helton and Davis37]. The parameters' space was sampled from the respective probability distributions as described in Table 1. For parameters with unknown shape and distribution, a uniform distribution was assumed. The lower and upper bounds of the uniform distributions were determined by taking ±25% of the baseline value, with the exception of ε, for which the range was estimated for cleaning efficiency corresponding to 70% and 90%. The simulation outputs (i.e. R 0 and shedding prevalence in slaughter-age pigs) were summarized with quartile box plots and density histogram. Pearson's correlation coefficient (ρ) was used to calculate and test the two-sided hypothesis of correlation between each parameter and the simulation outputs. The statistical significance of α = 0·05 was used, which was adjusted for multiple testing by implementing the Bonferroni correction. The corrected significance level was α = 0·00 277. Significantly correlated parameters were identified and the magnitude of correlation estimated. A few parameters that were identified as particularly relevant for infection control, including the cleaning rate (ε), shedding rates (ρ 1 and ρ 2), and the rate of transition out of I 1(δ), were assessed by evaluating the changes in R 0 by varying two parameters at a time while keeping all other parameters constant. In order to assess the effect of different combinations of cleaning efficiency and frequency on R 0 and shedding prevalence in slaughter-age pigs, the simulation was performed using fixed values of ε. These fixed values correspond to situations with specific combinations of frequency (1, 2 or 3) and efficiency (70%, 80%, 90%, 95%, 99%) of faeces removal by cleaning per day, while using the respective parameter space for sampling all other parameters.
Infection transmission is known to be influenced by population size, N [Reference Anderson and May17]. To assess the effect of N on transmission dynamics, we ran the model with two additional scenarios using N = 30 and N = 100. The first scenario with N = 30 was chosen to represent operations housing pigs in smaller groups [Reference Brumm26]. The second scenario with N = 100 was considered because housing pigs in large groups (⩾100 pigs per pen) has been advocated to lower the facility cost of production [Reference Verdoes, Vermeer and van Zeeland38].
Model validation
Ideally, model output should be validated using an independent dataset that closely represents the model assumptions. However, such a dataset was not available. Therefore, we assessed the model performance by comparing the model predicted STM faecal shedding prevalence over time with the prevalence data from a longitudinal study describing natural STM infection over time in three cohorts of grower-finisher pigs that received weaned pigs from a single breeding source [Reference Funk, Davies and Nichols39].
RESULTS
The baseline value of R 0 was 1·74. The predicted prevalence of pigs in the continuous shedder (I 1) latent (L) and intermittent shedder (I 2) states during the growing-fattening period is given in Figure 2 a. The mean prevalence for the three states (I 1, L, I 2) increased initially and decreased quickly to settle at equilibrium following a damped oscillation. During the outbreak phase, the mean prevalence of pigs in I 1 state was higher than of pigs in I 2 and L states. However, as the prevalence declined after reaching the first peak post-outbreak, the mean prevalence of L pigs was greater than pigs in the I 1 and I 2 states. The mean prevalence of the two shedding states (I 1 and I 2) combined was higher initially, but later declined to equal the mean prevalence of the L state (Fig. 2 b). The dynamics of STM transmission in a pen were greatly determined by the rate of STM shedding in the faeces by pigs in the I 1 state (ρ 1) and the efficiency of cleaning (represented by ε) in terms of reducing the pathogen load from the barn environment (Fig. 3).

Fig. 2 [colour online]. Mean prevalence of Salmonella Typhimurium (STM)-infected pigs in (a) the continuous shedder (I 1), non-shedder latent (L), and the intermittent shedder (I 2) stages; and (b) mean prevalence of pigs in shedding stages (I 1+I 2), and non-shedding (L) stage, overlaid with previously reported average STM prevalence in naturally infected pigs [Reference Funk, Davies and Nichols39] indicated by solid circles. The vertical dashed line represents the average time when pigs in a grower-finisher facility reach slaughter age (150 days).

Fig. 3. Illustration of how R 0 changes with respect to: changes in cleaning rate ε and continuous shedding rate ρ 1 (upper left), changes in ε and intermittent shedding rate ρ 2 (upper right), changes in ε and the rate of moving out of the I 1 state δ (lower left), and changes in δ and ρ 1 (lower right). Note that R 0 is mostly influenced by ρ 1, ε, and δ.
Sensitivity analysis
The average value of R 0 resulting from the 10 000 simulated STM transmissions was 1·71 with the 5th and 95th percentiles equal to 0·43 and 4·28, respectively. About 97% of the simulated values of R 0 were <5. The distribution of all possible values of R 0 and the corresponding frequencies for STM transmission are reported in Figure 4(a, b), respectively. About 30% of the simulated values of R 0 were <1, which would mean that STM failed to establish itself in the pig population on average 30% of the time if a single STM-infected pig was introduced into a pen of 49 susceptible pigs. The STM shedding prevalence at slaughter age was predicted to be widely variable with a mean of 13·8% (median 7·1%, median absolute deviation = 10·48%) and 5th and 95th percentiles equal to 0% and 50%, respectively (Fig. 4 d, Table 2). The mean as well as the variation in shedding prevalence decreased when decreasing the number of pigs per pen while the opposite occurred when increasing the number of pigs (Table 2).

Fig. 4. Distribution of R 0 for Salmonella Typhimurium (STM) transmission in pigs from the simulation results, summarized as (a) a quartile box plot and (b) a frequency histogram. (c) An illustration of possible variation in the trajectory of STM transmission after introduction of a single infected pig in a pen of 49 pigs, and (d) the cumulative distribution of STM faecal shedding prevalence in slaughter-age pigs.
Table 2. Scenario analysis of the influence of population size on R0 and STM shedding prevalence in slaughter-age pigs
The rate of faecal shedding of STM (ρ 1) and their clearance from the pen environment through cleaning (ε) were shown to be the most influential in determining R 0 (Fig. 5 a). Shedding rates (ρ 1 and ρ 2) and the indirect transmission rate, β, had a positive correlation with R 0 while STM removal by cleaning (ε) and the rate δ of exiting from the continuous shedding state (I 1) had a negative correlation with R 0. Each of these parameters, except ρ 2, was also correlated with STM prevalence in slaughter-age pigs (Fig. 5 b). An additional parameter, γ, had a significant positive correlation with the prevalence of STM shedding in slaughter-age pigs (this parameter was not associated with R 0 as it did not appear in the R 0 expression). For the parameter values used, in order to reduce the mean value of R 0 < 1, more frequent cleaning (at least three times per day) would be necessary given that the cleaning method used could effectively remove at least 90% of the pathogens from the pen environment (Table 3). Figure 6 shows that one single cleaning, even with very high efficiency (with removal of 99% of faeces), was not sufficient to consistently prevent STM spread, evident from the average value of R 0 > 1 (R 0=1·05) and STM prevalence in slaughter-age pigs (mean = 7·6% and 5th and 95th percentiles equal to 0% and 38%, respectively). The number of STM shedding pigs at slaughter age was ⩾1 in 38% of the simulations (Fig. 6). The model results (R 0 and STM prevalence) were not affected by introducing a slightly higher number (e.g. 2, 3 or 4) of infected pigs into the pen. Replacing the pathogen decay rate of μ = 0·12 used in the baseline model with μ = 0·0125, that corresponds to a long-term STM survival (80 days) in pig manure, resulted in a very small increase in R 0 (from 1·74 to 1·79) and in shedding prevalence (from 13·8% to 14·24%) in slaughter-age pigs. Similarly, when a growth rate of r = 0·5 was considered instead of r = 0·25, R 0 increased from 1·71 to 1·81 and the prevalence of shedders at slaughter age increased by 1% (i.e. from 13·8% to 14·9%). Similarly, by changing the value of V e from its baseline of 33·3 to 3·3 kg, the prevalence in pigs at slaughter age remained the same, indicating that the developed model is very robust to the assumption about the volume of the environmental compartment. The effect of ignoring the mortality rate in the model was assessed by re-running the model after accounting for the 2% mortality and comparing STM prevalence at slaughter-age. The difference observed was negligible; therefore, it was concluded that the mortality of pigs during the fattening period did not have a significant effect on STM transmission in pigs.

Fig. 5. Pearson's correlation coefficient values indicating the strength of the relationship between the model parameter and model outputs as determined by a Monte-Carlo simulation in a sensitivity analysis. The model outputs are: (a) the basic reproduction number, R 0, and (b) the Salmonella Typhimurium shedding prevalence (I 1+I 2) in pigs at slaughter age. Only the parameters with statistically significant correlation coefficients are shown.
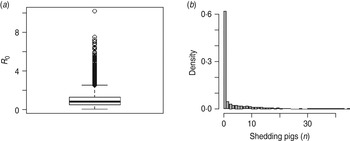
Fig. 6. Distribution of R 0 for Salmonella Typhimurium transmission in pigs for (a) a scenario with cleaning of 99% efficiency applied once a day (i.e. cleaning rate of 4·6 per day) and (b) the corresponding shedding prevalence in pigs at slaughter age.
Table 3. The effect of pathogen removal through cleaning. Different combinations of cleaning frequency and efficiency were evaluated based on the basic reproduction number (R0) and the shedding prevalence at slaughter age, which were computed from 10 000 iterations from the parameter space as described in Table 1

* The figures reported are for slaughter-age pigs.
Model validation
The model was validated by comparing the model-predicted STM prevalence to the prevalence reported from independent longitudinal data collected under natural conditions [Reference Helton and Davis37]. The model-predicted prevalence over time was a reasonably good fit to the average prevalence (0–48%) and variability observed in a cohort of pigs from the longitudinal study (Fig. 2 b).
DISCUSSION
We developed a model that utilized current knowledge of STM shedding patterns in infected pigs and evaluated the factors influencing transmission to identify potential control measures. Specifically, the model was developed to improve our understanding about the role of cleaning in the control of STM transmission. The major achievement of this study is in the ability to quantitatively describe the efficiency of cleaning in transmission and control of STM in grower-finisher pigs. While the study confirmed that cleaning contributes to the control of STM transmission, it also indicated that cleaning alone is unlikely to be the most efficient method of infection control. Instead, the developed model predicted that a combination of cleaning and some measures to reduce the level of STM shedding in the faeces of infectious pigs would be an effective method to control STM infection in pig populations. Below we present the implications of these findings and discuss them in the context of other studies, as well as the strengths and limitations of our study.
The shedding rate of pigs in states I 1, ρ 1, was the most influential factor on STM transmission as measured by R 0 (Fig. 5 a). This finding is consistent with a field epidemiological study of pigs raised in paddocks, which found that the high level of Salmonella excretion in faeces was the driving force in the spread of STM infection measured by seroprevalence and high infection rate in pigs introduced into the environment contaminated with a high load of the pathogen [Reference Jensen40]. This confirms that the bacterial concentration in the environment (and the associated exposure dose) is the driving force in the infection transmission regardless of the pig production environment. The next most influential factor affecting R 0 was cleaning (ε), followed by the transmission rate (β) and the duration of stay (1/δ) in the I 1 state. Cleaning, therefore, could serve as a standard means to control the spread of STM infection. However, the model results indicate that even a highly efficient faeces removal, achieving 99% reduction in pathogen load, if applied once a day may not be able to consistently prevent an STM outbreak (Fig. 6). In order to reduce R 0 to a value <1, cleaning would need to be applied more frequently (>3 times per day) and must remove at least 90% of the pathogen load. Note that cleaning frequency is implicitly represented within the parameter ε in the R 0 expression (Table 3). The efficiency of cleaning on STM control may also be improved by reducing the number of pigs housed per pen, because a smaller number of animals in the group lowers the transmission potential and decreases the expected prevalence among slaughter-age pigs (Table 2). Thus, while increasing group size is attractive from the economics point of view [Reference Wolter25, Reference Verdoes, Vermeer and van Zeeland38], from the food safety perspective smaller groups should be favoured. We would like to note here that the reduced bacterial load in the pen environment as a product of cleaning would result in a lower dose of STM exposure to pigs. It has been reported that pigs infected with a lower dose of STM have a shorter duration of stay in the I 1 state and faster recovery from the I 2 state [Reference Ivanek13]. This indirect effect of cleaning on the control of STM transmission was not accounted for in our model. Future studies could be conducted to assess the extent of the underestimation due to neglecting the indirect effect of cleaning on STM transmission.
The STM shedding prevalence in slaughter-age pigs was influenced by the duration of immunity 1/γ in addition to the factors ρ 1, δ, ε, and β, which were also identified as important for R 0. The parameter γ (rate of loss of immunity) does not appear in the R 0 expression, which is reasonable because R 0 is the measure of transmission in a completely susceptible population and should not be affected by the duration of immunity of recovered individuals. Therefore, R 0 is independent of γ. However, when the infection is present, the prevalence at any time will be determined by the availability of a susceptible population, and the duration of immunity determines the rate at which pigs in state R enter state S, contributing to the supply of newly susceptible pigs. As expected, increasing the duration of immunity decreases the rate at which the population of susceptible pigs is replenished from pigs in the recovered state, thereby reducing STM prevalence in slaughter-age pigs. Similarly, reducing the duration of immunity allows for an increase in the population of susceptible pigs coming from the recovered state, which increases STM prevalence in slaughter-age pigs. The practical implications of these results are at the moment unclear because the true duration of protective immunity in pigs following STM infection is unknown. Future experimental research is needed to address this question.
In this study, several modelling assumptions were made. The assumption of homogeneous mixing (i.e. the random interaction between pigs and the free-living pathogen in the pen environment) ensured exposure of all pigs to the same amount of free-living pathogen units. While in reality, pigs are exposed to a different amount of STM from the contaminated pen environment this assumption was necessary to enable the derivation of an analytical expression for R 0 so that the effect of parameter variation could be assessed. In our model, we considered introduction of a single infected pig into the pen as the only initial source of STM in the pen. Thus, all other sources, including STM contamination from neighbouring infected pens, were neglected. It has been reported that if pigs in one of the pens in the barn are infected, then the probability of pen-to-pen transmission is almost 90% albeit over a period of time (mean = 2 weeks, range 0–4 weeks) [Reference Berends41]. Thus, between-pen transmission could influence STM transmission within a pen in a crucial way. That being said, neglecting between–pen transmission in our model allowed evaluation of the effect of cleaning on the infection transmission within a pen in isolation from other contamination sources. That way, our pen-level model provided a baseline for future evaluation of the effect of cleaning in control of STM infection within a pig herd. In such an evaluation, cleaning could be assessed in conjunction with a control strategy that reduces pen-to-pen transmission (e.g. by employing some general hygiene barrier) using a more complex meta-population or network modelling approach, such as in [Reference Bansal, Grenfell and Meyers42]. Some of the limitations of this study are embedded in the deterministic structure of the developed model. Deterministic models are unable to assess the impact of small changes in the initial number of infectious pigs and the demographic changes during the fattening period, e.g. death of an index case before it is able to transmit the infection (as a small increase in the initial number of infectious pigs and mortality, respectively, did not affect our results) and cannot capture the random nature of infection transmission in small populations [Reference Nasell43, Reference Jansen, Turelli and Godfray44]. While these questions should be evaluated using a stochastic modelling approach, the study described here provides a valuable baseline for such a model.
The conclusions of this study are also dependent on the parameter values used in the model. In this regard, bacterial shedding concentration merits discussion as it was the most influential parameter in STM transmission. There is limited information on the actual concentration of STM shed by an infected pig from longitudinal studies under natural conditions. Few studies that exist report shedding, mostly at low levels [Reference Jensen40]. However, the reported lower shedding levels and shorter shedding duration in naturally infected pigs may also be an artefact of long sampling intervals between two sample collections in such studies. Most pigs shed STM at high levels early in the infectious period and the concentration of shedding gradually lowers over time. In a longitudinal study with long sampling intervals, this pattern, including the high level of shedding at the start of infection, may not be captured and many more sampling occasions would fall during the period when pigs are shedding at low levels. This is evident in Jensen et al. where the authors not only report lower shedding in pigs infected through the natural contact with infected pigs or the contaminated environment, but they also report lower level of shedding in pigs inoculated with a high dose of STM [Reference Jensen40]. We therefore, used an experimental inoculation study with frequent sampling [Reference Scherer19] as a source of information about the values of shedding rates.
Our model differs from the previously published models [Reference Hill45, Reference Ivanek46] in that others have considered the direct transmission from infected to susceptible pigs and have not considered the free-living pathogen in the environment, whereas we have considered STM spread through an indirect transmission from the contaminated pen environment. One additional modelling study, which considered indirect transmission from the environment [Reference Lurette47], did not consider pathogen growth and did not include the effect of cleaning as an explicit measure of infection control in the barn, whereas we allowed for pathogen growth and included cleaning as a measure to reduce pathogen load in the environment. The residual contamination of the barn following pathogen removal through cleaning affects both R 0 and STM shedding prevalence in pigs. This result highlights the importance of taking into account the change in Salmonella load due to cleaning, particularly to test the control measures at the population level. Our results also indicate that pathogen growth and survival in the environment increases the value of R 0 as well as the prevalence of shedders at slaughter-age; however, this increase was very small. Thus, while STM has a non-negligible potential to grow and persist in the environment, because of the continual and fast depletion of the pathogen through cleaning, the contribution of growth and persistence to the STM transmission process seems to be relatively low.
Although both direct and indirect transmission have been reported for STM infection in pigs [Reference Osterberg, Lewerin and Wallgren48], we chose to use only the indirect mode of transmission. This is because indirect transmission is considered the primary mode of STM spread in pigs, as explained in the Materials and Methods section.
Model validation using field data that satisfies model conditions is desirable; however, these were not available. The available evidence describes STM shedding prevalence in several cohorts of naturally infected grower-finisher pigs under field conditions, which may not necessarily satisfy all initial model conditions [Reference Funk, Davies and Nichols39, Reference Pires, Funk and Bolin49]. However, these were the best available datasets that we could use for qualitative and quantitative validation of the shedding prevalence predicted by the model over time. Our model output described high variability in the shedding prevalence over time for different cohorts consistent with those reported in previous longitudinal studies [Reference Funk, Davies and Nichols39, Reference Pires, Funk and Bolin49]. The model predicted shedding prevalence in slaughter-age pigs (the mean and variability), which closely matched those in the reported studies [Reference Pires, Funk and Bolin49, Reference Rasschaert50].
In this study, we have attempted to describe the mechanism by which cleaning (faeces removal) affects STM control. While cleaning could be effective, the fact that it needs to be implemented ⩾3 times per day to control spread of infection makes it a considerably less plausible control method for farmers. Under the model assumptions, and as shown in the sensitivity analysis, an efficient control strategy should incorporate either increased frequency of cleaning or combine a cleaning strategy with other appropriate measures to reduce the bacterial shedding load in faeces. Several measures have been suggested to reduce STM prevalence and shedding load including the acid treatment of feed [Reference Willamil51, 52] and vaccination [Reference Charles, Abraham and Trigo53, Reference Denagamage54] in field conditions. Applying these measures and ensuring STM-free feed, together with existing cleaning practices may be an effective measure to control STM spread in grower-finisher pigs.
SUPPLEMENTARY MATERIAL
For supplementary material accompanying this paper visit http://dx.doi.org/10.1017/S0950268813001805.
ACKNOWLEDGEMENTS
This work was supported by the National Science Foundation grant NSF-EF-0913367 to R.I. funded under the American Recovery and Reinvestment Act of 2009. Any opinions, findings, and conclusions or recommendations expressed in this material are those of the authors and do not necessarily reflect the views of the National Science Foundation. We are grateful to Dr Charles W. Kaspar, from the University of Wisconsin–Madison, for his assistance in addressing the issue of the growth rate of STM in fresh pig manure. We also thank two anonymous reviewers for their thoughtful comments and suggestions which considerably improved the manuscripts.
DECLARATION OF INTEREST
None.


