


Introduction
The influenza A(H1N1)pdm09 virus was first identified in humans on 15 April 2009, and on 25 April 2009, the World Health Organization (WHO) declared the outbreak of a ‘public health emergency of international concern’ [1]. In the following 6 weeks, the virus spread rapidly to more than 214 countries via international air travel of the infected persons [Reference Khan2]. Knowledge about influenza transmission route(s) is very important for the development of effective intervention strategies. Despite being studied for more than 80 years since the influenza A virus was first discovered [Reference Smith, Andrewes and Laidlaw3], the influenza A transmission routes have remained controversial; in particular, researchers have yet to determine whether influenza A is transmitted via the airborne route, the large-droplet route, the contact route or a combination of these routes [Reference Brankston4], and whichever of these predominates may vary under different circumstances.
In general, three transmission routes exist for in-flight influenza transmission: airborne, large droplet and contact (direct and indirect contact) [Reference Weber and Stilianakis5, Reference Mangili and Gendreau6]. As during a flight, direct body-to-body contact is rare because passengers remain seated most of the time [Reference Wagner, Coburn and Blower7]. Further, the number of viable influenza A viruses on human hands decreases by 2log10 within 5 min [Reference Bean8] and 3log10 within 12 min [Reference Schurmann and Eggers9]; thus, the interval for indirect contact transmission is relatively short. Indirect contact has also been shown to play a much less important role in the transmission of influenza A in a household and an aircraft environment [Reference Atkinson and Wein10, Reference Lei11]. Therefore, in aircraft cabins, influenza transmission is likely facilitated by the large-droplet route or the airborne route, or a combination of the two [Reference Brankston4]. With airborne transmission, this may disseminate influenza over large distances, resulting in a wide distribution of secondary cases in space. In contrast, large-droplet transmission mostly occurs within 1.5–2 m of the source, resulting in most secondary cases appearing close to the index case(s). So the close proximity infection was always cited as the evidence of large-droplet transmission. However, Liu et al. [Reference Liu12] found a substantial increase in airborne exposure to airborne droplets when a susceptible individual was within 1.5 m of the source, also known as the proximity effect. Given that the typical distance between each seat in the economy class of an aeroplane is around 0.8 m, the proximity effect of the short-range airborne route can pose a higher infection risk to the passengers within two rows of the index cases than to the others.
Compared with other settings, such as classrooms, offices and hospitals, aircraft cabin is a tightly controlled environment with a much higher number of people per unit volume. Temporal and spatial environmental parameters in cabin are less variable than in other populated spaces. The essentially fixed seating arrangement in these cabins allows a very accurate identification of the spatial pattern of secondary cases. Therefore, the tightly controlled environment of aircraft cabins offers unique opportunities to study potential transmission routes with great accuracy. This is important for understanding and then curtailing such transmission as aircraft are capable of transporting infectious agents across the world within 24 h, as was seen with the 2009 influenza A(H1N1)pdm09 [Reference Khan2].
In this study, based on the different transmission mechanisms of the airborne and large-droplet routes, we quantitatively analysed the spatial distribution of secondary cases and explore the dominant route of inflight influenza transmission.
Methods
We first conducted a literature review of inflight influenza A(H1N1)pdm09 outbreaks. Then, to explore the inflight transmission routes of influenza A (H1N1)pdm09 on the basis of the airborne and large-droplet transmission mechanisms, we quantitatively analysed the attack rates of passengers seated in the same sections as the index cases, those seated in sections other than those of the index cases and those seated within or beyond two rows of the index cases. Finally, we investigated the relationship between the attack rates and the total infectivity of index cases and/or the flight duration.
Literature search/study selection
We searched the PubMed databases for air travel-associated cases of influenza A(H1N1)pdm09 infection between 2009 and 2017 (see online Supplementary material), since the influenza A(H1N1)pdm09 pandemic was first identified in humans on 15 April 2009 [1]. The search data were from 15 October 2017 and updated until 14 November 2017.
The search process is shown in online Supplementary material and Figure 1. The search results included 10 studies and 15 flights. We also compared our results with a systematic literature review of inflight influenza outbreaks [Reference Leitmeyer and Adlhoch13], and one more inflight influenza A(H1N1)pdm09 outbreak [Reference Cao14] was included. As this study focused on the possibility of transmission during air travel, in the study by Català et al. [Reference Català15], the index patient was a member of a student group and only the members of this student group were traced; therefore, this study was excluded from the analysis. In the study by Zhang et al. [Reference Zhang16], eight secondary cases in flight 1 also took flight 2; therefore, the two flights were considered one with the flight duration equal to the sum of the durations of both the flights. So in total, 10 studies and 14 flights were selected; the total number of flights investigated exceeded the number of articles because three studies referred to multiple flights. Appendix Table 1 provided detailed information of the 14 flights.
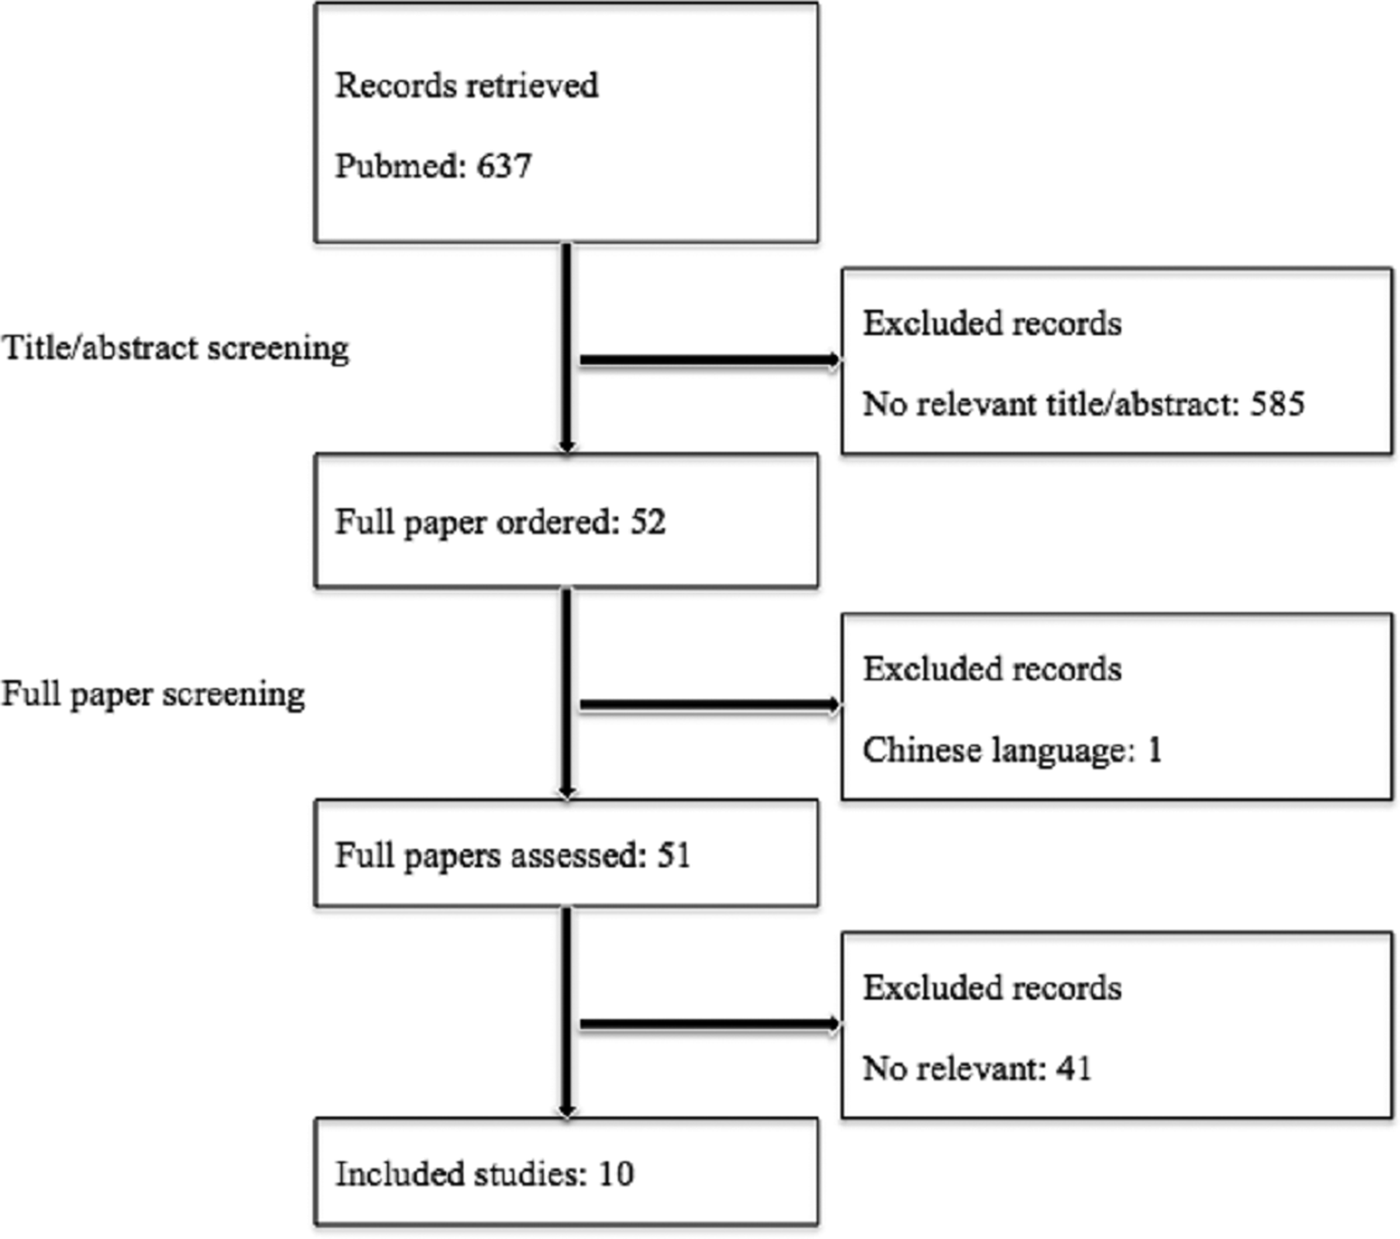
Fig. 1. Flow diagram of the literature review process.
In all, 14 flights were investigated with flight durations ranging from 45 min to 22 h. Eight were long-haul flights or international flights (with a duration of ⩾8 h), nine flights departed from the USA or Mexico, i.e. from where the influenza A(H1N1)pdm09 pandemic originated [17, 18]. Five flights did not depart from the USA or Mexico, but in four of these, the index case(s) originally departed from the USA and developed illness during the subsequent connecting flights (14, 25 (Flights 1, 2 and 3)). All outbreaks occurred within a 2-month period, from 3 April 2009 to 3 June 2009; 14 outbreaks occurred within the first 2 months after the first identification of the influenza A(H1N1)pdm09 pandemic on 15 April 2009 [1]. The proportion of traceable passengers ranged from 23% to 100%. Furthermore, for eight flights, a complete or near-complete follow-up of contact tracing (interview rate ⩾84%) in the aeroplane, a section or a non-tour (student) group was achieved.
Case definitions
We considered passengers to have an influenza-like illness (ILI) if they had developed any of the following symptoms: fever, cough, sore throat, headache, runny nose, muscle aches, diarrhoea and/or lethargy (i.e. a syndromic case) [Reference Foxwell19]. We considered a case to be laboratory-confirmed if the nasopharyngeal swab was positive for pandemic A(H1N1)pdm09 or if antibodies specific to pandemic A(H1N1)pdm09 were detected in the serological tests [Reference Baker20].
An index case was therefore defined as a person who developed laboratory-confirmed influenza, an ILI or an acute respiratory illness within 7 days before the flight departure date, which is the period of illness during which viral shedding is most likely to occur [Reference Lee21].
A secondary case was defined as a person who did not develop an ILI or an acute respiratory illness (syndromic secondary case) or laboratory-confirmed influenza (laboratory-confirmed secondary case) before the flight and developed either or both within 7 days after the flight; this definition is based on an estimated incubation period of 1–7 days for pandemic A(H1N1)pdm09 influenza [17, 22].
Definitions of close contact and attack rate
As a possible transmission route of influenza, the large-droplet (⩾10 µm diameter) route is confined to within 2 m of the index cases. Given that the typical distance between each seat in the economy class of an aeroplane is around 0.8 m [Reference Kim23], the close contact of an index case is defined as passengers seated within two rows of and on the seats on either side of the index cases, partly coinciding with the WHO guideline regarding the contact tracing of passengers seated within two rows of an infectious case of influenza A (H1N1)pdm09 [24]. The attack rate is defined as the number of secondary cases divided by the number of interviewed susceptible passengers. As this study focused on the possibility of transmission during air travel, the members of the tour group [Reference Han25] (Flight 3), members of the student group [Reference Català15, Reference Baker20] and travel companions [Reference Neatherlin26] (Flight B1) known to have interacted with the index case(s) outside of the travel were excluded from the analysis.
Definition of infectivity of index cases
Infectivity may differ for each index case and during different periods of illness. Viral shedding is a natural marker of viral infectivity and has been used as such in many studies [Reference Carrat27, Reference Cowling28]. One study quantified the relationship between viral shedding and infectivity and found that the best-fitting model assumed that infectivity was proportional to V 0.136 for influenza A(H1N1), where V denotes the viral load [Reference Tsang29]. Clinical studies have shown that viral shedding in influenza A viral infections peaked on the first 1 or 2 days of clinical illness and decreased exponentially to undetectable levels by day 6 or 7 [Reference Cowling28, Reference Dennis and Ip30].
In this study, a relative viral load was defined; when the virus load V was assumed to be one for an index case on days 1 and 2 of the illness and for index case i on day d i (d i ⩾ 2) since the illness, the virus load was  $V = e^{ - (d_i - 2)}$. Therefore, in each inflight outbreak, the total infectivity of all index cases was defined as
 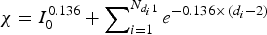 $\chi = I_0^{0.136} + \sum\nolimits_{i = 1}^{N_{d_i1}} {e^{ - 0.136 \times {\kern 1pt} (d_i - 2)}} $, where I 0 represents the total number of index cases who were in their first 1 or 2 days of illness when the flight departed,
  $N_{d_i1}$ denotes the total number of index cases who had been ill for 3 or more days when the flight departed and
  $d_i{\mkern 1mu} (d_i2)$ indicates the days since the onset of illness of index case i when the flight departed. Since the flight durations in all considered studies were <24 h, we assumed that each index case's infectivity did not change during the flight.
Outbreak data analysis
First, we performed a meta-analysis of the outbreak data, comparing the attack rate among the passengers seated in the same sections (experimental group) as and in the sections other than (control group) that of the index case(s), and among the passengers who had (experimental group) or did not have (control group) close contact with the index case(s), from both syndromic and laboratory-confirmed cases. A two-sided χ 2 test was used on the outbreak data to determine whether passengers in a certain group had a statistically significant higher infection risk than the others. A P value of <0.05 was considered to indicate statistical significance.
Second, we explored whether the attack rate had a linear relationship with the product of the flight duration and the total infectivity of the index cases, because according to the Wells–Riley equation for airborne routes, the infection risk increases linearly with an increase in the product of the ‘quantum’ generation rate (infectivity) and the exposure time when the infection risk is low (see online Supplementary material).
Results
In-flight transmission and attack rate
Table 1 summarises the number of index cases and the inflight attack rate in the 14 selected flights; in three flights, no secondary cases were reported (14, 25 (flights 1 and 2)); two of these provided evidence that in-flight influenza A (H1N1) transmission did not occur (14, 25 (flight 2)).
Table 1. Number of index patients, inflight attack rates among passengers in the same or different sections as the index patients, seated within or beyond two rows of the index patients, with and without restriction to laboratory-confirmed secondary cases infected with influenza A (H1N1) by flight
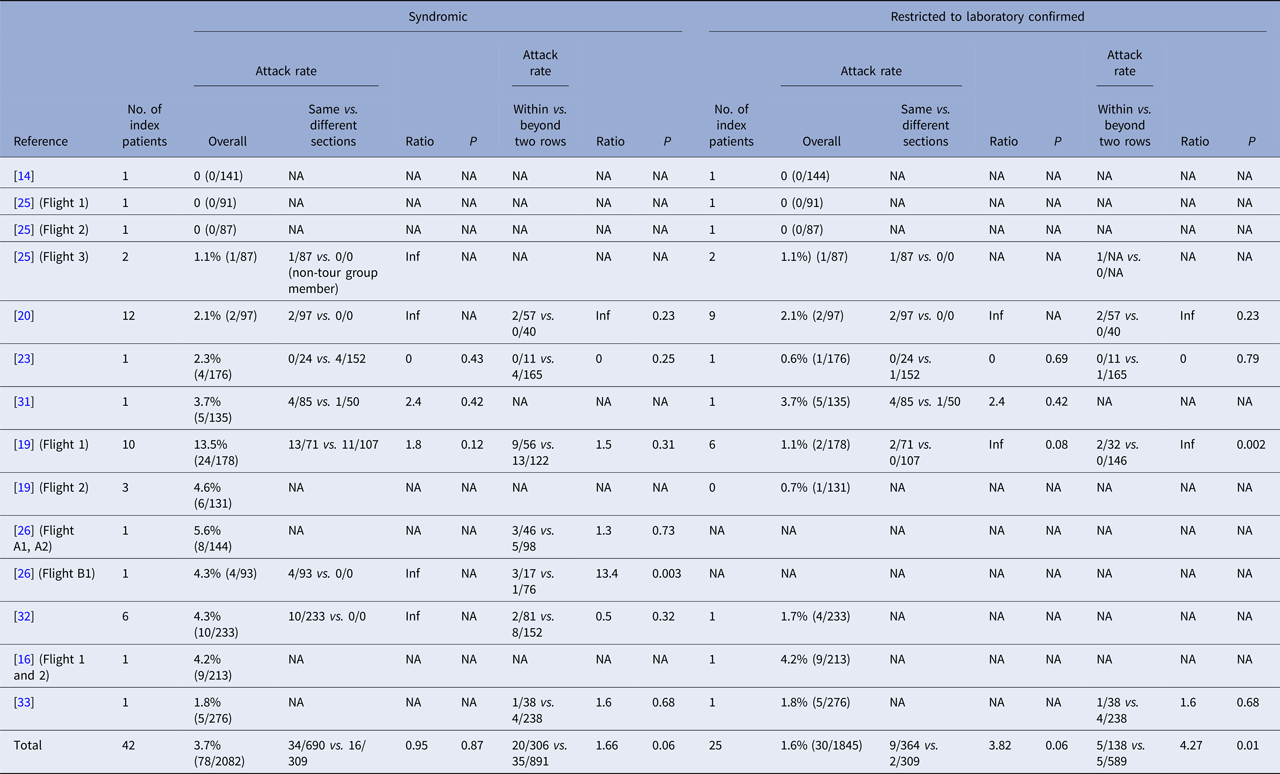
NA, not available.
For syndromic cases, the attack rates ranged from 0% to 13.5%. In total, 42 index cases infected 78 passengers among the 2082 traced passengers, leading to an estimated overall attack rate of 3.7%. In most (13/14) of the flights, the attack rate was <6%. In the case with an attack rate of more than 10% (19 (flight 1)), the interview rate was low (42%), increasing the possibility of selection bias. For the 99 passengers with section information, those within the same section as that of the index cases had a similar attack rate as those in a section other than that of the index cases (4.9% (34/690) vs. 5.2% (16/309); risk ratio 0.95; 95% confidence interval (CI) 0.53–1.70; P = 0.88). In the 55 secondary cases with detailed seat information, 20 were seated within two rows of the index cases. The attack rate for these passengers in close contact with the index cases was 1.7 times that of the passengers seated three or more rows away from the index cases (6.5% (20/306) vs. 3.9% (35/891); risk ratio 1.66; 95% CI 0.98–2.84; P = 0.08).
Restricting the analysis to laboratory-confirmed secondary cases of influenza A(H1N1)pdm09, we found that 25 index cases infected 30 of the 1845 traced passengers, leading to an estimated overall attack rate of 1.6%. Furthermore, the attack rates in all 14 flights were <5%. For the 11 secondary cases with detailed section information, nine were seated in the same section as the index cases, and the attack rate was 3.8 times higher than that of those seated in a section other than that of the index cases (2.5% (9/364)) vs. 0.6% (2/309); risk ratio 3.82; 95% CI 0.83–17.55; P = 0.07). The attack rate for these passengers in close contact with the index cases was 3.6% (5/138), whereas the attack rate of the passengers seated three or more rows away from the index cases was only 0.8% (5/589; risk ratio 4.27; 95% CI 1.25–14.54; P = 0.02).
For comparison, a forest plot for the infection risk of passengers within and beyond two rows of the index case(s) is shown in Figure 2.
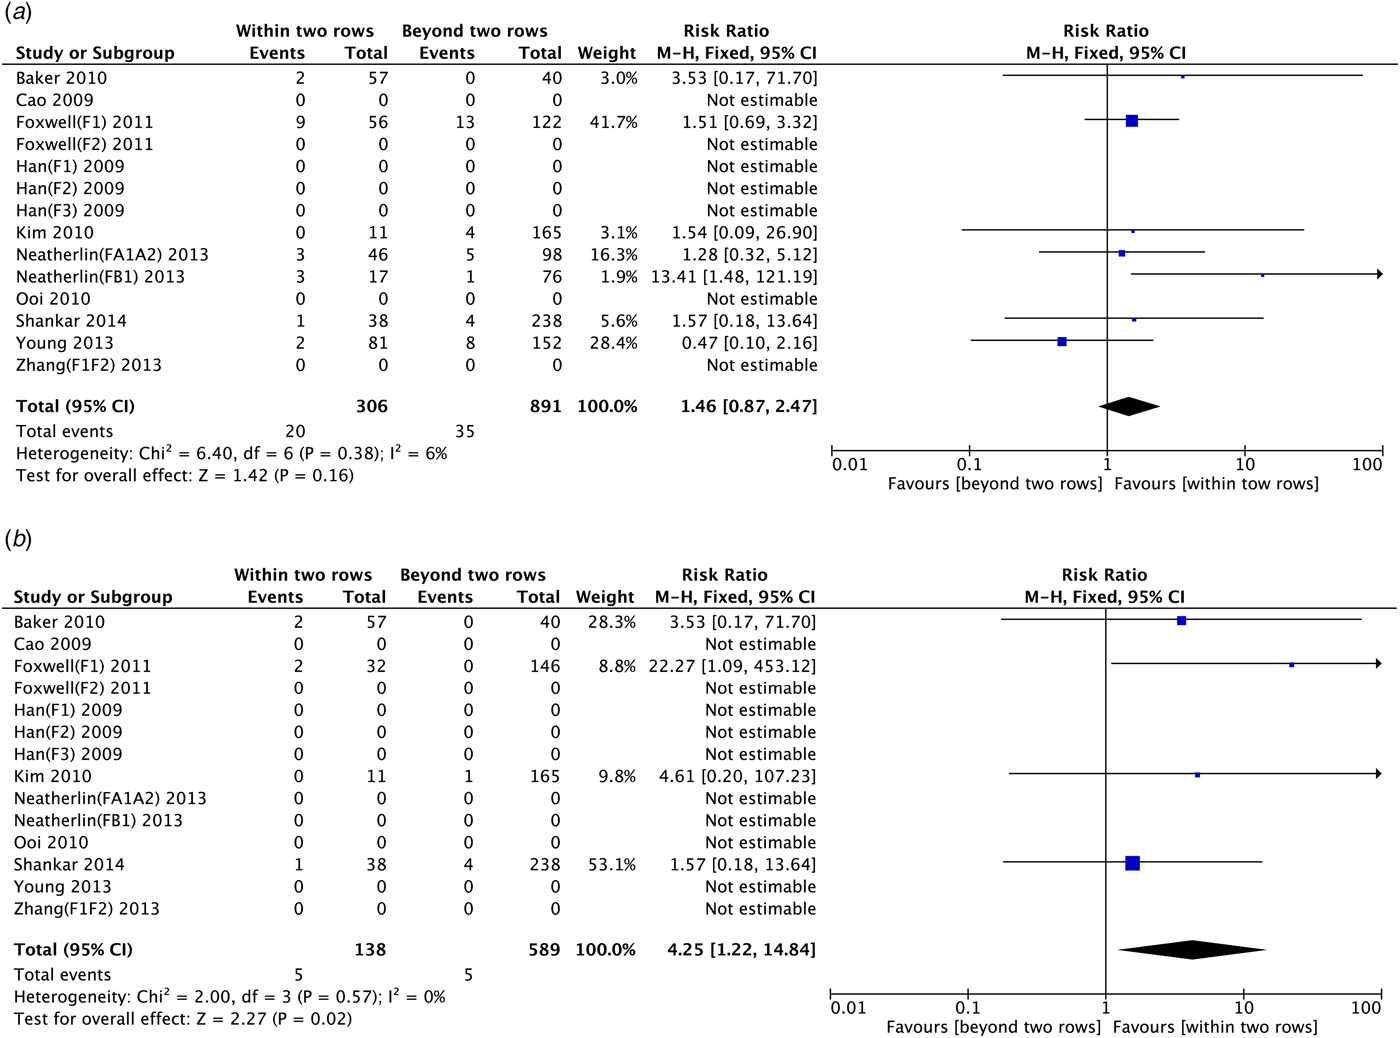
Fig. 2. Infection risk for passengers within and beyond two rows of index case(s), (a) for syndromic cases and (b) laboratory-confirmed cases.
Increase in the attack rate with an increase in the product of the flight duration and the total infectivity of the index cases
Table 2 lists the flight duration, the total infectivity of the index cases and the attack rates for all 14 flights, and Figure 3 shows that the attack rate increases linearly with an increase in the product of the flight duration and the total infectivity of the index cases. The modelling study by Wagner et al. [Reference Wagner, Coburn and Blower7] demonstrated that the longer a flight, the larger the number of infections that may be expected via the airborne route during the flight. This same result can also be derived by the Wells–Riley equation (which describes airborne transmission exclusively) when the attack rate is low (see online Supplementary material). Furthermore, the mean attack rate in the eight long-haul flights (flight duration ⩾8 h) was significantly higher than that in the six short-haul flights (flight duration <8 h; 4.2% (65/1538) vs. 2.0% (13/643); risk ratio 2.09; 95% CI 1.16–3.77; P = 0.01).
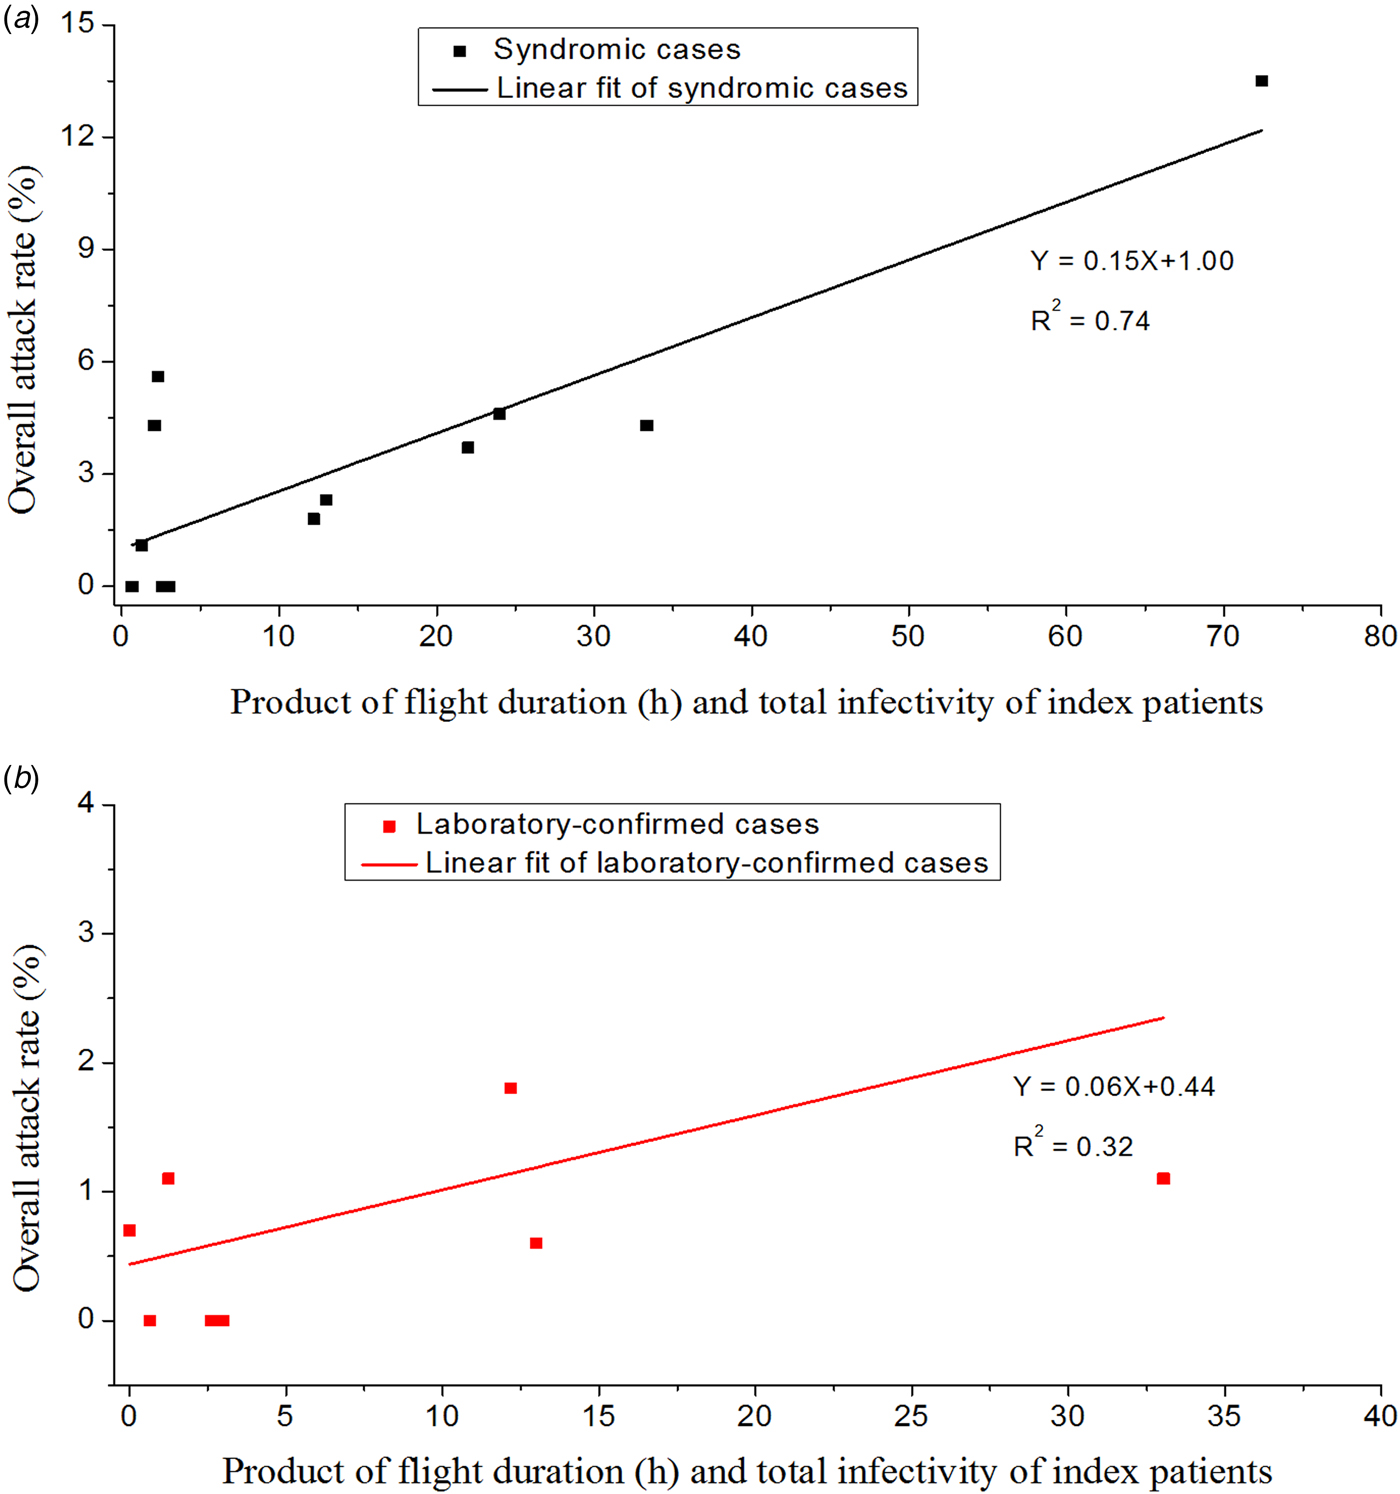
Fig. 3. Increasing attack rates when restricted to (a) syndromic secondary cases and (b) laboratory-confirmed secondary cases with an increase in the product of the flight duration and the total infectivity of the index cases.
Table 2. Flight duration, total infectivity of all index cases and attack rates by flights
Modelling studies have indicated that the attack rate will not increase linearly with an increase in the flight duration for large-droplet transmission, as being close to an infectious case even for a short period leads to an immediate high infection risk [Reference Nicas and Sun34]. In addition, for this large-droplet transmission pathway, the attack rate should increase with an increase in the total infectivity of all the index cases, but this was not demonstrated in Figure 4.
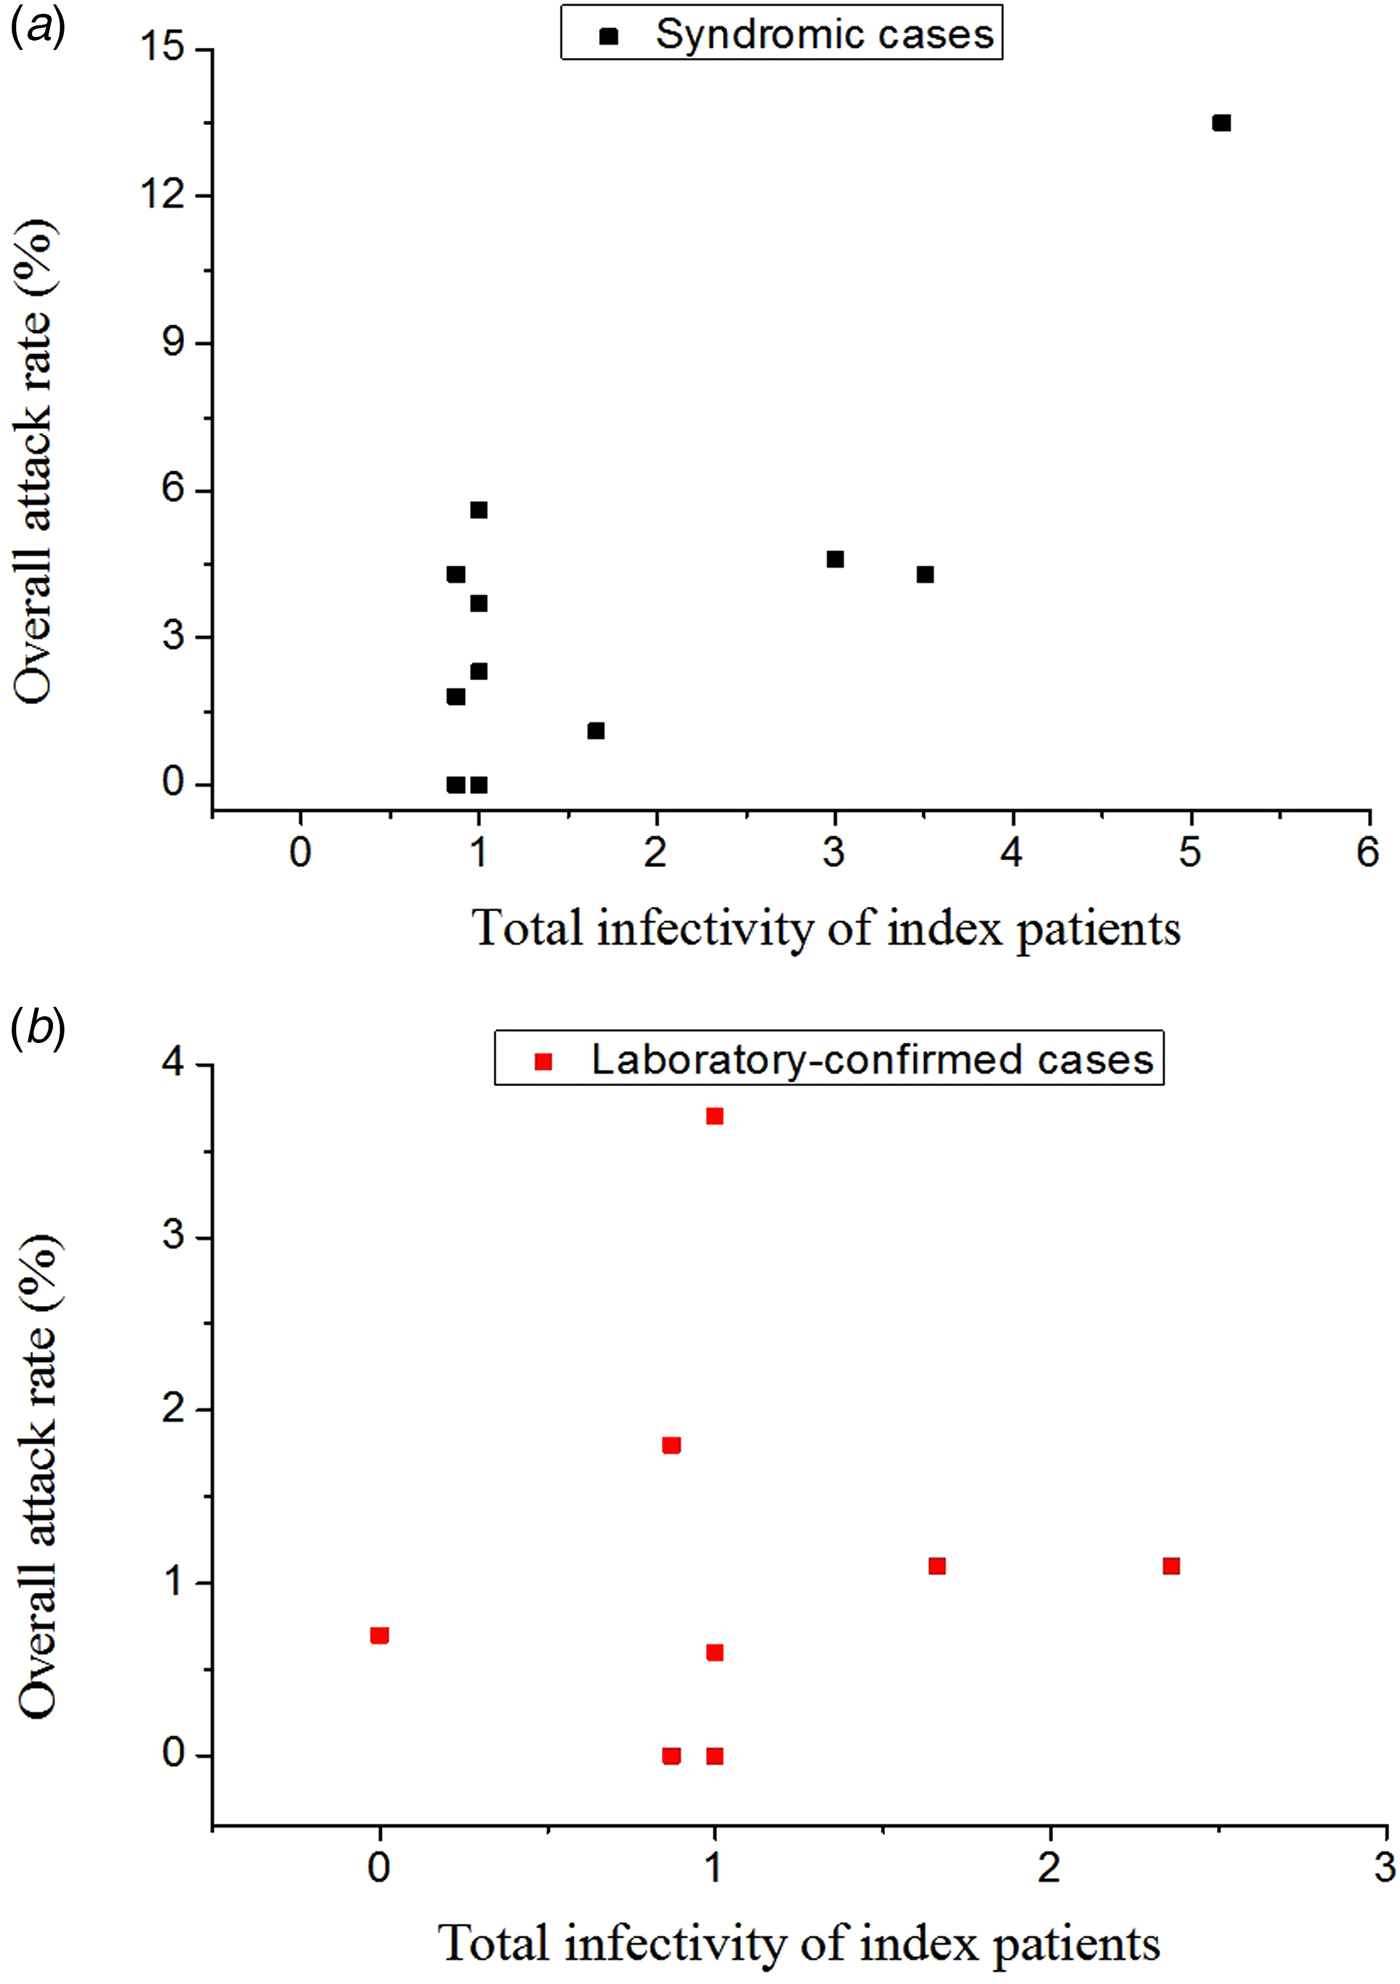
Fig. 4. Attack rates with the total infectivity of all index cases when restricted to (a) syndromic secondary cases and (b) laboratory-confirmed secondary cases.
Discussion
A literature review of influenza transmission in aircrafts provided moderate-quality evidence for inflight influenza transmission [Reference Leitmeyer and Adlhoch13], but to the best of our knowledge, thus far, no comprehensive meta-analysis of inflight influenza A(H1N1)pdm09 outbreaks has been undertaken to explore the influenza transmission routes during air travel. Although influenza transmission is very common, only a small number of inflight influenza A(H1N1)pdm09 outbreaks have been reported. This may be attributed to the fact that only during the emergence of a novel pathogen, like the influenza A(H1N1)pdm09 pandemic virus, can contact tracing be used effectively (i.e. when there are relatively few index cases present in the population) [Reference Leitmeyer and Adlhoch13].
The analysis of the data of the 14 chosen flights was a challenge due to missing, incomplete or unclear descriptions of the outbreaks. For example, a broader case definition of index or secondary cases based on ILI information might lead to an underestimation or an overestimation of inflight transmission, respectively. A standardised investigative approach, including molecular detection (e.g. the polymerase chain reaction and sequencing with phylogenetic analysis methods) of index and secondary cases and timely contact tracing of all passengers, would provide more accurate data on the passengers’ illness and location information, which is very important for identifying inflight transmission.
An additional complication is that people sitting closest to one another on a plane were more likely to be family members, friends or co-workers, who may have had extensive and intimate contact among themselves prior to boarding the flight. Although it was attempted to exclude passengers known to have interacted with the index case prior to boarding the flight, such information was not available in most cases. Without taking this into consideration, the analysis would lead to the overestimation of infection risk for passengers within two rows of the index case – as well as all passengers on the flight in general. The accurate identification of inflight-only transmission events is an essential step to analysing and understanding the influenza transmission route in order to develop effective inflight interventions (e.g. by altering the cabin ventilation design).
Implication of inflight influenza A (H1N1) transmission routes
Both airborne route and large-droplet route could lead to the close proximity infection. The difference between the proximity effect of the large-droplet route and that of the short-range airborne route can be found in the transmission risk ratio of the passengers within and beyond the two rows of the index cases. As transmission through the large-droplet route is restricted to within 2 m of the index case, susceptible passengers seated beyond two rows of the index case(s) will not be infected; therefore, the risk ratio of passengers within and beyond the two rows of the index cases is very high. In contrast, in the case of airborne transmission, this ratio is approximately 1.5–3 [Reference Liu12, Reference Nielsen35]. In this study, this ratio was 1.7 and 4.3 for syndromic secondary cases and laboratory-confirmed secondary cases, respectively, according to the inflight influenza A(H1N1)pdm09 outbreak data, which can be better explained by an airborne transmission pathway. Furthermore, 32% of the syndromic secondary cases and 18% of the laboratory-confirmed secondary cases did not even sit in the same section as the index cases; this can also be cited as evidence for airborne transmission, as suggested by another study, based on a modelling approach [Reference Wagner, Coburn and Blower7].
In terms of a mechanism of transmission, when passengers are seated during a flight, large droplets exhaled during coughing may be deposited on the back of the seat in front or beyond due to their high velocity. Face-to-face conversation was quite rare even between two passengers in the same row (if they are strangers rather than family or friends). Therefore, large-droplet transmission during air travel might be of less importance for the majority of passengers. In contrast, after being exhaled, airborne droplets with a diameter of <5 m have been proven to move mainly with the airflow in the aircraft cabin [Reference Gupta, Lin and Chen36].
From an influenza infection prevention and control angle, cough jets have an air speed of 2–20 m/s [Reference Liu12], while the typical air speed in an aircraft cabin is <1 m/s [Reference Gupta, Lin and Chen36]. Therefore, aircraft ventilation at these current rates will be ineffective in altering the trajectory of coughed large droplets. In addition, we know that ventilation is a key factor in reducing cross-transmission, from one other well-known study by Moser et al. on a 1977 influenza outbreak on a commercial airliner [Reference Moser37]. This outbreak likely occurred due to a cessation in aircraft ventilation, resulting in an attack rate of 72%. This is considerably higher than the mean attack rate (1.6% for laboratory-confirmed secondary cases) of the 14 inflight transmissions identified in this study when all the ventilation systems were operating during these flights. Another study on an inflight influenza A(H1N1)pdm09 outbreak showed that purely large-droplet precautions (i.e. wearing a face mask) were ineffective [Reference Han25] in preventing cross-transmission.
Limitations
This study has several limitations, mainly related to the way the original studies were reported and the lack of some key data. First, the possibility of immediate pre-flight exposure and transmission cannot be excluded, such as in the lounge or during check-in. Therefore, not all identified ‘secondary cases’ would have necessarily acquired their infection during the flight from an in-flight index case. This may have led to an overestimation of the number of secondary cases arising from a single, inflight, index case. Second, the studies selected for this analysis may have exhibited possible tracer bias, i.e. passengers who became ill might have been more likely to be traced, e.g. if they were more active in coming forward to declare their illness. Third, and perhaps most importantly, the heterogeneous manner in which the considered studies were conducted and reported resulted in many data gaps, limiting the accuracy of any meta-analysis, such as this one, e.g. by poor or unclear definitions of index and secondary cases. The widespread use of ‘ILI’ as a largely unconfirmed clinical indicator of an index or secondary case may have led to an underestimation or an overestimation of inflight transmission, respectively.
It is towards this end that we call for a more standardised approach to the reporting of such inflight outbreak investigations – to not only more accurately analyse individual outbreaks, but to allow future meta-analyses, such as this one, to be performed more accurately as then, the original studies will have recorded all the necessary data required.
Conclusions
According to the meta-analysis of 14 inflight influenza A (H1N1) transmission cases, we believe that there is sufficient evidence to be concerned about some secondary cases of influenza A (H1N1) arising via the airborne route during air travel, although the exact number and proportion of all the secondary cases may vary because of the differing environmental and the baseline immune status of passengers who were exposed. This study did not support the WHO guideline regarding contact tracing only the passengers seated within two rows of the infectious cases of influenza; otherwise, more than half of the secondary cases would not be traced. From a purely infection control aspect, it is difficult to exclude any passengers from exposure where the pathogen of concern is potentially transmissible via the airborne route, with the potential to spread throughout the cabin before being filtered out via the aircraft ventilation system. Ideally, in such an exposure scenario, all passengers in the cabin should be contacted and monitored for the development of disease. However, we acknowledge that this may not be practical or possible. Allowing for variable baseline immunity for non-novel pathogens, and the air volume dilution (which increases as the cube of the distance away from the identified index case), we propose that contact tracing to at least twice the current WHO recommendation, i.e. to four rows either side of the index case, would be a reasonable compromise to begin with. However, even with this extended contact tracing zone, additional secondary cases may arise if the pathogen is truly airborne, from well beyond this zone. Public health teams should therefore keep this possibility in mind during their investigations and not necessarily discount this link to a flight-related index case, where the incubation period allows this as a possibility for non-novel pathogens.
Supplementary material
The supplementary material for this article can be found at https://doi.org/10.1017/S0950268818001772.
Acknowledgements
This work is supported by an RGC CRF grant (No.C7025-16G) and an RGC TRS grant (No. T11-705/14-N) of the Hong Kong SAR Government.
Conflict of interest
None.


