


Introduction
In December 2019, a novel coronavirus disease 2019 (COVID-19) emerged in Wuhan, China [Reference Hui1], and has since spread out to the rest of the world, evolving into a pandemic [Reference Worobey2]. Due to its high infection rate, the severe acute respiratory syndrome-coronavirus-2 (SARS-CoV-2) is not only causing mortality, but it is also stressing national health systems due to the large number of infected people that need hospitalisation [Reference Melo3], and causing a profound economic impact [Reference Miller4–Reference Kawohl and Nordt6]. In the absence of an effective treatment for COVID-19 or a complete vaccination plan, the role of public health measures mostly comprehends the so-called non-pharmaceutical interventions (NPIs) [Reference Ferguson7], including social distancing and isolation, reducing economic activities, enforcing home office, moving to remote classes and closing social venues where people tend to agglomerate in close proximity. Initially, sanitary authorities opted for strict NPIs. As the pandemic evolved, other factors emerged and started an interplay with the health crisis. Therefore, measures were revisited and, often times, relaxed. However, a critical question is still unresolved: What is the impact of reopening the school system for in-person classes [Reference Lordan, FitzGerald and Grosser8, Reference Panovska-Griffiths9]?
When to start reopening schools and the reopening policy are particularly important questions for multiple reasons: (i) education is a basic human necessity; (ii) in-person classes enable other economic activities because parents can go to work while their children are at school [Reference Viner10], besides other markets associated with schools, such as transportation, food, clothing, among others; (iii) in-person classes are often hard to replace with online learning, especially in developing countries and for impoverished families, due to lower availability of broadband Internet and fast laptop computers with cameras; (iv) due to the relatively long time children spend in proximity to each other in schools, the potential for exposure is much higher, requiring several workarounds to reduce the transmission rate [Reference Vermund and Pitzer11], especially because young people tend to be asymptomatic while still being contagious [Reference Hildenwall12], which increases the chances of an exponential transmission growth, thereby requiring additional quarantines to prevent a health system collapse and (v) a well-crafted policy for returning to school may help preventing new waves of the pandemic, save lives and reduce the amount of psychological stress due to the health crisis [Reference Psychiatry13]. To understand the impact of the pandemic on schools and analyse proposed policies to deal with it, mathematical and computer simulation modelling is crucial [Reference Metcalf, Morris and Park14].
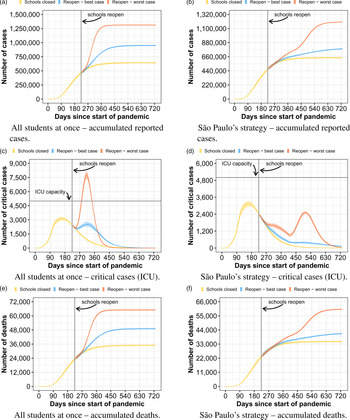
In this study, we set out to evaluate a range of strategies for reopening the school system of the São Paulo Metropolitan Area (SPMA) using computer simulation. We chose this region as a case study because Brazil is one of the current epicentres of the pandemic [Reference Barberia and Gómez15, Reference Mellan16], and the SPMA is the most relevant of the country due its huge population and economical importance. The region contains 39 cities and 21.7 million inhabitants, representing about 10% of Brazil's population [17]. We analyse three different strategies of school reopening: (i) reopen schools with all students at once; (ii) reopen schools following a strategy based on the official plan of the São Paulo government [18], which consists of three stages, carefully increasing the amount of students in each stage and (iii) reopen schools only when a vaccine becomes available. We show results regarding the total amount of COVID-19 cases, critical cases and number of deaths.
Materials and methods
In this section, we describe our model and its assumptions. We developed a stochastic compartmental model that includes a heterogeneous and dynamic network [Reference Enright and Kao19–Reference Graham and House21], which allows us to describe different types of relations between people, each type with a different infectiousness. In this way, we can better depict real life relations, reducing the issue of purely homogeneous random mixing of the population present on most compartmental models [Reference Abou-Ismail22]. The model was implemented as a simulator, called Corona++, written in the C++ programming language, which was chosen due to its high performance, low overhead and powerful object-oriented features. The network was modelled as an undirected weighted graph G = (V, E), in which the vertices V represent the people and the edges E the relations between people, which have an infection probability. Given two people v 1 and v 2, such that v 1 ∈ V and v 2 ∈ V, if we have an edge e ∈ E such that e = (v 1, v 2), the person v 1 can infect the person v 2. To support heterogeneous infection probabilities, we colour the edges of the graph, such that we can attribute different infection probabilities for each colour. The colour represents the type of relation. Although it is possible to have any kind of relations modelled, for this study we modelled the following relation types: home, community, workplace, schools and inter-city.
Since our model supports heterogeneous networks, it can provide more accurate results [Reference Britton, Ball and Trapman23]. Each person can have an arbitrary number of edges in the graph, and the relation type (colour) of each edge is also arbitrary. Therefore, as in real life, each person can have different infection probabilities depending on the number of relations they have, as well as the type of each relation. Since each person has a different infection probability, each person also has a different basic reproduction rate (R 0). Therefore, to set the overall R 0, we calibrate the infection probabilities over the entire network such that the average R 0 among all people is equal to the target value. As our model supports dynamic networks, we can change relations at any time during the simulation. We are able to modify the infection probabilities, as well as add and remove edges from the graph. The usage of heterogeneous and dynamic networks allows us to better evaluate non-pharmaceutical interventions (NPIs).
We based our model on the SEIR compartmental model [Reference Abou-Ismail22], but extended it to support more compartments. Each person can be in one of the following states:
Susceptible The person can be infected.
Infected The person is currently infected. An infected person can have different sub-states, as we will explain later.
Immune The person is immune, either from recovering from the disease or from taking a vaccine. The person will not contract the disease anymore.
Dead The person died.
As for infected people, each one can be in the following sub-states:
Incubation The person was infected but has not developed any symptoms yet and is not contagious.
Unreported The person is contagious but either is asymptomatic or has such light symptoms that it does not receive any health care. This person, in real life, would not be part of any official statistics, hence a sub-notified case.
Pre-symptomatic The person is contagious, but has not developed any symptoms yet.
Mild The person has mild symptoms and can recover at home.
Severe The person has severe symptoms and requires health care in a hospital.
Critical The person has critical symptoms and requires health care in an intensive care unit (ICU). After recovering from critical symptoms, the state is set to severe.
The disease spreads from infected people to susceptible people according to the infection probability of each edge in the graph, which is evaluated using a Monte Carlo-based approach. The probability of a susceptible person to get infected in a simulation cycle is given by Equations 1−4. The infection model works as follows:
Given a network represented by graph G, and the population and relations represented by the vertex set V and edge set E, respectively:

Given a person P of the population, Equation 3 defines function N(P), which returns the set of people that have a relation with P that are infected.


Finally, in Equation 4, the function InfectProbability(P, n) returns the infection probability between person P and person n in the network. We first calculate the probability of a person not getting infected by any other infected person that has a relation, and then subtract it from 1 to calculate the probability of a person to get infected.

In the simulation, we consider all the cities and population that comprehend the SPMA, including the demographic distribution. Data used to set the simulation parameters were extracted from the literature and official available data, and the sources are provided in the supplementary material. We consider that there are 5000 ICUs available for COVID-19 [24] in the SPMA. However, in the simulations, we assume that the health system is always able to handle the demand and hence no one dies from health system collapse. Therefore, it is important to note that the number of deaths reported in our results is lower than what would be expected when the ICU usage is higher than 100%. We modelled it like this in order to be able to evaluate the peak ICU requirement.
Since our model is stochastic, each execution of the programme generates a different network and a different disease transmission sample path. Our results are derived from 100 executions for each experiment. We show the interval between the 10% and 90% quantiles, as well as the median. The numeric values used in the discussion about the results correspond to the median. A comprehensive discussion on the simulation parameters, how we generate the relation network, how we modelled interventions, such as quarantines, the reopening of schools and economic activities, and vaccination, as well as figures containing additional results, can be found in the supplementary material. In the next section, when interpreting our results, it is important to consider all of our assumptions and that any model represents a simplification of reality, such that we need to focus on the general trend of the results, not the absolute values themselves.
Results and discussion
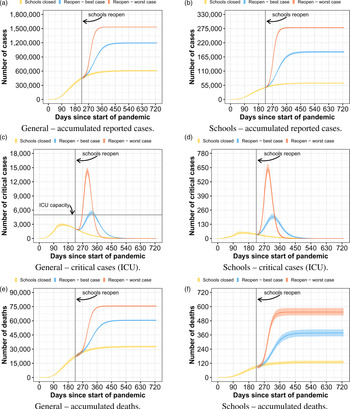
In the first strategy, we evaluate what could happen if all students went back to school at once, but following sanitary measures, such as wearing masks and frequently washing their hands. Figure 1 presents the results for this scenario. In the left column, we show results regarding the general population of SPMA. In the right column, we show results regarding only people that attend school, students and teachers. The results considering the sub-population of teachers and families of people that attend school can be found in the supplementary material. Predicting how much the infection probability in schools differs from the infection probability in the community is a difficult task. Similarly, it is nearly impossible to predict how strictly students will follow the sanitary measures. Consequently, we evaluate two different infection probabilities in schools: a best-case and a worst-case scenario, in which the school infection probabilities are 2 and 4 times the community infection probability, respectively. Also, for these results, we consider a 50% social isolation level inside the same classroom (we consider two students as isolated when they do not have any contact with each other, and therefore have no relation between them in the network). We show results regarding the expected number of reported COVID-19 cases, critical cases, which require ICU for their treatment, and number of deaths. In all results, day 0 corresponds to 26 February 2020, which is the date corresponding to the first documented case in Brazil. School reopening is set to day 224, which corresponds to 7 October 2020, which is when the São Paulo State first attempted to reopen schools.

Fig. 1. Curves of infected people when schools reopen with all students at once.
When reopening schools without any kind of constraint on the number of students per classroom, using its total capacity, there is a high potential for an uncontrolled pandemic growth, such that, in our scenarios, we estimate an increase of the number of reported COVID-19 cases by up to 152% and number of deaths by up to 131% compared to when schools do not reopen, with a peak of ICU usage of 286%. Therefore, the health care system would probably collapse in case all students returned to school at once. By analysing the data only in the school sub-population, we first note that the ratio of critical patients and deaths are small compared to the entire population. While the average death rate of reported infected people in the population was 4.9%, the death rate in the school sub-population was only 0.2%. This is because most students are young and, according to the official COVID-19 statistics, younger people have a smaller probability to develop the critical symptoms of the disease. Nevertheless, we can observe that the COVID-19 reported cases among people that frequent schools increase to up to 4.4× when compared to the scenario where schools do not reopen. This result indicates that, although the reopening of schools with full capacity should not present a huge risk for most of the students, students act as vectors of the virus, causing a big impact in the entire metropolitan area. It is also important to remember that if we had considered that people in critical state that do not receive ICU treatment dies, the amount of deaths would be much higher due to the probable collapse of the health system if this strategy were adopted.
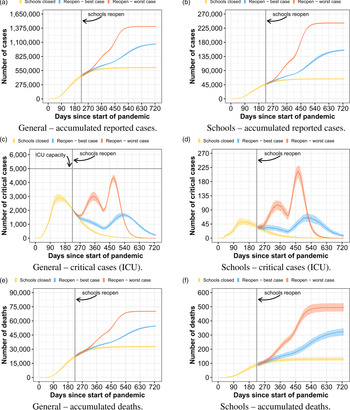
In the second strategy, we analyse a school reopening strategy based on the plan of the São Paulo state government [18]. The plan consists of three stages. In the first stage, about a third of the students per class attend school each day. In the second stage, about two thirds of the students go to school. In the last stage, all students go back to school. Every student and professional must obey sanitary measures such as wearing masks and frequently washing their hands. In our evaluation, stage 1 lasts 4 weeks and stage 2 lasts 20 weeks. The results of using this strategy are depicted in Figure 2, following the same organisation of the previous strategy (Fig. 1). For this experiment, we consider an isolation level of 50%. Compared to when all students go to school, the tendency is to have a small reduction in the total number of cases, but with a longer lasting pandemic. Our model predicts that the total number of reported infected people, in the worst case, reduces by 8%. This translates to 7% fewer deaths, disconsidering the deaths not accounted due to the collapsed health system of the first strategy. As the new infections are spread over a longer period of time, there is a drastic reduction of the critical patients peak, such that the health system could be able to handle the demand in our scenario.

Fig. 2. Curves of infected people when schools reopen following São Paulo's strategy.
The results only considering the school sub-population follow the same trend of the general results. Considering the worst case, we assess the number of reported cases may be reduced by 13% and the number of deaths by 11% compared to when all students go to school. Regarding the deaths expected for the worst case inside the school sub-population, 67.7% of them correspond to teachers. Although there are many more students than teachers, teachers are older than the students, and hence have a higher mortality rate. If students strictly follow the sanitary measures, as considered by the best case, the difference between opening the schools with all students or with São Paulo's plan is lower, but still very significant. Overall, results show that, although the difference in the number of cases is low compared to when all students come back at once, using a reopening strategy with several phases could possibly avoid the health system collapse, which would have a big impact in the actual number of deaths. It is important to note that the success of such strategies depends on how the entire population would follow the sanitary measures. Note also that, in our evaluation, before reopening schools, the pandemic has a consistent decrease in the number of new cases and a comfortable ICU availability.
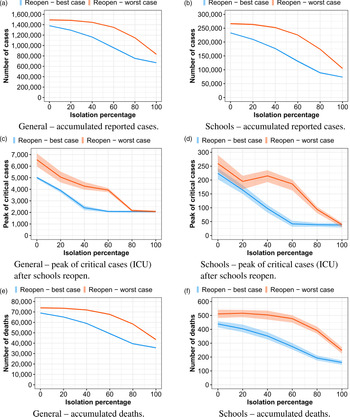
In Figure 3, we analyse several isolation levels for the São Paulo strategy. An isolation level of 100% means that students inside the same classroom have no interaction between each other, while an isolation level of 0% means that each student is able to infect any other student inside the same classroom. As in previous experiments, we evaluate two different infection probabilities. If students follow the social distancing and sanitary measures very strictly, with a 100% isolation, we expect to be 44% less reported cases than students have a 0% of isolation, reflecting in 41% fewer deaths. Although 0% and 100% isolation levels may be infeasible, there is no way to predict which isolation level would be achieved. If we compare an 80% isolation to a 20% isolation, the number of deaths could be reduced by up to 20%. While comparing a range from 60% isolation to a 40% isolation, the number of deaths could still be reduced significantly, by 6% in the worst case. Even with only a 20% isolation, although the amount of deaths is still high, the maximum number of required ICUs after schools reopened was estimated to be only a little higher than the capacity of SPMA, considering the controlled reopening. As expected, the results show that student behaviour is a key factor for the success of this strategy. The major problem is that there is no way to predict how students are going to behave.

Fig. 3. Curves of infected people when schools reopen following São Paulo's strategy, evaluating different isolation levels.
We also analysed the case of children and young people, who are less than 20 years old, presenting a lower transmissibility. Although the scientific community still has not reached a conclusion, there is some evidence that children are less likely to transmit the virus [25], and we believe it is important to consider this possibility, as it directly affects the transmission dynamics inside schools. Figure 4 shows the results of reopening schools with all students at once and following São Paulo's 3 phase strategy. We consider children and young people transmissibility to be 63% of adult transmissibility [Reference Dattner26]. The results show a large reduction in the health system pressure, as well as a lower (but still significant) reduction of the total number of cases and deaths. This happens because the spread of the virus takes more time, spreading more the critical cases and also because the overall reproduction rate inside schools gets lower, such that herd immunity is achieved with a lower number of immune people. Nevertheless, in the worst-case scenario of reopening schools with all students at once, the health system still collapses. In the supplementary material, we also evaluated the scenario of all unreported cases having a lower transmissibility (63% [Reference He27]), but in this case, results were very similar to the ones with a homogeneous transmissibility. This happens because there is less difference in the transmission dynamics inside schools compared to the previous case, where only children and young people have a lower transmissibility.

Fig. 4. Curves of infected people considering a lower child and young people transmissibility.
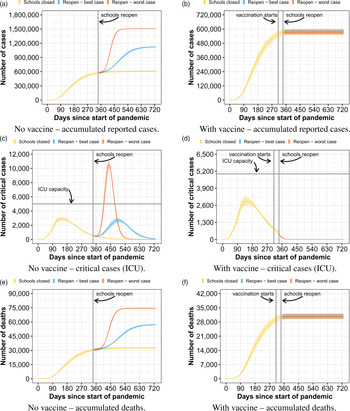
The last strategy we evaluate, shown in Figure 5, is to return to classes and reopen schools only on day 341, which corresponds to 1 February 2021. We consider that all students return to school and follow sanitary measures (masks and hygiene). For this strategy, we analyse two different scenarios: (1) no vaccines are available; (2) vaccines are available since day 310 (1 January 2021). For the vaccines scenario, the vaccines are administered with a procedure divided into four phases, in the following order: people who are over 50 years old, teachers, students and, finally, the rest of the population. We consider that 300 000 [28] people can receive the vaccine per day, with a vaccine effectiveness rate of 80%, and that the vaccine takes 14 days to generate the individual immune response.

Fig. 5. Curves of infected people when schools reopen with all students on day 341.
The most important thing to note is that, in the scenario without vaccines, regardless if schools reopen on day 224 or 341, reopening schools with all students at once has a deep impact in the number of cases, deaths and health care system. On the other hand, with the vaccines, we can observe that schools could be reopened without any major concerns about ICU beds availability, considering the explained vaccination parameters. In this case, tens of thousands of lives could be saved compared to the previous controlled reopen strategy considering a worst-case scenario. Besides the overall immunity of the population, by prioritising teachers and students, we are able to cut the transmission chain of COVID-19 inside the schools. In the supplementary material, we added another vaccination scenario, where vaccination starts on day 369 and schools reopen day 400 – two months difference to the current scenario. There is no significant change in the pandemic behaviour.
It is important to clarify the limitations of our analysis. First, although our simulation model is well suited for this kind of analysis, we recognise its constraints and the difficulties of finding proper parameters for it, such as the number of community relations per people, students per classroom and schools, as well as people per company. However, we evaluated these parameters with different values and the tendency of our results remained the same. Also, the type of relations that we model represent only a part of the type of relations that exist in real life. The subset of relations we chose to model was selected to get a reasonable balance between accuracy and model complexity, and it is consistent with other works [Reference Panovska-Griffiths9, Reference Kerr29]. The relations network needs to be carefully created to avoid (or at least reduce) the issues of random mixing present in models that do not implement a network. To also avoid overcomplicating our model, for people that are asymptomatic or have very light COVID-19 symptoms, there is 0% chance of being detected (thereby is an unreported case), while people with more symptoms have 100% chance of being part of the official statistics.
Despite the fact that we gathered most of the data used to configure the simulation environment from official sources and literature, another limitation of our study is that the data have a significant amount of noise, as there is a lot of sub-notification, and due to the uncertainties of COVID-19. Furthermore, the census data used in our study is from the year 2010 (it is the last census currently available in the country). We extrapolated the census data to match the estimated population size of 2019.
Our analysis is valid only considering all assumptions we made. Knowledge about the virus, the dynamics of the disease, as well as social variables in general, evolve and hence may lead to different outcomes. However, the overall trend of the results are likely to remain the same if small deviations in the parameters occur. Because of these issues, we are more interested in the overall trend than in the absolute values themselves. Furthermore, new variants of the virus, with a higher transmissibility or that escape from previous acquired immunity, or if the population stops following the sanitary measures, it could lead to an uncontrolled situation regardless of the school reopening strategy. Despite all these limitations, we believe our findings can help us better understand the challenges we face by reopening schools during the COVID-19 pandemic.
Conclusions
By analysing all strategies, we conclude that reopening schools with all students at once during the COVID-19 pandemic is a strategy that imposes a high risk, such that any government that adopts it should proceed very carefully. In our worst-case scenario and in the range between the worst case and best case, our results indicate that it can lead to a collapse of the health care system and thereby to the need of further quarantine periods, which could have a catastrophic impact on economics. On the other hand, in the best-case scenario, which considers that students, as well as the general population, would strictly follow sanitary and social distance measures, our results show that the peak ICU usage would be only marginally higher than the health system capacity, which could perhaps be expanded to handle these few extra patients.
It is also important to note that the students, due to their age, are the least affected by the reopening of schools, proportionally speaking. However, they can act as infection vectors, causing massive spreads to more sensitive people, such as their family and teachers.
Adopting a controlled reopening, with several stages, carefully increasing the number of students, it is notorious that it is able to reduce the speed of the spread of the virus, such that it could keep the maximum ICU usage under its limits and hence the health care system could possibly be able to handle the demand of new cases (considering a 50% isolation inside schools and that the population in general follows the sanitary measures). Finally, by reopening schools only when vaccination campaigns become available for the entire population, within the SPMA alone, we estimate that tens of thousands of lives could be saved compared to a controlled strategy in a worst-case scenario. Since we are likely within a few months of getting most of the population vaccinated, we consider the last strategy the most appropriate.
Supplementary material
The supplementary material for this article can be found at https://doi.org/10.1017/S0950268821001059
Acknowledgements
This research was partially supported by a machine allocation on the Kabré supercomputer at the Costa Rica National High Technology Center. We would like to thank Marco A. Amato for reviewing an earlier version of this paper.
Financial support
This work received no direct funding.
Conflict of interest
Conflicts of Interest: None.
Data and materials availability
Repository address of the simulator source code and input data: https://github.com/ehmcruz/corona


 Open access