


Zika virus infection in humans has changed in character from an endemic self-limited mild illness to an epidemic disease [Reference Kindhauser1]. Developing accurate tools to predict Zika infection spread is required for early prevention of the disease [Reference Huff2]. The purpose of this analysis is to explore whether web-based query could effectively predict Zika virus spread.
On 2 October 2016, Pan American Health Organisation (PAHO) released an epidemiological report of Zika virus in different countries [Reference Mitchell and Mitchell3]. Each report contains the number of confirmed and suspected cases in each country as reported by Ministry of Health in these countries. For our analysis, we selected Colombia and Brazil because there was continuous monitoring for both confirmed and suspected cases. In addition, both countries were considered as most epidemic countries in South America. PAHO report for Brazil included both suspected and confirmed cases from January 2016 to 9 July 2016, which corresponds to the first epidemiologic week of 2016 till the 27th epidemiologic week of 2016. For Colombia, the report had data from 9 August 2015 to 21 May 2016, which corresponds to the 32nd epidemiologic week of 2015 to the 20th epidemiologic week of 2016. We used Webplotdigitiser software to extract the weekly confirmed Zika cases of Brazil and Colombia [Reference Rohatgi4]. We only extracted confirmed cases not suspected nor reported cases to avoid overestimation of the epidemic. That is because the case definitions for Zika suspected included rashes with one of the following symptoms: fever, usually <38.5 °C, conjunctivitis (non-purulent/hyperaemic), arthralgia, myalgia and peri-articular oedema with the history of travelling to one of the epidemic areas [Reference Sanchez and Sanchez5]. These criteria are similar to many infectious diseases that caused reporting of a huge number of Zika cases, mainly suspected cases, while confirmed Zika cases represented only a minimum of these numbers. This can be proved by epidemiological reports released by PAHO in October 2016 in which we noticed a big difference between reported and confirmed cases. We used only confirmed cases to avoid overestimation of the epidemic because we have noticed a big difference between confirmed and reported cases that will affect our results.
To get the web search volume for the word Zika in this specific time period, we used Google Trends (https://trends.google.com/trends/) to get the weekly search volume for word ‘Zika’, termed Zika query. We did not use other words for signs and symptoms of Zika because it was similar to other diseases that can cause misjudgement of search volume. The steps of searching the Google Trends and processing the query data for the analysis are explained in the Supplementary video 1.
We used a standard time-series regression (TSR), particularly the Poisson distributed lag model (PDLM) to examine the association between weekly Zika cases (i.e. the outcome) and weekly Zika query (i.e. the predictor). A quasi-Poisson distribution of the outcome is assumed to account for the overdispersion (the presence of expected increasing variance among the data). We also considered important features of the application of TSR to infectious diseases, such as the lag association (e.g. the last week Zika query could be associated with this week Zika cases), the strong auto-correlations and the controlling for the long-term trend. These features are discussed in detail in Imai et al. [Reference Imai6]. This model has been considered the best in the prediction of dengue cases when compared with other models including standard multiple regression model (SMR) and seasonal autoregressive-integrated moving average model (SARIMA) [Reference Phung7].
The general model is specified as follow:
 $$Y_{t\sim}{\rm quasi} - {\rm Poisson(}\mu _t{\rm )}$$
 $$\eqalign{{\rm \; \; \; log}\,\mu _t{\rm \;} \; \; = & \alpha + \beta _1\; {\rm Lag}\; \,E_{t - k} + \beta _2{\rm time} + \; \beta _{{\rm AC}}{\rm AC}\; {\rm \;} \cr {\rm =} & {\rm Basis}\,{\rm TSR} + \beta _{{\rm AC}}{\rm AC},} $$
where Y t is the weekly Zika count on week t, μ t is the mean parameter of the Poisson distribution, alpha (α) is the intercept, and Lag E t−k is the Zika query in week t minus lag k (k = 0, 1, 2, 3).
Time is a variable that takes consecutive numbers ranging from 1 on the day on which observations began to 27 on the final day of the observation period in Brazil data, and to 41 in Columbia data. The time variable was used to control the long-term trend in Zika cases (assumed an increase linear trend) following Bhaskaran et al.’s method [Reference Bhaskaran8]. AC stands for the auto-correlation term. We invite the reader to refer Imai et al. for the nature of the technical details of this model [Reference Imai6].
We used R software version 3.4.3 for all the described analyses [9]; we used Epi [10], tsModel [11] and bbmle [Reference Team and Core12] packages.
In total, seven different models were constructed, and the performance of them was validated based on the dispersion value, which was used for the evaluation of the model as reported by Imai et al.[Reference Imai6] (i.e. the smaller the dispersion value, the better the model in predicting Zika cases). The seven constructed models for each country with their dispersion values are described in Supplementary Tables S1 and S2.
In addition, we also conducted a sensitivity analysis to determine whether the results were dependent on modelling choices. We replaced the time variable by the peak indicator variable (i.e. two values: 1 indicates high-peak weeks, 0: otherwise). The high-peak weeks were defined as the weeks containing Zika case counts greater than the median value of Zika case counts of the whole study period.
The best model in predicting Zika cases in Brazil was the model with basis TSR, including lag zero of Zika query plus lag one of Zika cases as controlling for auto-correlation (i.e. TSR lag (Zika, 0) + AC: lag (log (Y + 1), 1)) (Supplementary Table S1). Whereas the model with basis TSR, including lag one of Zika query plus lag one of Zika cases as controlling for auto-correlation came into second (i.e. TSR lag (Zika, 1) + AC: lag (log (Y + 1), 1)). Similarly, the best model in predicting Zika cases in Colombia is TSR lag (Zika, 0) + AC: lag (log (Y + 1), 1), and the model TSR lag (Zika, 1) + AC: lag (log (Y + 1), 1) took second place (Supplementary Table S2).
For the real application, the model that can predict Zika cases in future would be preferable. Therefore, in this study, we would recommend using the model TSR lag (Zika, 1) + AC: lag (log (Y + 1), 1) in predicting Zika cases in Brazil and Colombia because it balanced the performance of the model and the advance time of prediction. The pattern of observed Zika cases and predicted Zika cases using the model TSR lag (Zika, 1) + AC: lag (log (Y + 1), 1) in Brazil and Colombia is shown in the (Fig. 1). The correlation coefficients are 0.986 and 0.918 in Brazil and Colombia, respectively, indicating a good predictive capacity of the models. The results of sensitivity analysis were consistent with the results of the original models, suggesting that our results are robust and not likely affected by modelling choices.
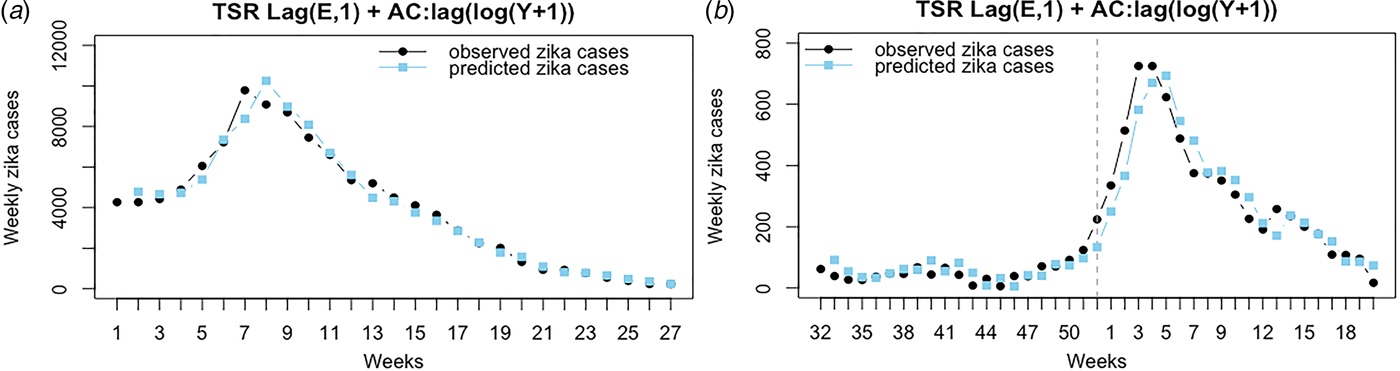
Fig. 1. The figure shows the pattern of observed Zika cases and predicted Zika cases using the model TSR lag (E, 1) + AC: lag (log (Y + 1), 1) in Brazil (a) and Colombia (b). (a) Brazil, basis TSR model with lag one of Zika query as a predictor and the lag one of log value of Zika case as controlling for the auto-correlation. (b) Colombia, basis TSR model with lag one of Zika query as a predictor and the lag one of log value of Zika case as controlling for the auto-correlation. The vertical line defines years 2015 and 2016.
Our study explored the possibility to use Google Trends as a low-cost available Zika bio-surveillance system in developing countries. Our model was robust for the prediction of Zika in the two countries 1 week in advance, which can help to activate timely vector control by local authorities, and community-based preventive measures. It has been shown that Zika followed the same time period and geographic distribution of dengue and Chikungunya viruses in Brazil [Reference Benelli and Mehlhorn13, Reference Cardoso14, Reference Roth15]. This is because of the concurrent transmission of these viruses by the same vector. In addition, the model can be used for monitoring other arboviral diseases. After current tropical urbanisation, increasing global transportation and global warming, there is a spread of Aedes spp. to other regions in the world [Reference Weaver and Reisen16]. With the presence of these vectors plus the circulating arboviruses in human blood, this will be adequate for another arboviral-emerging disease [Reference Weaver and Reisen16]. More arboviral diseases are expected in the literature to be the next global outbreak including Venezuelan equine encephalitis virus, Mayaro and Oropouche [Reference Rodríguez-Morales17]. Venezuelan equine encephalitis virus had the same symptoms of Zika including rash, fever, headache, myalgia and arthralgia. The similarity between the symptoms of Zika, Chikungunya and Mayaro virus can lead to misdiagnosis of these diseases as Zika.[Reference Paniz-Mondolfi18] Theoretically, the similarity between viruses can result in an abnormal increase in search volume or at least change in the trend which will give an initial overview of the state of arboviral circulation. Hence, the model can reflect the status of arboviruses in these two countries. Yet, more research is needed to confirm this theory. With no research tool to discover the epidemic potential of these arboviruses, monitoring Zika can help predicting the status of arboviruses.
Prediction of Zika cases using Google Trends was investigated in previous papers [Reference McGough19, Reference Teng20]. They used the suspected cases of Zika, and correlated the Zika-related Google searches, Twitter microblogs and HealthMap news reports with the suspected cases of Zika in Colombia, El Salvador, Honduras, Venezuela and Martinique. In our study, however, we used the confirmed Zika cases for correlation and prediction which will give more reliable and consistent results. Another point of our study is the source of data. Our data were directly extracted from PAHO reports, which is considered far more reliable than Twitter microblogs and HealthMap. We tried these data before and we found an overlapped and duplicate data that were immediately discarded, and we decided to depend only on official reports provided in PAHO. For the statistical model, McGough et al. used LASSO regression model for prediction whereas, we used the PDLM. Phung et al. [Reference Phung7] validated the three different models comprising: SMR, SARIMA and PDLM for the prediction of dengue cases and they found that PDLM was the most accurate for prediction.
In conclusion, we could use Zika query to predict Zika cases 1 week in advance, which provides a useful tool for monitoring and controlling Zika outbreaks.
Supplementary material
The supplementary material for this article can be found at https://doi.org/10.1017/S0950268818002078
Acknowledgements
The authors would like to express our gratitude to the reviewer for his/her time and efforts in reviewing and enriching this paper's quality.
Funding
No funding was received for this work.
Conflict of interest
None.


