


INTRODUCTION
A large proportion of the global burden of tuberculosis today occurs in Asian populations, with about 37% and 22% of tuberculosis cases occurring in South East Asia and the Western Pacific respectively [1]. Whilst the largest numbers of tuberculosis cases are found in the region's low-income countries, including India, Indonesia and Bangladesh, tuberculosis notification rates in high-income settings such as Hong Kong, Singapore and Japan have also been much higher than those observed in Western populations during the last 50 years. In Hong Kong during the late 1950s, the annual notification rates exceeded 500/100 000, compared with 70–120/100 000 in the United Kingdom [Reference Tocque2]; since the 1970s, the notification rates in Hong Kong [3] have declined only slowly and have been over ten times greater than those in the United Kingdom (i.e. 100/100 000 vs. 10/100 000 respectively in 2000). The contribution of HIV to tuberculosis incidence in Hong Kong has been small to date.
It is probable that some of the differences in the disease incidence between Western and Asian populations reflect regional differences in the natural history of tuberculosis. The annual risk of Mycobacterium tuberculosis infection in the United Kingdom was about 2% in 1950 and appeared to decline by about 13% per annum (p.a.) thereafter [4, Reference Vynnycky and Fine5]. In contrast, tuberculin data from Hong Kong imply that the annual risk of infection in 1950 was probably similar to that observed in Western populations during the early 1900s, i.e. 10% [6, Reference Moodie7]. The annual risk of developing tuberculosis disease through reactivation, as implied by modelling studies, is about 0·03% among infected adult males in Western populations [Reference Sutherland, Svandova and Radhakrishna8, Reference Vynnycky and Fine9], but has never been estimated for Asian populations. However, the high notification rate (e.g. over 300/100 000 p.a. among males aged >50 years in Hong Kong) suggests that it may be far higher than for Western populations. The hypothesis that the high tuberculosis disease incidence observed in Hong Kong is attributable to reactivation, and not to ongoing transmission, is consistent with the low level of ‘clustering’ of isolates from tuberculosis cases found in a recent DNA fingerprinting study in Hong Kong [Reference Chan-Yeung10].
Predictions of the worldwide impact of tuberculosis control strategies have typically been based on the assumption that the risks of disease in Asian and Western populations are identical [Reference Dye11]. If, however, disease risks are higher in Asian than in Western populations, then global tuberculosis predictions could have been greatly underestimated, since over 50% of global tuberculosis cases are found in Asia. High disease risks in Asian populations would also affect the likelihood of meeting the targets for tuberculosis control, which have been prescribed by the UN Millennium Development Goals [12].
In this paper, we present estimates of disease risks in Hong Kong obtained by applying an age-structured model of M. tuberculosis infection and disease, previously used to estimate tuberculosis disease risks in Western Europe [Reference Vynnycky and Fine9]. We compare the resulting estimates against those in the United Kingdom in order to assess the extent to which differences in tuberculosis disease incidence between Asian and Western populations reflect differences in the natural history of tuberculosis between the two settings.
METHODS
Our analysis of the epidemiology of tuberculosis in Hong Kong uses a model previously applied to the UK and Dutch populations to estimate the risks of developing disease soon after (primary) infection, re-infection and through reactivation [Reference Vynnycky and Fine9].
Assumptions in the model
The model's structure, assumptions and the equations describing the model's formulation have been published elsewhere and are reproduced in the Appendix [Reference Vynnycky and Fine9] (available with the online version of the paper). Individuals are assumed to be born not infected with M. tuberculosis. Individuals infected with M. tuberculosis are stratified into those who have not yet developed primary disease (defined by convention as disease within 5 years of initial infection [Reference Sutherland, Svandova and Radhakrishna8, Reference Holm13]) and those in the ‘latent’ class, who are at risk of developing disease through ‘endogenous’ reactivation and/or of re-infection followed by ‘exogenous’ disease. The infection and re-infection risks with M. tuberculosis are assumed to be identical and we explore the effects of age dependencies in these risks in Hong Kong. We also assume, for simplicity and consistency with previous analyses [Reference Vynnycky and Fine9], that re-infection which occurs whilst individuals are still at risk of developing disease as a result of recent infection or re-infection does not affect these disease risks. Based on tuberculin sensitivity and notification data among those aged 0–4 years (see Appendix), the annual risk of infection in the general population in Hong Kong is assumed to have been 10·3% until 1950 and to have declined by 13·5% p.a. after 1967. In the absence of appropriate data spanning the period 1950–1967, we explored the effect of several different plausible assumptions for the average annual risk of infection during this time (see Appendix and Fig. 1), namely that it declined by 2·5, 5, 7·5, 10 and 13·5% p.a. during this time. The implications of these assumptions for the prevalence of infection during the period 1967–1978 (which will be the time period under study in our analyses) are shown in Figure 1 b.
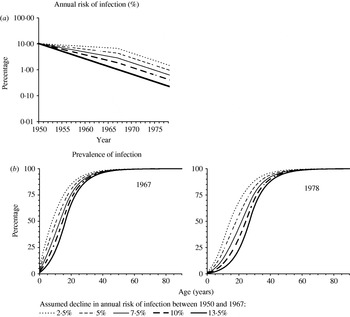
Fig. 1. (a) Predictions of the annual risk of infection for different assumptions about its rate of decline between 1950 and 1967 in Hong Kong (see the Appendix text for further details). (b) The age-specific prevalence of tuberculous infection predicted in 1967 and 1978 for the assumptions shown in (a), assuming that the risk of infection in a given year was independent of age.
The risks of developing disease soon after recent (primary) infection, (exogenous) re-infection or through (endogenous) reactivation among adults in Hong Kong were estimated by fitting model predictions to observed notification data (see below). BCG vaccination has been given to both infants and primary schoolchildren (aged ~7 years) since 1952 in Hong Kong. BCG vaccination has not been incorporated in the model, since the model describes the epidemiology of tuberculosis disease only among adults and there is no definitive evidence that initial vaccination at birth or re-vaccination influences the adult disease risks [14–16].
Notification data
Notifications of all forms of tuberculosis were obtained from the Tuberculosis and Chest Service, Department of Health, Hong Kong, China, for each year during the period 1963–2000 for 10-year age groups. Model-fitting was restricted to data for the period 1967–1978, given that the method in which tuberculosis cases were reported changed in 1967 and notifications were affected by an influx of Vietnamese refugees in 1979 [3]. For consistency with our analyses for the UK population, the analyses were further restricted to data for males.
Analyses of the risks of infection and disease in Hong Kong
The model was first used to predict the disease incidence which might be expected among males in Hong Kong, based on the two most extreme assumptions about the risk of tuberculous infection since 1950 (see Appendix and Fig. 1), and assuming that the risks of developing disease among infected males in Hong Kong were identical to those estimated for the United Kingdom [Reference Vynnycky and Fine9]. The cumulative (5-year) risk of developing disease soon after recent (primary) infection for male adults in the United Kingdom was 14%; the annual risk of developing disease through reactivation was 0·0299%; the cumulative (5-year) risk of developing disease through (exogenous) re-infection was 8·25%.
We then explored how assumptions about the risks of (re)infection or of disease would have to change in the model for predictions of disease incidence in Hong Kong to match the observed data as follows.
In the first instance, the risks of disease were assumed to be identical to those estimated for the United Kingdom, but the risks of infection and re-infection in any given year were assumed to differ between the age groups 25–34, 35–44, 45–54, 55–64 and 65–74 years. These risks were estimated for each age group by fitting model predictions of disease incidence by maximum likelihood to the observed notification rates in the above age groups (see Appendix).
In the second instance, the risk of (re)infection was assumed to be the same for all age groups (as assumed for the model which was applied to the UK population) and to depend only on calendar year, but the risks of developing disease soon after infection (primary disease), through reactivation or following (exogenous) re-infection were estimated by fitting model predictions of disease incidence by maximum likelihood to the observed notification rates (see Appendix).
For both of the above scenarios, the assumptions about infection risks in the general population shown in Figure 1 and notification data for the period 1967–1978 were employed (see above). To test the validity of the assumptions about the risks of infection and disease, the model was used to generate predictions of the disease incidence attributable to recent infection, reactivation and re-infection until recent years to check their consistency with findings from molecular epidemiological studies in Hong Kong. These studies have attributed only a small proportion of disease to recent transmission [Reference Chan-Yeung10]. For these predictions, it was assumed either that the decline in the annual risk of infection halved after 1978, as implied by the general slowing down in the decline in the notification rates among children during this time (see Fig. A3 in the Appendix), or that the annual risk of infection remained unchanged.
RESULTS
Analyses based on the assumption that the disease risks in Hong Kong are identical to those in the United Kingdom
Model predictions of the tuberculosis incidence which would have been expected among males in Hong Kong if the risks of disease given recent infection, re-infection and reactivation in Hong Kong were identical to those for the United Kingdom are presented in Figure 2. The predictions based on the assumption that the risks of infection and of re-infection were the same for all age groups (as was assumed for the United Kingdom) underestimated the observed notification rates for all age groups, with the size of the underestimate being smallest for age group 25–34 years and increasing with increasing age.
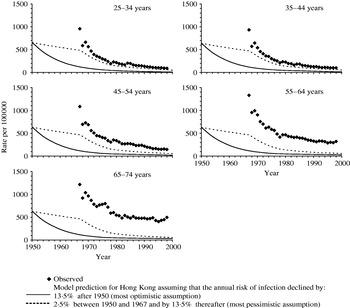
Fig. 2. Comparison between the observed annual notification rates during the period 1967–2000 in Hong Kong among males, and model predictions of disease incidence based on the most pessimistic and optimistic assumptions about the annual risk of infection [i.e. that it declined by 2·5% or 13·5% p.a. respectively between 1950 and 1967 and by 13·5% p.a. thereafter (see Appendix)], and using values for the risks of developing disease estimated for the United Kingdom. For any given year, the predicted incidence is the same for all age groups, at least until the 1970s, since the risks of disease based on the UK notification data were identical for all adults, and the majority of adults in Hong Kong are predicted to have been infected at this time (see Fig. 1) and to be experiencing disease as a result of reactivation or re-infection. For the most pessimistic assumption about the annual risk of infection, the predicted rate of decline in the disease incidence changes in 1967 as a result of the increased rate of decline in the annual risk of infection from this year (i.e. 2·5% p.a. until 1967 and 13·5% p.a. thereafter).
In order for model predictions of disease incidence, based on the UK disease risks, to match the observed data, the risks of infection and re-infection among age groups 25–34, 35–44, 45–54, 55–64 and 65–74 years would have needed to be 11, 12, 17, 27 and 38% respectively in 1967 (see Fig. 3). By 1978, these values would have needed to have declined to 3% for the 25-44 years group and 4%, 6% and 9% for age groups 45–54, 55–64 and 65–74 years respectively.

Fig. 3. Summary of the best-fitting annual risks of infection for age groups 25–34, 35–44, 45–54, 55–64 and 65–74 years for 1967, 1970, 1975 and 1978, obtained by fitting model predictions of disease incidence to the notification rates for the period 1967–1978, assuming that the risks of disease for (infected) males in Hong Kong were identical to those for males in the United Kingdom.
Model predictions of the relative contribution of disease attributable to recent (primary) infection, reactivation and re-infection for these best-fitting infection risk estimates are presented in Figure 4, for ages 45–74 years for two assumptions about the annual risk of infection since 1978. These indicate that if the rate of decline in the annual risk of infection had halved after 1978, the disease incidence in all age groups would have continued to decrease and would have reached <100/100 000 p.a. by 2000, which is inconsistent with the observed data. On the other hand, if there had been no decline in the annual risk of infection since 1978, then the disease incidence rates would have remained unchanged at the level estimated for 1978. In addition, almost all of the disease incidence over the last 30 years in any given age group, including that in the 65–74 years group, would have been attributable to (recent) re-infection.

Fig. 4. Comparison between the observed notification data among males in different age groups and model predictions of disease incidence during the period 1967–2015, based on best-fitting estimates of the age dependency in the risks of infection and assuming that the risks of disease were identical to those for males in the United Kingdom. In the figures in the left-hand panel, the decline in the annual risk of infection (ARI) is assumed to have halved after 1978 to 6·75% p.a. In the figures in the right-hand panel, ARI is assumed to have remained unchanged after 1978. The shaded areas reflect model predictions of the proportion of disease attributable to recent infection, re-infection and reactivation. Note that, as a result of the high prevalence of infection in all the age groups considered here (see e.g. Fig. 1), none of the disease incidence is attributed to recent (primary) infection.
Estimates of the disease risks in Hong Kong (assuming that the infection risk is independent of age)
Disease risk estimates obtained by fitting model output to age-specific notification rates, assuming that the risks of infection and re-infection did not depend on age, are summarized in the Table. Given that the confidence intervals around the disease risk estimates for age groups 25–34 and 35–44 years are wide, we here present only the results for age groups 45–54, 55–64 and 65–74 years. In general, the estimated risk of disease soon after recent primary infection was unreliable (as few individuals reached 45 years of age without having been infected at least once). The risk of disease through reactivation increased with increasing age, e.g. from about 0·11% p.a. for the 45–54 years group to 0·20% p.a. and 0·52% p.a. for age groups 55–64 and 65–74 years respectively, thus ranging between three and 17 times that for males in the United Kingdom (i.e. 0·03% p.a.). The best-fitting risk of disease following (recent) exogenous re-infection occurred in the range 25–38%, although no consistent pattern emerged with increasing age.
Table. Summary of best-fitting estimates for the risks of developing disease soon after recent (primary) infection, through (endogenous) reactivation or following (exogenous) re-infection among males for an intermediate assumption about the annual risk of infection, namely that it declined from 10·3% in 1950 by 7·5% p.a. until 1967 and by 13·5% p.a. thereafter
* See Appendix for the equation.
† Cumulative risk of disease during 5 years after infection or re-infection.
‡ Annual risk of disease.
Estimates of the risk of disease through reactivation were relatively insensitive to assumptions about the risk of tuberculous infection (see Table A1 in the Appendix); in contrast, the risks of developing disease soon after initial infection and following re-infection were both unreliable and very sensitive to these assumptions.
Model predictions of the relative contribution of disease attributable to recent (primary) infection, reactivation and re-infection, based on the best-fitting disease risks, are presented in Figure 5. Given the unreliability of estimates of the risk of developing primary disease for those aged 45–74 years, this risk is taken to be at the level estimated for individuals in the United Kingdom. This figure highlights that most of the disease in all age groups, based on the best-fitting disease risks, was attributable to re-infection at least until the mid-1970s. For the 65–74 years age group, almost half of the disease incidence shortly after 1967 was attributable to reactivation. By 2000 this proportion was predicted to be almost 100%, if the decline in the risk of infection was assumed to have halved after 1978, or about 75% if the risk of infection was assumed to have remained unchanged after 1978. In general, even if the decline in the risk of infection continued beyond 2000, the disease incidence for individuals aged >65 years is predicted to remain at the level predicted in 2000, at least until 2015.

Fig. 5. Comparison between the observed notification data among males in different age groups and model predictions of disease incidence during the period 1967–2015, based on best-fitting estimates of the risks of disease and assuming that the annual risk of infection was 10% in 1950, and that it declined by 7·5% p.a. until 1967, by 13·5% p.a. between 1967 and 1978. In the figures in the left-hand panel, the decline in the annual risk of infection (ARI) is assumed to have halved after 1978 to 6·75% p.a. In the figures in the right-hand panel, ARI is assumed to have remained unchanged after 1978. The shaded areas reflect model predictions of the proportion of disease attributable to recent infection, re-infection and reactivation. Note that, as a result of the high prevalence of infection in all the age groups considered here (see e.g. Fig. 1), none of the disease incidence is attributed to recent (primary) infection.
DISCUSSION
Notification rates of tuberculosis in those aged 55–74 years during the last 50 years in Hong Kong have been higher than those seen in the United Kingdom during this time; during the last 30 years, the decline in the notification rates in Hong Kong has slowed. Our analyses indicate that the high notification rates in Hong Kong compared with those in the United Kingdom may be explained by at least one of two factors, i.e. high risks of infection and re-infection, which increase with increasing age, and high risks of reactivation, which increase from about 0·11% p.a. for those aged 45–54 years, to 0·20% p.a. and 0·52% p.a. for males aged 55–64 and 65–74 years respectively. These risks and which are 3–17 times greater than those estimated for counterparts in the United Kingdom. We discuss these two factors below.
We first note the limitations in our analyses. The main limitation is that the risk of infection after 1950 in Hong Kong is unknown and, in the absence of suitable data, we have had to explore the effect of several different assumptions for this risk. In addition, the model assumes that individuals mix randomly in the population and that the disease risks remained unchanged over time, although they could well have changed with improvements in living standards. A further limitation is that the analyses have been restricted to data from Hong Kong; it would be informative to perform similar analyses using data from other settings in South East Asia. In the absence of other data, we have also assumed that the risk of re-infection is identical to that of first infection. This assumption is unlikely to have influenced our conclusions about the age dependencies in the risks of (re)infection and disease in Hong Kong, since our analyses of these factors are based on data for the period 1967–1978. During this time, the prevalence of infection is estimated to have been very high (Fig. 1), even without assumptions about an age-dependent risk of infection.
Our analyses have also not accounted for immigration, since they were restricted to the period 1967–1978, i.e. before the notification data could have been affected by any significant population movements. However, incorporating the effects of immigration probably would not have affected our conclusions substantially. For example, most of the immigrants during the 1950s and 1960s came from Southern China and, even in recent years, over 90% of the population is classified as Chinese [17]. Given that there was free movement between Hong Kong and Southern China before 1949, the immigration pattern in Hong Kong during the 1950s and 1960s is analogous to the patterns in migration from rural to urban areas which are seen in other countries. In addition, the main immigrant group during the late 1970s and 1980s (Vietnamese refugees) made up less than 10% of all tuberculosis cases [3]. There is little evidence that they affected tuberculosis statistics in the indigenous population, given that cultural differences and confinement in detention camps would have restricted their contact with other population groups. Comprehensive chest X-rays and treatment of active cases would have also limited their contribution to transmission in the overall population.
Our analyses indicate that the risks of reactivation disease in Hong Kong are much higher than those in the United Kingdom, although the precise magnitude of the difference is difficult to elucidate, given the lack of reliable data on the annual risk of infection. For example, as demonstrated in Figure 3, if it is assumed that the risks of disease in Hong Kong were identical to those estimated in the United Kingdom then the high notification rates for adults during the 1970s would have been possible only if the annual risk of infection in Hong Kong had been very high, e.g. 38% for those aged >65 years in 1967 (Fig. 3). Such risks are higher than any of the infection risks which have ever been estimated in general population surveys in the world to date: the highest risks (~20%) have been estimated in the Eskimo population during the late 1940s [Reference Comstock and Philip18]; in contrast, the highest infection risks for European countries were about 11% during early 1900s [Reference Styblo, Meijer and Sutherland19].
In addition, if it is assumed that the risks of disease were identical to those in the United Kingdom, then, in the absence of substantial numbers of cases coming into Hong Kong through immigration, the high notification rates after the 1990s could have occurred only if the risk of infection had remained relatively unchanged since 1978. As shown in Figure 4, if the latter had occurred, then almost all of the disease incidence among elderly individuals in recent years should be attributable to recent transmission, which is inconsistent with findings from molecular epidemiological studies in Hong Kong: these have found relatively few isolates from elderly cases to be in a ‘cluster’ and have attributed <25% of cases to recent transmission [Reference Chan-Yeung10].
The high risks of developing disease through reactivation have important implications for trends in disease incidence. If it is assumed that the decline in the annual risk of infection slowed down during the 1970s, as implied by the slowing decline in notification rates among the 0–4 years age group (See Appendix, Fig. A1.C), the disease incidence among males aged >50 years in Hong Kong is predicted to remain at the high level estimated after 2000, at least until 2015 (Fig. 5). As most of the disease in these individuals is attributable to reactivation, control targeted at interrupting transmission is likely to have only a small effect on the disease incidence among these individuals. Given an ageing population, the impact of directly observed treatment short-course (DOTS) may well be smaller than that predicted by a recently published model [Reference Dye11], in which the risks of disease were assumed to be identical to those among individuals in Western populations. The study thus has important implications for the prospects of global tuberculosis control and the likelihood of reaching the targets set by the UN Millennium Development Goals [12], if the disease risks we found in Hong Kong were to apply to other Asian countries, since over 50% of the global tuberculosis burden is found in Asia and the Western Pacific. In this context, it is interesting that the widespread implementation of DOTS in some countries, such as Vietnam, appears to have had little impact on the observed trends in tuberculosis incidence [Reference Huong20].
Several factors could have contributed to high reactivation risks in Hong Kong compared to the United Kingdom: nutrition (likely to have been unsatisfactory in Hong Kong prior to 1950); smoking (peaked during the 1970s in Hong Kong compared the 1950s in the United Kingdom and Western populations, although the overall consumption was similar in the two settings [Reference Leung21–Reference Lam23]); genetics (if tuberculosis arrived recently in South East Asia, then the prevalence of susceptibility genes for tuberculosis disease may still be high [24]); predisposing co-infections or environmental conditions (e.g. silicosis, which is a strong risk factor for tuberculosis [Reference Chang, Leung and Tam25], was the second most commonly notified occupational disease during the 1990s in Hong Kong [Reference Ho and Lo26]); or the pathogen itself (most of the isolates of M. tuberculosis found among Asian tuberculosis cases belonged to the Beijing family of strains [Reference Glynn27, Reference Chan28], although its association with the risks of developing disease remains unclear). Elucidation of the relative contribution of these factors to the high disease risks requires further studies.
There has been much discussion of the ‘stagnation’ in the decline in the tuberculosis notification rates in Asian populations [Reference Ohmori29–31]. In Japan, the decline in the overall notification rates slowed in around 1980, and the notification rates among individuals aged >50 years have remained at approximately the same level since then [Reference Ohmori29]. In Singapore, the notification rate has also remained at approximately the same level since the 1980s and among males aged >60 years, the notification rate is about 200/100 000 [Reference Chee and James30, 31]. Although some of this stagnation among young individuals may be attributable to migration from high tuberculosis incidence populations, this is unlikely to be the case for older individuals since very few are recent immigrants. It is therefore likely that, as illustrated here, at least some of the stagnation among elderly individuals is attributable to a high prevalence of infection and high risks of reactivation disease. Without the development of new methods for preventing reactivation disease among individuals who are currently infected, the notification rates in Asian populations may well continue to remain at a high level for several more decades.
ACKNOWLEDGMENTS
Some of this work was carried out whilst E.V. was funded by the British Medical Research Council.
NOTE
Supplementary information accompanies this paper on the Journal's website (http://journals.cambridge.org).
DECLARATION OF INTEREST
None.


