INTRODUCTION
Hepatitis C is a viral infection of the liver. The virus (HCV) was first identified in 1989. The virus, which is spread by direct contact with infected blood, is one of the major causes of chronic liver diseases such as cirrhosis and liver cancer. According to estimates of the World Health Organization, 170 million people are infected around the world with between 3 and 4 million new infections each year [1]. In developed countries, 90% of persons with chronic HCV infection are current or ever injecting drug users (IDUs), or have a history of transfusion with unscreened blood. In addition, IDUs are also at greater risk of acquiring HIV and other infectious diseases due to common transmission routes such as sharing syringes or other injecting paraphernalia.
There is a vast amount of literature dealing with the estimation of the infection hazard, often referred to as the force of infection (FOI), from cross-sectional seroprevalence surveys (see Hens et al. [Reference Hens2] for an overview). In such a survey, taken at a specific calendar time, each participant is tested for the presence of infection-specific antibodies, a marker for past infection and thus constituting current status data on past infection. In general, the participant's age is considered the time at risk. However, among IDUs, the cross-sectional sample has information on the serostatus of each individual and the self-reported duration of injection is usually considered as a more precise measurement of the time at risk. A quintessential assumption in the estimation of the FOI from cross-sectionally collected seroprevalence data is the assumption of time homogeneity, i.e. assuming that the FOI is invariant with respect to calendar time. This assumption can be relaxed when either a cohort study or repeated cross-sectional studies are available.
The Amsterdam Cohort Studies (ACS) is a prospective cohort study that tested participants' blood for infections at each follow-up visit. Therefore, the exact time to event is unknown but the time interval in which the infection occurs is known. In survival analysis, data of this type are known as type II interval-censored data, whereas current status data constitute type I interval-censored data [Reference Sun3]. In the literature, several authors ignored the interval and imputed the time to event T using the left, right or midpoint value of the interval after which they applied standard time-to-event techniques to analyse the data. It has been shown that this approach can lead to biased and misleading results [Reference Lindsey and Ryan4]; e.g. the right endpoint imputation yields inflated estimates of the risk [Reference Dorey, Little and Schenker5]. Therefore appropriate techniques have to be used [Reference Sun3].
The estimation of the FOI for HCV in the IDU population was based previously on cross-sectional data [Reference Del Fava6–Reference Sutton11]. The major contribution of this paper is the estimation of the FOI for HCV in IDUs using a large cohort study, with more than 25 years of follow-up, while assessing the impact of self-reported behavioural risk factors (injection frequency, type of drug injected, sharing of syringes) using an adequate statistical model. Moreover, the inclusion of date of first injection as a factor relaxes the assumption of time homogeneity which is made when cross-sectional data is analysed.
The paper is organized as follows. In the next section we describe non-parametric survival models to estimate the time to HCV infection using interval-censored data and parametric survival models to identify potential risk factors. Next, the models are applied to the ACS data while focusing on the estimation of the FOI for HCV and the identification of risk behaviour factors associated with infection. We end with a discussion.
DATA AND METHODS
Study population and Data
The ACS of drug users is an open, prospective cohort study initiated in 1985 to investigate the prevalence, incidence, and risk factors of HIV infections and other bloodborne and/or sexually transmitted diseases, as well as the effects of intervention. Participation in the ACS is voluntary, and informed consent is obtained for every individual at entry. ACS participants visit the Amsterdam Health Service every 4–6 months, they complete a standardized questionnaire about their health, risk behaviour, and sociodemographic situation. Questions at ACS entry refer to the 6 months preceding the visit; questions at follow-up refer to the interim since the preceding visit. Blood is drawn each visit for laboratory testing and storage. Until 2006, 1663 drug users have been included in the ACS. The recruitment of drug users was via methadone programmes, a sexually transmitted diseases clinic for drug-using sex workers and by word of mouth. A drug user was defined as an IDU if he or she reported ever having injected drugs. [12].
Methods
Several attempts have been made to estimate the FOI of HCV in the IDU context based on cross-sectional data [Reference Del Fava6–Reference Sutton11]. All authors assumed a parametric function for the prevalence and the FOI, either assessing the impact of covariates or taking into account the association with other viruses. The proposed methods were applied to the binary data representing the current status of the disease of each IDU. Diverse and more appropriate techniques can be applied to cohort data and therefore, given the data at hand, a survival analysis taking into account censoring and truncation should be considered.
Within survival analysis the main interest is in the estimation of the time-to-event distribution and factors that affect it. One of those factors is the censoring, where only partial information about the event is known. Denote T, the time until an event occurs also called survival time, and d, the censoring indicator, which takes the value 1 if the event occurs and 0 if at the end of the study period the event has not been observed. In that case, the subject is said to be right-censored and the time to event T is taken to be equal to the follow-up period. If the event of interest, in our case infection with HCV, has occurred before the subject enters the study, the data is left-censored.
The ACS is a follow-up study in which the exact time to infection with the HCV virus (T) is unknown but the time interval in which the infection occurs is known. Allowing T to denote the time to infection and L and R the left and right limit of the interval in which the subject was infected gives L⩽T⩽R. For current status data R=∞ for a right-censored subject (seronegative) or L=0 for a left-censored subject (seropositive).
The basic quantities within the survival analysis framework are: the survival function S(t), denoting the probability that the event does not occur before time t, the hazard function h(t), representing the instantaneous probability that the event occurs at time t given that it has not occurred before. Related functions are the cumulative distribution function F(t)=1 – S(t) which is the probability that the event occurs before time t, and the corresponding probability density function f(t). The hazard function h(t) also known as the FOI, or the intensity function, is given by [Reference Klein and Moeschberger13]:
Considering the characteristics of the study population, the time at risk is given by the self-reported number of years injecting. That is, the time since an IDU starts to inject drugs until he/she becomes infected with HCV. In what follows we first discuss non-parametric approaches to estimate the survival function in the case of interval-censored data. We then introduce accelerated-failure time models for interval-censored data and estimate the FOI in the case of interval-censored data while accounting for behavioural risk factors and time heterogeneity.
Non-parametric estimation of the survival function
We consider a non-parametric estimate for the survival curve, using the algorithm proposed in 1976 [Reference Turnbull14] which is called a self-consistency algorithm to obtain a non-parametric maximum likelihood estimator (NPMLE) of the survival function. The interval-censored data is treated as incomplete data and the expectation-maximization (EM) algorithm [Reference Dempster, Laird and Rubin15] is applied to take these incomplete data into account.
Sun [Reference Sun3] describes and compares the self-consistency algorithm with two other algorithms, the iterative convex minorant and the EM iterative convex minorant algorithms. According to his results, the three algorithms produce very similar results. In terms of computing time, the differences were moderate.
Accelerated-failure time models
Assessing the influence of risk factors in a survival analysis can be done within the accelerated-failure time framework, where the time to HCV infection is assumed to follow a specific distribution. Following [Reference Klein and Moeschberger13], we allow Y to denote the time to infection, and consider the following linear model representation for the logarithm of time T=lnY:
where γ′=(γ1, γ2, …, γp) is a vector of regression coefficients, Z is a vector of covariates and W is an error term, assumed to follow a certain distribution. The regression coefficients have an interpretation similar to those in standard regression.
Under the accelerated-failure time model (2), the hazard function for an individual with covariate Z is related to a baseline hazard rate λ0 as follows:
The factor exp(−γ′Z) is called the acceleration factor, which reflects the expansion or the contraction of survival time as a function of the covariates.
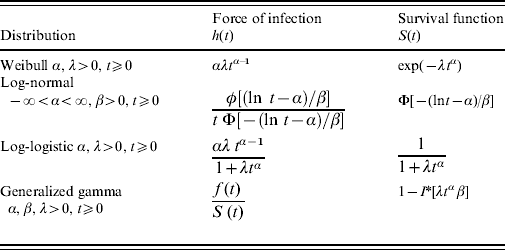
Table 1 shows the different distributions and the corresponding hazard functions as considered in the present study.
Table 1. Force of infection and survival functions for different parametric distributions

* I is the incomplete gamma function.
For the participants in the ACS, the exact time of HCV infection is unknown. Hence we define the limits for the interval in which an IDU became infected as follows: for the seroconverters the lower limit of the interval is the number of years of injection at the last negative result for HCV whereas the upper limit is the number of years of injection at the first positive result; for the individuals who were negative at the end of follow-up the lower limit is the number of years of injection until the last visit, and the upper limit is infinite, i.e.:
Seroconverter: last negative test result ⩽T⩽ first positive test result.
Seronegatives: last negative test result ⩽T⩽∞.
Left truncation
Left truncation arises when individuals come under observation only some known time after the natural time origin of the phenomenon under study [Reference Klein and Moeschberger13]. For this study, the data are left-truncated as a condition for inclusion in the study, i.e. individuals are uninfected at cohort entry.
To account for left truncation Pencina et al. [Reference Pencina, Larson and D'Agostino16] proposed five different methods all yielding similar results. The method employed here accounts for left truncation by including the duration of injection at the first visit as a covariate in the model and the results thus warrant a conditional interpretation.
RESULTS
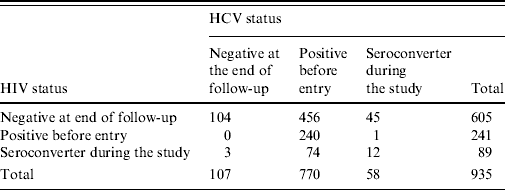
The ACS database up to 2005 contained information on 1206 IDUs of whom 254 lacked information about their HCV serostatus since only those with at least two study visits were tested for HCV [Reference Van den Berg17, Reference Van den Berg18]. There were 3, 12 and 2 individuals having zero or negative time to infection for HIV only, HCV only, and both HIV and HCV, respectively. Zero time to infection implies that the year of first injection coincides with the year of the first positive result, whereas negative time to injection refers to individuals who had positive results before becoming IDUs. Table 2 shows the HIV and HCV serostatus for the remaining 935 individuals. In the analysis presented in this paper we only included individuals who were HCV negative at study entry, totalling 165 individuals: 58 who became seroconverters during the follow-up period and 107 who remained negative.
Table 2. Number of patients according to their serostatus for HIV and HCV
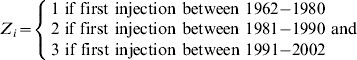
From this group of IDUs 66·1% were males. The average age of first injection was 25·4 years (s.d.=7·8 years), whereas the mean age at first visit was 30 years (s.d.=7·4 years), the mean of the follow-up time was 7·9 years (s.d.=5·4 years). Regarding the sharing of needles, 33·5% stated sharing syringes at least once during the follow-up period; concerning the frequency of injection, 41·4% reported not recently injecting at first visit, 15·4% reported using drugs >1 per day and 16·7% used drugs between 2 and 6 days per week. The most common drug was a combination of cocaine and heroin: 21·8%; followed by heroin and cocaine use alone at 19·4% and 8·5%, respectively. Individuals started injecting drugs between 1962 and 1980 (12·7%), 1981 and 1990 (43·6%), and 1991 and 2002 (43·6%).
Clearly frequency of injection and type of drug are subject to change during the injecting career; Table 3 shows values at entry and at the last follow-up visit. In order to simplify the model, we considered the responses provided in the first follow-up visit.
Table 3. Descriptive statistics for injecting drug users

Figure 1 shows the NPMLE for the survival curve [Reference Sun3]. Clearly, the longer the duration of injecting at first visit the longer the time to HCV infection during follow-up. The figure illustrates that it is important to not ignore the issue of left truncation as the NPMLE changes according to the level of duration of injecting at first visit.

Fig. 1. Non-parametric maximum likelihood estimator of the survival function for different levels of duration of injection at first visit.
Table 4 shows the different parametric models with their Akaike's Information Criterion (AIC) values, favouring the generalized gamma model. Therefore, we retained this model as the best model among the set of candidate models.
Table 4. Parametric models for time to HCV infection, including only duration of injection at first visit

AIC, Akaike's Information Criterion.
Considering the parametric distributions as introduced above, we performed simple (single covariate) analyses with each of the behavioural risk factors (sharing syringes, frequency of injection, main drug injected) and year of first injection. For each of the models we compared the different distributions in terms of AIC and the likelihood ratio test (results not shown) and found the generalized gamma to be the best distribution for most of the models.
The effect of sharing syringes
To assess the impact of sharing syringes we took into account all responses of the individual during the follow-up period, which include information on receptive sharing. Modelling the effect of sharing syringes using the accelerated-failure time model was done by extending model (2), including whether the IDU shared syringes (Z=1) or not (Z=0), where γ is the regression coefficient quantifying the effect of sharing syringes on HCV infection time and W is the error term. Hence, the FOI is given by:
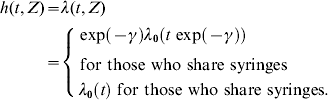
Under the accelerated-failure model, the relationship between the survival functions is as follows:
implying that the median infection time of those IDUs who share syringes (Z=1) is exp(γ) times the median infection time of those IDUs who do not share. Or equivalently, the median survival time of those IDUs not sharing syringes (Z=0) is exp(−γ) times the median survival time of those who do share.
The acceleration factor, for those who share syringes compared to those who do not, equals exp(−γ)=exp(0·22)=1·25 and thus the median time to HCV infection for an IDU who does not share is estimated to be 1·2 times longer than that of an IDU sharing syringes. The acceleration factor is adjusted by the duration of injection at the first visit in order to account for left truncation.
Frequency of injection
The frequency of injection at first follow-up visit has eight categories: no recent injections, <1 day per month, 1 day per month, 2–3 days per month, once weekly, 2–6 days per week, once daily, and >1 time per day. We consider a categorization based on four groups: no recent injections (0); <1 day per month, 1 day per month, and 2–3 days per month (1); once weekly and 2–6 days per week (2); and once daily and >1 time per day (3). The results are shown in Table 5.
Table 5. Single covariate gamma parametric models for the different risk factors accounting for left truncation

s.e., Standard error; AF, acceleration factor; CI, confidence interval; AIC, Akaike's Information Criterion.
In this model, significant differences were found between the baseline category (no recent injections) and the remaining three categories. Moreover, we observed a trend in the estimates: when the frequency of injection increases, the acceleration factor increases.
For instance the acceleration factor for an IDU injecting ⩾1 per day is exp(1·16)=3·2, resulting in a threefold increase in median time to HCV infection for an IDU not injecting recently compared to one who injects ⩾1 per day. Similarly, the acceleration factor for the first and the second group are exp(0·88)=2·4 and exp(0·96)=2·6, respectively, leading to similar conclusions.
Table 6. Multiple covariates generalized gamma model for all risk factors (AIC: 416·938)

AIC, Akaike's Information Criterion; AF, acceleration factor; CI, confidence interval.
Drug of injection
There are seven categories for drug of injection: no recent injections, heroin, cocaine, combination of heroin and cocaine, amphetamine, methadone, and recent IDU with unknown drug of injection. Due to the small number of individuals in the last three categories we recombined them. The results of the model are shown in Table 5.
The baseline class is no recent injections. Clearly the acceleration factor for injecting any drug compared to not injecting is very high. For instance, the acceleration factor for heroin (alone) is exp(0·78)=2·2, i.e. the median time to HCV infection for IDUs with no recent injections is twice the median time to HCV infection of those who inject heroin. The remaining three acceleration factors are quite large too, with 3·4 for those who inject cocaine, 2·6 for the combination of heroin and cocaine and 2·9 for those who inject amphetamine, methadone or are recent IDUs.
Time-dependent FOI
The models discussed above assume that the baseline hazard depends on the length of the injecting career of the IDU. In this section we include calendar time of first injection as a covariate in order to investigate if the risk of infection for IDUs changes with time. We consider a categorical variable with three time categories.
The hazard for this model is given by
where γj is the effect of time group j=1 and 2 on the hazard rate. Since the model includes a time effect it does not assume time homogeneity (i.e. the assumption that the disease is in a steady state). This is in contrast with models for current status data for which one of the model assumptions is time homogeneity.
The parameter estimates for the generalized gamma model are shown in Table 5, the reference group is 1991–2002. The acceleration factor for IDUs with first injection before 1980 compared to IDUs who first injected in 1991–2002 equals exp(−2·2)=0·11. Hence, the median HCV infection time for IDUs starting to inject in 1991–2002 is about one-tenth of the median HCV infection time of IDUs who started injecting between 1962 and 1980 and were still HCV negative at cohort entry after 1985. This variable is negatively correlated with the duration of injection at first visit and was therefore not considered in the multiple risk factor model. Note that caution should be taken when interpreting the results of this particular analysis because the omission of adjustment by left truncation is not explicitly taken into account; moreover, the calendar time is likely to be strongly influenced by the recruitment procedure.
Figure 2 shows the behaviour of the FOI according to the duration of injection at first visit. The acceleration factor is equal to 0·77, reflecting the fact that those with lengthy exposure times prior to entering the cohort as negative are lower-risk IDUs.

Fig. 2. Force of infection according to duration of injection at first visit.
Predictions in terms of survival probabilities based on the models presented in Table 5 are available in the online Supplementary Appendix.
Model including several risk factors
Finally we consider a multiple risk factor model, all the risk factors from the single covariate models were included when at least one of their categories was significant (Table 6).
Comparing the results of the multiple risk factor model with the results of the single risk factor models, the covariates which turn out to be non-significant are sharing syringes and frequency of injection. The acceleration factor for heroin is 2·2, for cocaine 4·8, for the combination of those two 3·2 and for other drugs 3·1. Clearly, current IDUs have a higher risk than non-recent IDUs for HCV infection.
DISCUSSION
In our study we found a higher risk of HCV infection in the first 3 years of an IDU's career, this is in accord with other studies [Reference Platt9, Reference Sutton10, Reference Van den Berg17, Reference Van den Berg18]. Drug of injection was associated with HCV seroconversion but sharing syringes was not. Our findings provide important additional evidence that it is crucial to target HCV prevention to new injectors as soon as they start to inject and that any efforts to reduce incidence needs to take recent injectors into account. However, since it might be difficult to find these recent injectors additional efforts are needed to prevent the transition to injecting drug use in non-IDUs.
Previous work focused on the estimation of the FOI for HCV in the IDU context based on cross-sectional data thereby relying on time homogeneity. Our study focuses on estimating the FOI based on cohort data, taking into account risk factors as well as the complexities inherent to this type of data while relaxing the time homogeneity assumption. This approach is innovative in the field and it is reassuring to conclude that previous findings can be confirmed.
The ACS is a valuable and unique source of information because it includes a follow-up of IDUs of more than 20 years, in this sense it allows us to test one crucial assumption that is frequently made and untested when we analyse current status data, i.e. time heterogeneity. In fact, some studies have confirmed a decrease in risk behaviour and in the prevalence and incidence of HCV [Reference Van den Berg17–Reference Van de Laar19]. Furthermore, a declining trend of injection in groups of drug users, with low or declining rates of injection have been described in opioid users in several European countries although differences between countries are large [Reference Wiessing20]; specifically in Amsterdam [Reference Van den Berg17–Reference Van de Laar19, Reference Welp21, Reference Van Ameijden and Coutinho22], notably the decrease in HCV seroprevalence due to the unpopularity of injecting in drug users and the success of prevention campaigns.
For this study we use interval-censored data methodology, which takes into account the uncertainty about the exact time to event. The non-parametric estimates show the highest risk of HCV infection is in the first 3 years of injection; based on the parametric models there is an effect of frequency of injection and drug of injection.
The fact that frequency of injection and drug of injection were significant risk factors is consistent with previous studies [Reference Van den Berg17, Reference Van den Berg18, Reference Hahn23–Reference Miller26]. It reflects the cumulative exposure to infected needles and injection paraphernalia. On the other hand, sharing syringes was not identified as a risk factor; a similar result to that observed in Van de Laar et al. [Reference Van de Laar19].
Future analyses should include the combined analysis of both HIV and HCV infections considering the time at risk for each of them; this can be done using frailty models considering the bivariate type of data. The general idea is to specify latent variables which act multiplicatively over the baseline hazard, and reflect how frail an individual is for acquiring the infections. The frailty could be shared when one latent variable is considered per individual or correlated when a joint latent distribution for both infections is assumed. An illustration of the use of shared frailty models on current status data for hepatitis B and C has been reported [Reference Sutton10]; and also for hepatitis B and C and HIV infection in [Reference Sutton11] and for hepatitis A and B with correlated frailties [Reference Hens27].
In terms of study population, further research could include all IDU participants in the ACS. In terms of modelling, we did not take into account all the values of the time-dependent covariates during the follow-up, therefore more complex models can be developed; moreover, a more flexible approach could use splines to incorporate the duration of injection at first visit. Those issues are beyond the scope of this paper.
NOTE
Supplementary material accompanies this paper on the Journal's website (http://journals.cambridge.org/hyg).
ACKNOWLEDGEMENTS
The authors thank study nurses and doctors for data collection and blood sampling all subjects for study participation and C. van den Berg for compiling and providing the dataset.
The Amsterdam Cohort Studies (ACS) is a collaborative initiative of the Amsterdam Health Service (AHS), the Academic Medical Centre of the University of Amsterdam, the Sanquin Blood Supply Foundation, and the University Medical Centre Utrecht. ACS is part of The Netherlands HIV Monitoring Foundation and is financially supported by The Netherlands National Institute for Public Health and the Environment.
The work of A.C. was partially supported by a grant from Research Fund of Hasselt University (BOF08DOC17). The work of N.H. was partially supported by ‘SIMID’, a strategic basic research project funded by the Institute for the Promotion of Innovation by Science and Technology in Flanders (IWT), project no. 060081. The work of A. C., Z. S., N. H., and M. A. was supported by the IAP research network no. P6/03 of the Belgian Government (Belgian Science Policy).
This study contributes to the work of the ‘European Study Group for Mathematical Modelling and Epidemiological Analysis of Drug-Related Infectious Diseases, coordinated by EMCDDA and RIVM with funding from WHO/Europe and the government of The Netherlands.
DECLARATION OF INTEREST
None.