


Accurate methods for determining the duration of HIV infection at the individual level are valuable in many settings, including studies of HIV transmission [Reference Murphy1], early disease pathogenesis [Reference Rosenberg2, Reference Fidler3], impact of early anti-retroviral treatment (ART) and cure interventions [Reference Herout4–Reference Lundgren8] or diagnostic performance [Reference Hassan9, Reference Leon10], and in clinical practice (especially for acute infection) [Reference Rutstein11–Reference Green13]. Since first published in 2003, the ‘Fiebig staging system’ has been used as the primary way of classifying early HIV infection into five sequential stages based on HIV test result patterns in newly diagnosed individuals [Reference Fiebig14]. However, Fiebig stages can only be assigned to individuals who produce both a negative and a positive test result on the same day, on specific pairs of tests of varying ‘sensitivity’. Further, in the past 16 years HIV-testing technology has evolved substantially, and three of the five key assays used to define Fiebig stages – the HIV p24 antigen ELISA, HIV IgG antibody ELISA and HIV western blots – are no longer in wide use. To address these limitations, we developed an improved and more general framework for estimating the duration of HIV infection by interpreting any combination of diagnostic test results, whether obtained on single or multiple days, into an estimated date of detectable infection, or EDDI.
It is common to employ Fiebig staging loosely, i.e. to assign stages to a particular individual based on the classes of tests rather than the particular tests used in diagnosis. While understandable, in the absence of compelling alternatives, simple substitution of a similar type of assay (e.g. substituting one IgG/IgM antibody test for another or using a viral load threshold of 10 000 copies/ml as a surrogate for p24 Ag reactivity) does present problems for the estimation of infection dates. Different assays have different window periods (delays from HIV infection to detection) even within a single class [Reference Perry15–Reference Pilcher18], and so the durations of the sequential stages presented in the original Fiebig paper cannot simply be used without introducing bias. Table 1 provides five individual scenarios where screening and supplemental testing was performed on the same day, with discordant results as required for Fiebig staging, but using tests one might find in 2018.
Table 1. Comparison of Fiebig staging substituting newer assays, with and without adjustment for diagnostic delays
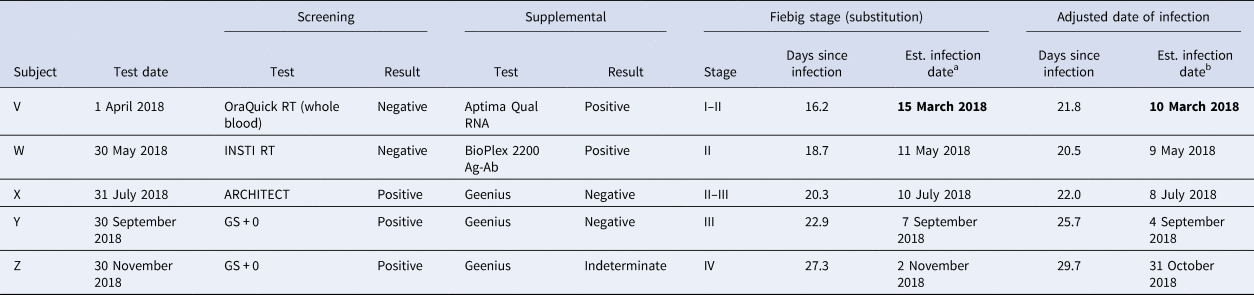
OraQuick RT, OraSure OraQuick ADVANCE rapid test; INSTI, INSTI HIV-1/2 1-minute rapid test; ARCHITECT, Abbott ARCHITECT HIV Ag/Ab Combo; GS + 0, BioRad GenScreen HIV-1/HIV-2 + 0 EIA; Aptima Qual RNA, Aptima HIV-1 RNA qualitative assay; BioPlex 2200 Ag-Ab, BioPlex 2200 Ag-Ab Combo; Geenius, BioRad Geenius; Est., estimated.
a Estimated infection dates based on Fiebig stages are obtained by subtracting from the date of diagnosis: half of the duration of the stage at diagnosis, as well as the cumulative duration of all prior stages and the eclipse phase, as estimated by Fiebig et al. [Reference Fiebig14].
b As above, but Fiebig stage durations adjusted for the diagnostic delays of the newer assays used in each case.
In the column labelled ‘Fiebig stage (substitution)’, the days from estimated infection date to specimen collection are calculated assuming that the newer tests are interchangeable with the tests initially used in the Fiebig staging calculations, as is commonly done. In the column labelled ‘Fiebig stage (adjusted)’, the days since infection have been adjusted based on the differences in diagnostic delays between the new and old tests, which would therefore affect the average duration of each stage as originally presented in the Fiebig article. These adjustments were made based on recently published estimates of diagnostic delays for a wide variety of assays [Reference Masciotra16, Reference Delaney17]. In some cases, the difference between assays is very small and the EDDI does not change much, if at all. However, in some cases (as in the case of subject V, with dates in bold font) there can be a shift of many days, which is especially relevant for research studies and population-level epidemiological analyses.
More important than the number of days shifted is that the Fiebig staging system only provides meaningful information in cases where a patient presents with discordant test results on a single day, indicating incomplete seroconversion (i.e. during Fiebig stages I–IV). Most individuals present to clinics or research studies after already reaching Fiebig stage V. In these cases, the Fiebig system provides no information about the duration of infection. On the other hand, a key feature of the ‘EDDI system’ is that prior negative test results can be incorporated, including those obtained on dates prior to the positive diagnosis.
The analytical framework, and its implementation in a free and open source online tool [Reference Grebe19] for easily calculating EDDIs, is described in Grebe et al. [Reference Grebe20]. In Pilcher et al. [Reference Pilcher18], the performance of an earlier iteration of the EDDI method is compared with that of Fiebig staging, using only same-day results from the specimens originally used in the 2003 Fiebig analysis. The EDDI method utilises an individual's testing history to generate a plausible interval of calendar days, during which earliest detection by a specified reference test (by default, a viral load assay with a detection threshold of 1 copy/ml) would have occurred. This interval is bounded by the earliest plausible date of detectable infection and latest plausible date of detectable infection. The midpoint of this ‘DDI interval’ serves as the point estimate, or EDDI. Information on the relative diagnostic delays of assays is required. When inter-subject test variability is known, DDI intervals can be computed as 95% credibility intervals (CIs).
A key advantage of the EDDI method over Fiebig staging is that it allows for the generation of a point estimate, as well as an associated CI for the date of first detectable infection, for any person who has at least one positive and one negative HIV test of any kind. The tests do not have to be run on the same day; they do not have to be run during the acute phase of infection and the method does not rely on any special pairing of tests to define ‘stages’ of infection. The size of the interval surrounding the EDDI (and therefore the precision of the estimate itself) depends largely on the length of time between negative and positive tests. The EDDI approach is also completely flexible, seamlessly incorporating any assay for which there is a reasonable diagnostic delay estimate. The tool includes a user-updatable curated database of published diagnostic delays.
To demonstrate the differences in results using various staging methods, we designed illustrative data for six typical individual testing histories, using a wide range of tests run on different days, with different results. In each case, we calculated estimated infection date using (a) the Fiebig stage durations (if applicable) per the original paper, (b) a quasi-Fiebig staging method allowing for substitutions of tests in the same classes as the original paper, despite different diagnostic delays, (c) a similar substitution method application of the ‘4th gen staging’ system suggested by Ananworanich and colleagues in 2015 [Reference Ananworanich21] and (d) the EDDI method. It is worth noting that of these four options, only the EDDI method (d) is flexible enough to be used without requiring modification or substitution to incorporate each of the components of the testing history into the calculation.
Table 2 provides the results of the analysis of these scenarios. It becomes immediately clear that in most cases in which current HIV-testing algorithms are applied, infection dates cannot be estimated using actual Fiebig stage durations. However, the adjusted Fiebig estimates correspond quite closely to the 4th gen staging estimates except in cases of Fiebig stage V, to which the 4th gen method does not apply.
Table 2. Comparison of Fiebig staging, 4th gen staging and the EDDI method for the estimation of infection timing in six individual scenarios
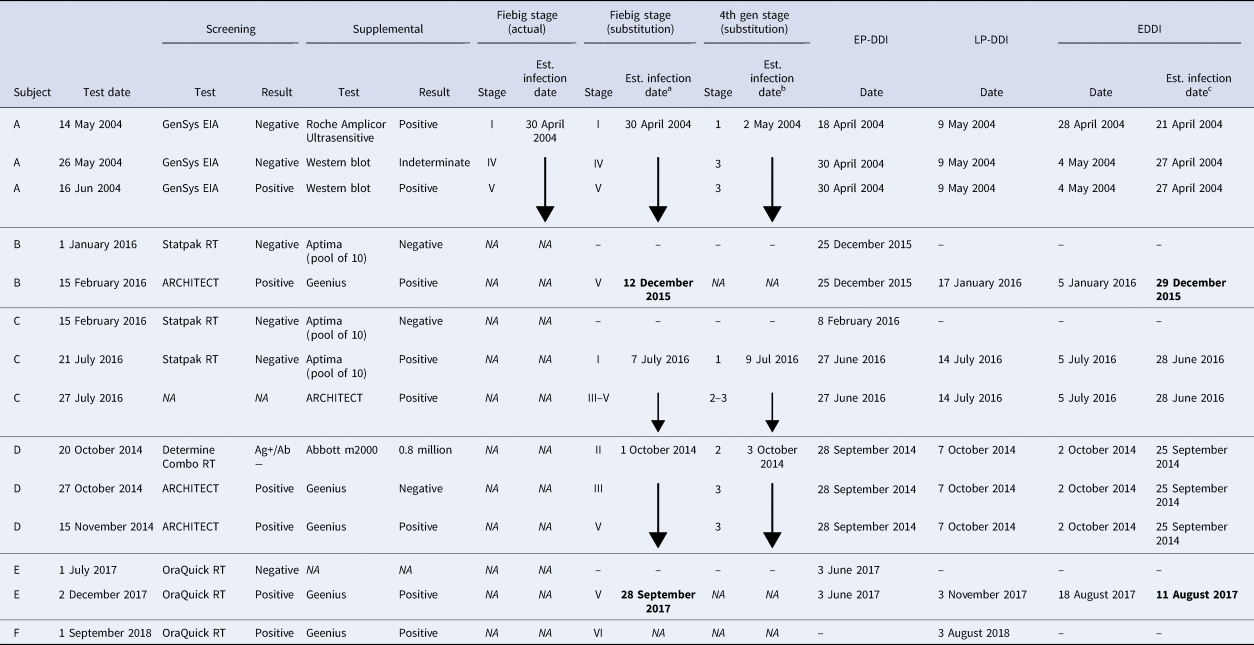
GenSys EIA, Genetic Systems HIV-1/2 antibody; Statpak RT, Alere Clearview Stat-Pak rapid test; Determine Combo RT, Abbott Determine HIV-1/2 Ag/Ab Combo; Abbott m2000, Abbott Real Time HIV01 v1.0 m2000sp/m2000rt viral load assay; OraQuick RT, OraSure OraQuick ADVANCE rapid test used on whole blood; Roche Amplicor Ultrasensitive, Roche Amplicor Monitor v1.5 (ultrasensitive – detection threshold 50 copies/ml); WB, BioRad GS HIV-1 western blot; Aptima (pool of 10), Aptima HIV-1 RNA qualitative assay run in a pool of 10, then repeated on a single specimen to identify this subject as the positive specimen in the reactive pool; ARCHITECT, Abbott ARCHITECT HIV Ag/Ab Combo; UniGold RT, Trinity Biotech Unigold Rapid HIV test; Geenius, BioRad Geenius; Est., estimated; EP-DDI, earliest plausible date of detectable infection; LP-DDI, latest plausible date of detectable infection; EDDI, estimated date of detectable infection.
a Estimated infection dates based on Fiebig stages are obtained by subtracting from the date of diagnosis: half of the duration of the stage at diagnosis, as well as the cumulative duration of all prior stages and the eclipse phase, as estimated by Fiebig et al. [Reference Fiebig14].
b Estimated infection dates based on 4th gen stages are obtained by subtracting from the date of diagnosis: the median number of days from the history of HIV exposure for individuals diagnosed in that stage, as reported by Ananworanich et al. [Reference Ananworanich21].
c Estimated infection dates are obtained by subtracting from the EDDI: the Fiebig et al. [Reference Fiebig14] estimate of the eclipse phase, adjusted for the relative diagnostic delay of the nucleic acid amplification testing (NAT) assay used in that analysis.
In the Fiebig and 4th gen staging systems, the earliest day upon which discordant tests occur result in an assignment of ‘stage at diagnosis’ and a corresponding estimate of infection date; this estimate is not updated upon receipt of further testing information. By contrast, the EDDI method automatically updates the estimates as additional diagnostic tests are run, until the individual has fully seroconverted on the least sensitive assays available.
Indeed, when a patient is diagnosed with HIV during Fiebig stages I–IV, the EDDI using the EDDI method is not a substantial improvement over the ‘substitution’ Fiebig or 4th gen calculations; in our analysis estimated infection dates differed by less than a week in these cases. However, when patients are not diagnosed with HIV until they have fully seroconverted (Fiebig stage V) – which is the vast majority of cases diagnosed in non-research settings worldwide – the tests are not discordant and the standard methods do not apply. Conventionally, researchers then estimate a date of seroconversion using the simple midpoint between the date of the first positive test and the date of the last negative one, ignoring any known ‘diagnostic delays’ associated with the actual tests used. With the EDDI method, this additional information is consistently incorporated into the calculation, potentially changing the size of the plausible interval of infection and altering the midpoint substantially (see dates in bold font).
Classification of infection duration is important in many settings, as evidenced by the persistence of the Fiebig staging method despite its reliance on old technology. Staging infections as ‘acute’ (typically Fiebig I), ‘recent’ (typically Fiebig II–IV) or ‘established’ (typically Fiebig V–VI) is conceptually useful, but this terminology is not aligned with the usage of the terms in the growing discourse on HIV recency estimation, previously applied only for population-level incidence calculations [22–Reference Grebe25]. Ongoing attempts to produce more refined estimates of infection timing using Fiebig methods are biased by failure to adjust for assays actually used in today's research studies or clinical settings.
The EDDI method does not have a built-in categorical infection-stage classification scheme. For example, it is possible to report that for patient M (first testing HIV positive on 1 January 2019, after last testing negative on 14 July 2018) has 3 October 2018 as their EDDI, i.e. the point estimate for the date on which they first had a 50% chance of having their HIV infection detected by a viral load assay with a detection threshold of 1 RNA copy/ml of plasma. (The earliest plausible and latest plausible dates symmetrically surround the point estimate.) Clinicians or researchers are then able to determine and apply thresholds for the number of days since infection (taking into account the size of the plausible interval) for the classification of ‘recent’, ‘acute’ or ‘established’ infection, should they deem this necessary.
Figure 1 demonstrates how a patient's estimated ‘days since EDDI’ can be mapped onto traditional Fiebig stages, using the most current data on the average performance of each relevant class of diagnostic test. However, we caution that this comparison considers only average test performance and DDI point estimates, not their distribution. A direct mapping between Fiebig-based days-since-infection and the new method's days-since-EDDI is not the most robust interpretation of testing history data; rather it is more appropriate to move to a new paradigm of estimating EDDI, then flexibly categorising ‘days since EDDI’ as best suits a particular research question.
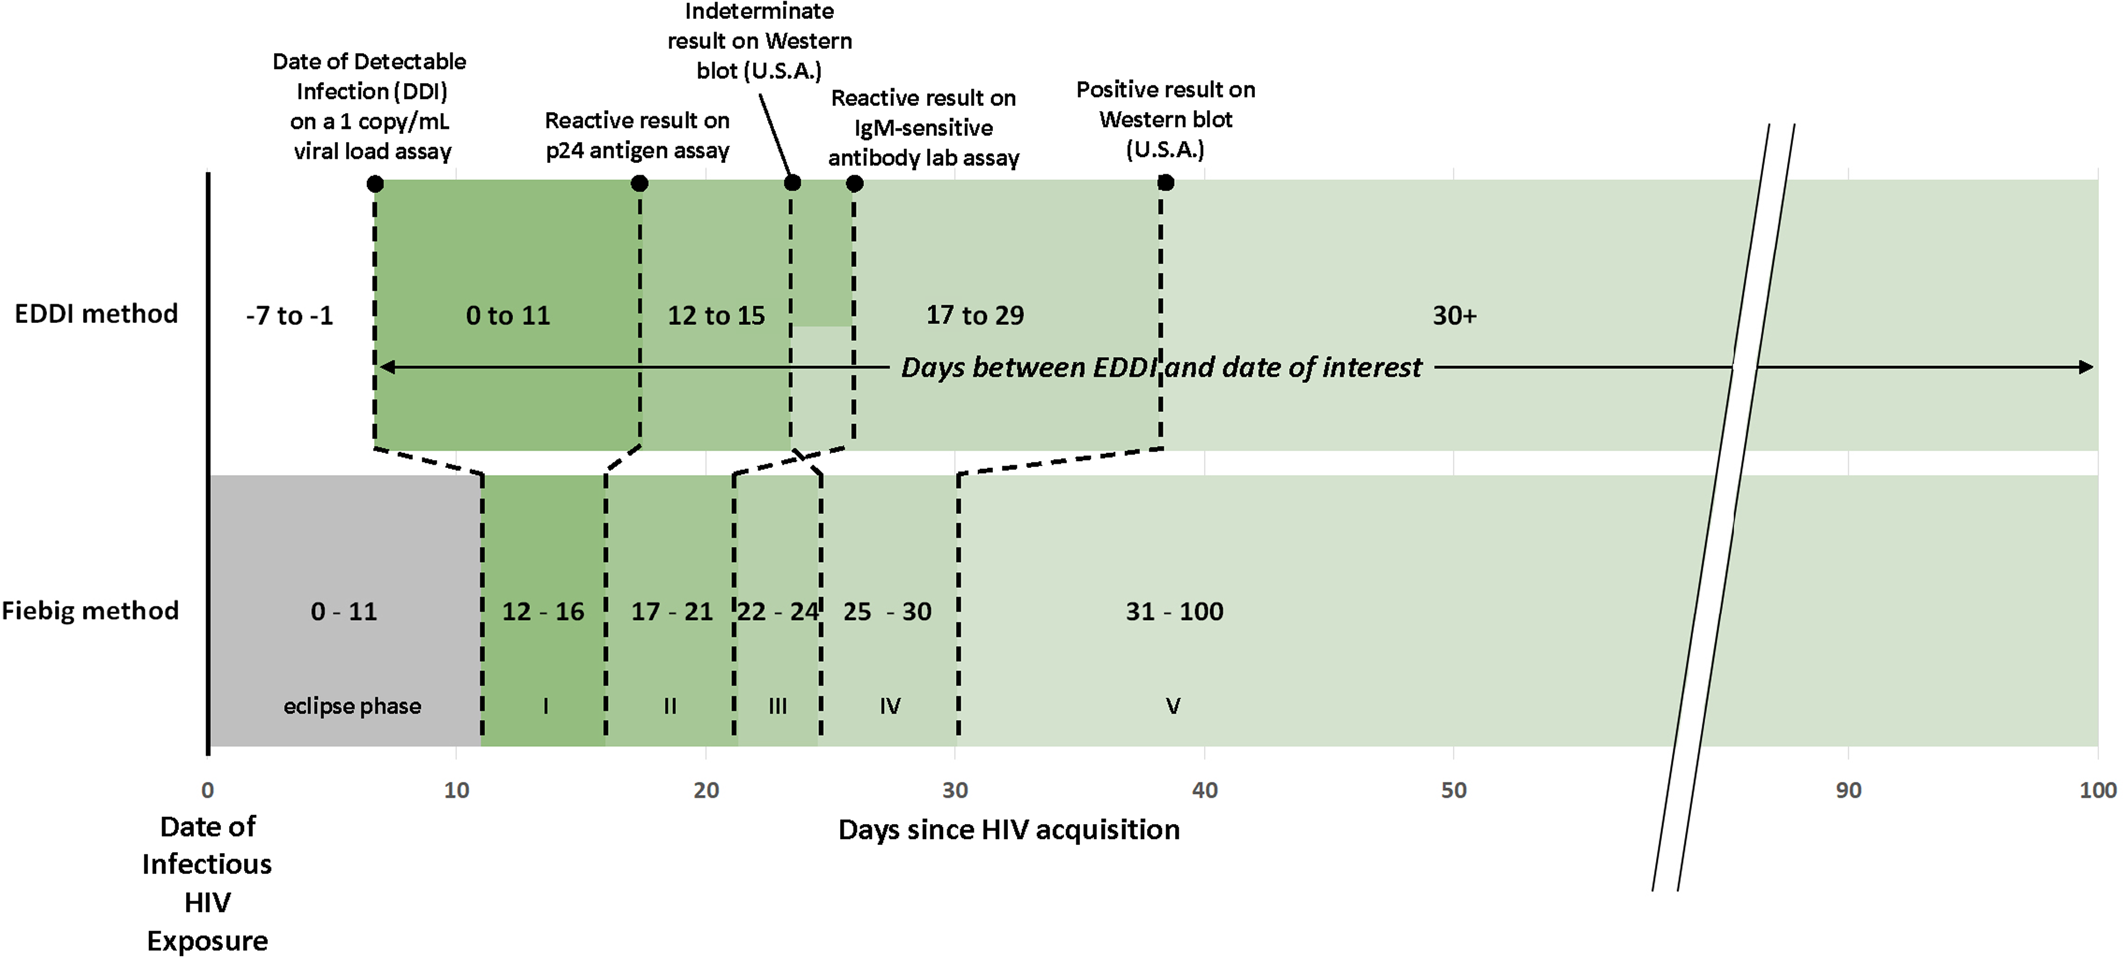
Fig. 1. Comparison of EDDI method and Fiebig method for understanding time since infection.
Importantly, for the EDDI method, ‘day 0’ (DDI) is not the date of infectious exposure to HIV, but rather the first date on which a viral load assay with a 1 copy/ml limit of detection would have a 50% chance of detecting the infection. For this figure, we have estimated a 7-day (mean) delay between HIV acquisition and DDI, using the recent estimate of the average eclipse phase duration of 11.5 days from HIV acquisition to detection with the Aptima HIV-1 RNA Qualitative Assay (Hologic Inc., Marlborough, MA) [Reference Delaney17], and an average 4.2-day delay from DDI to Aptima reactivity [Reference Pilcher18], as was done to convert EDDIs to estimated infection dates in Table 2.
The crossing dotted lines in the figure further underscore the point that as testing technology evolves, traditionally conceived sequential stages of infection (as in Fiebig staging) are not always neatly reflected in assay results. Again, a notable benefit of the EDDI method is that any new assay can be incorporated into the framework, as long as data on the estimated diagnostic delay are available.
Fiebig stages were developed to be indicative of an individual's viral and antibody kinetics at the time of diagnostic testing, allowing for an estimate of days since infection (with assumptions for the eclipse period from exposure to RNA detection). HIV diagnostics have evolved tremendously since that original publication more than 15 years ago, and it is time to similarly evolve the methods used to estimate timing of infection. The EDDI method is a flexible and rigorous way to estimate the timing of HIV infection in a continuously evolving diagnostic landscape.


 Open access