


Introduction
Most forest conversion to other land uses takes place in the tropical domain where intact forests still exist, particularly Central and South America, sub-Saharan Africa and South and South-East Asia (MacDicken et al. Reference MacDicken, Jonsson, Piña, Marklund, Maulo and Contessa2015, FAO 2016). These remaining forests not only harbour the majority of terrestrial species (FAO 2016), but they are also an important reservoir of sequestered carbon (Saatchi et al. Reference Saatchi, Harris, Brown, Lefsky, Mitchard and Salas2011) and provider of indispensable provisioning, regulating, supporting and cultural ecosystem services for humanity (IPBES 2019). Hence, protecting tropical forests is important for mitigating both biodiversity loss and anthropogenic climate change, with several co-benefits (Goetz et al. Reference Goetz, Hansen, Houghton, Walker, Laporte and Busch2015, Nogueira et al. Reference Nogueira, Yanai, de Vasconcelos, de Alencastro Graça and Fearnside2018).
The future of tropical forests remains uncertain due to manifold incentives to convert them to other land uses, particularly through the expansion of transport infrastructure, settlements, markets, cattle ranching and cultivation (Geist & Lambin Reference Geist and Lambin2002, Araújo et al. Reference Araújo, Barreto, Baima and Gomes2017, Nogueira et al. Reference Nogueira, Yanai, de Vasconcelos, de Alencastro Graça and Fearnside2018). In the Brazilian Amazonia, the rate of deforestation increased after 2012 (INPE 2018, 2021), when the country altered its Forest Code, which regulates land use and the management of private properties (Federal Law 12.727; see Soares-Filho et al. Reference Soares-Filho, Rajão, Macedo, Carneiro, Costa and Coe2014). Since then, the rate of deforestation has continued to increase in Brazil, fed by economic recessions and political changes (Watts Reference Watts2016, BBC 2017, Escobar Reference Escobar2019, Menton et al. Reference Menton, Milanez, Souza and Cruz2021).
The rising rates of deforestation increase the importance of existing protected areas (PAs) in Brazil, which in turn heightens the relevance of knowing how well PAs prevent deforestation (Ferreira et al Reference Ferreira, Venticinque and Almeida2005, Veríssimo et al. Reference Veríssimo, Rolla, Vedoveto and Futada2011, Cabral et al. Reference Cabral, Saito, Pereira and Laques2018). Not all PAs are equal, and their specific spatial and environmental contexts, such as the agricultural suitability of the land or the accessibility of the forests, need to be considered when their effectiveness in preventing forest loss (hereafter referred to as ‘impact’; use of terminology according to Pressey et al. Reference Pressey, Visconti and Ferraro2015) is evaluated (Joppa & Pfaff Reference Joppa and Pfaff2011, Nolte et al. Reference Nolte, Agrawal, Silvius and Soares-Filho2013, Eklund et al. Reference Eklund, Blanchet, Nyman, Rocha, Virtanen and Cabeza2016). This can be done through the use of matching methods, which estimate PA impact while accounting for effects of confounding landscape variables (Andam et al. Reference Andam, Ferraro, Pfaff, Sanchez-Azofeifa and Robalino2008, Gaveau et al. Reference Gaveau, Epting, Lyne, Linkie, Kumara, Kanninen and Leader-Williams2009). These methods compare the fraction of forested area lost within a PA to the fraction lost in similar non-PAs (the expected deforestation ‘pressure’), and the resulting impact estimates reflect how the existence of the PA, and not the confounding landscape variables, has helped to retain forest cover.
Until recently, PA impact studies have primarily focused either on the overall average impact of protection at national to global scales (Joppa & Pfaff Reference Joppa and Pfaff2011, Heino et al. Reference Heino, Kummu, Makkonen, Mulligan, Verburg, Jalava and Räsänen2015) or on the comparative impact of broad PA categories (e.g., Soares-Filho et al. Reference Soares-Filho, Moutinho, Nepstad, Anderson, Rodrigues and Garcia2010, Nolte et al. Reference Nolte, Agrawal, Silvius and Soares-Filho2013, Pfaff et al. Reference Pfaff, Robalino, Lima, Sandoval and Herrera2014, Schleicher et al. Reference Schleicher, Peres, Amano, Llactayo and Leader-Williams2017). For research comparing the impact of multiple PAs in the Brazilian Amazonia, the norm has so far been comparisons of aggregated impacts and pressures between broad PA categories, specifically strictly protected, sustainable use and indigenous areas, among which significant differences have generally been found (e.g., Soares-Filho et al. Reference Soares-Filho, Moutinho, Nepstad, Anderson, Rodrigues and Garcia2010, Nolte et al. Reference Nolte, Agrawal, Silvius and Soares-Filho2013, Pfaff et al. Reference Pfaff, Robalino, Lima, Sandoval and Herrera2014, Schleicher et al. Reference Schleicher, Peres, Amano, Llactayo and Leader-Williams2017).
However, recent studies from China (Zhao et al. Reference Zhao, Wu, Long, Hu, Yang and Jin2019), Indonesia (Shah & Baylis Reference Shah and Baylis2015) and Eastern Europe (Butsic et al. Reference Butsic, Munteanu, Griffiths, Knorn, Radeloff and Lieskovský2017) have demonstrated that considerable heterogeneity exists within broad protection categories; the broad generalizations may even be misleading for conservation decisions at the local scale (Shah & Baylis Reference Shah and Baylis2015, Butsic et al. Reference Butsic, Munteanu, Griffiths, Knorn, Radeloff and Lieskovský2017). There is a distinct need to complement such generalized findings in the Brazilian Amazonia by estimating and comparing the impacts of multiple individual PAs, thus providing comparative individual-level impact estimates (Zhao et al. Reference Zhao, Wu, Long, Hu, Yang and Jin2019).
Addressing this gap is the focus of this paper. In the state of Acre, we ask whether the heterogeneity observed in other parts of the world can be observed in the Brazilian Amazonia. Specifically, we ask whether the impacts (avoided deforestation) and pressures (level of deforestation expected in the absence of protection) differ significantly from each other between broad protection categories and compare this to the variation at the level of individual PAs. In addition, we also ask about the quantity of carbon emissions each PA avoided during the study period. Our hypothesis is that there will be differences between broad protection categories, but we also expect to find substantial and important variation between individual PAs within each category.
Methods
Study area
The state of Acre is situated in the westernmost part of the Brazilian Amazonia, and it has established an extensive PA network to protect its highly biodiverse forests (Fig. 1) (Jenkins et al. Reference Jenkins, Alves, Uezu and Vale2015). Approximately 46% (75 497 km2) of Acre is dedicated to PAs (Government of Acre 2017; see Section 1 in Appendix S1 (available online) for more details of the study area).
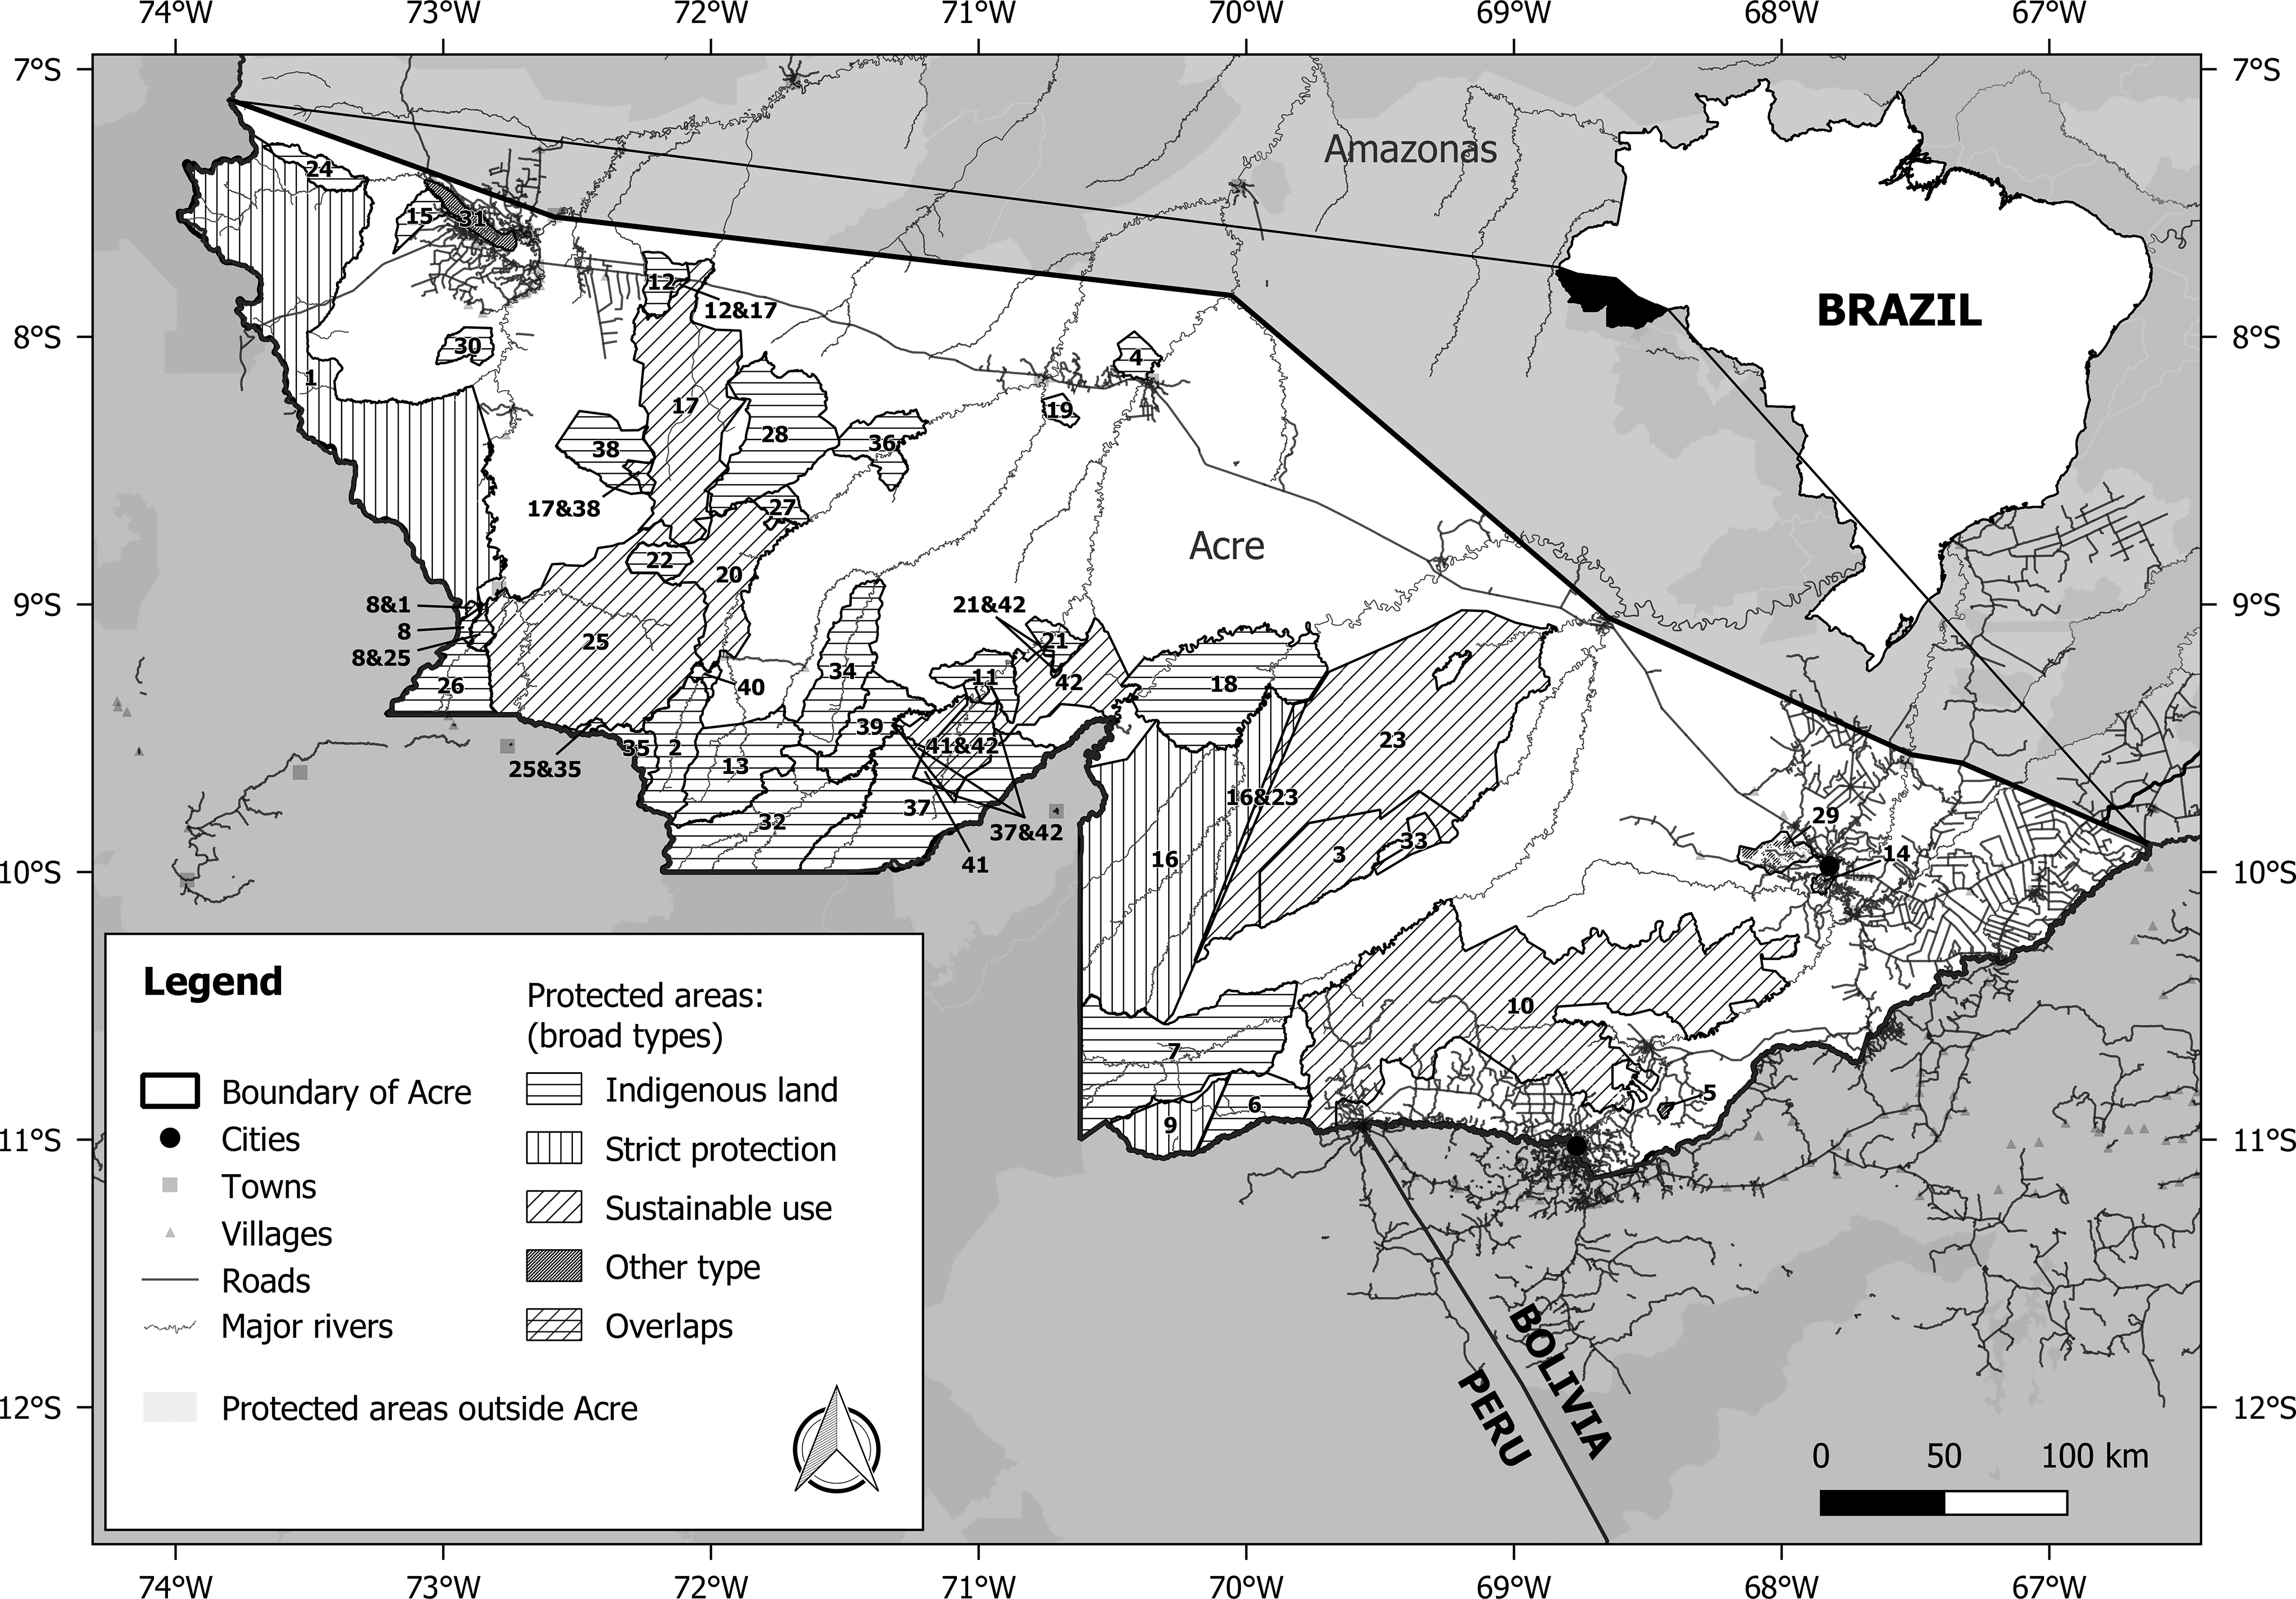
Fig. 1. Protected areas (PAs) in the state of Acre, Brazil. The areas with overlapping protection were analysed independently and have an ampersand in between the PA numbers. See Table S1 for PA names and additional information.
Data
To enable comparisons with earlier studies, we followed the common approach of grouping PAs into three broad categories: (1) strictly PAs, which include state and national biological stations, national and state parks, ecological stations and biological reserves; (2) sustainable use areas, which include state and national forests, extractive reserves and sustainable development reserves; and (3) indigenous areas (for details, see Nolte et al. Reference Nolte, Agrawal, Silvius and Soares-Filho2013). The remaining areas (two Environmental Protection Areas and two Areas of Relevant Ecological Interest), which had been excluded in earlier studies, were categorized as ‘other’ to determine whether the remaining areas differed from the rest when grouped.
We excluded small overlaps between PAs that seemed to represent inaccuracies in the mapped polygon borders. However, some overlapping areas were so large that they likely correspond to cases where an area was protected under two management categories. We combined the largest overlapping areas (>20 km2 in size, to enable sufficient sampling) into a group of their own, referred to as ‘overlapping protection’ or simply ‘overlap’, to account for their contribution in the analyses.
To avoid sampling areas that did not have forests at the start of the study period, we defined forested areas based on forest cover values in the 2010 Vegetation Continuous Fields (VCF) collection, which indicated the percentage of forest cover at 250-m resolution for the year 2010 (DiMiceli et al. Reference DiMiceli, Carroll, Sohlberg, Huang, Hansen and Townshend2011). We defined pixels with 45% forest cover as forest and pixels below this threshold as non-forest. We obtained a deforestation dataset spanning the years from 2011 to 2016 by combining annual PRODES deforestation polygons (INPE 2017).
Following earlier studies (Joppa & Pfaff Reference Joppa and Pfaff2011, Nolte et al. Reference Nolte, Agrawal, Silvius and Soares-Filho2013, Eklund et al. Reference Eklund, Blanchet, Nyman, Rocha, Virtanen and Cabeza2016), we used covariates to ensure that comparisons were made between environmentally similar areas (Table 1 & Section 2.2 in Appendix S1), controlling for potential confounding factors such as travel time (i.e., access) to regional markets (utilizing code provided by Weiss et al. Reference Weiss, Nelson, Gibson, Temperley, Peedell and Lieber2018) and agricultural suitability of the land (Laurance et al. Reference Laurance, Lovejoy, Vasconcelos, Bruna, Didham and Stouffer2002). The travel time calculation considered the distances to roads, rivers and major cities (over 10 000 people), among other relevant considerations (for details, see Appendix S1). The spatial analyses were performed with QGIS (v3.2.3-Bonn) and the travel times were calculated in R (R Studio, version 1.1.453).
Table 1. Datasets used in this study. Resolutions are rounded.
OSM = OpenStreetMap; SRTM = Shuttle Radar Topography Mission; VCF = Vegetation Continuous Fields.
Matching
We used a matching method (Eklund et al. Reference Eklund, Blanchet, Nyman, Rocha, Virtanen and Cabeza2016) to compare individual PAs to environmentally similar non-PAs. To get the datasets needed for matching, we took random samples of points from within the forested areas of each PA and from within the forested areas of the non-PA of Acre, equal to 10% of the forested pixels in each area. Sampling of each PA and the non-PAs was repeated 10 times to control for potential effects of the random sample on our results and to gain a measure of uncertainty. We ran the matching process separately for each of the 10 repeats and aggregated the resulting 10 impact estimates for each PA. The total number of sample points over all repeats for all PAs was 2 739 400 points, counting both protected and non-protected points (see Section 2.3 in Appendix S1 for details). For additional details and a visualization of the approach, see Flowchart S1, Appendix S1, and Eklund et al. (Reference Eklund, Blanchet, Nyman, Rocha, Virtanen and Cabeza2016). We used the R package sp (Pebesma & Bivand Reference Pebesma and Bivand2005) for the random sampling. We performed the matching process using Taito supercluster, which enabled parallel computation with 256 cores (computational resources available for research from CSC – IT Center for Science, Finland).
Avoided deforestation and carbon emissions
Using the impact estimates and the number of forested pixels in each PA, we calculated estimates of avoided deforestation in hectares. The 95% confidence intervals of the impact estimates were used to calculate the confidence range for the hectare estimates. Following this, we calculated a mean carbon density per hectare for each PA using a biomass layer obtained from Rödig et al. (Reference Rödig, Cuntz, Heinke, Rammig and Huth2017) with the assumption that the carbon content of the biomass is 47.1% (the observed mean carbon fraction for tropical angiosperms; Thomas & Martin Reference Thomas and Martin2012).
We calculated the avoided CO2 emissions for each PA by multiplying the carbon density of each PA by the estimated area of forest loss that each PA had avoided and then multiplying the result by 0.9, which we assumed to be the fraction of biomass converted into CO2 following deforestation (Houghton et al. Reference Houghton, Skole, Nobre, Hackler, Lawrence and Chomentowski2000, Numata et al. Reference Numata, Cochrane, Souza and Sales2011). We used the coefficient of variation for the biomass estimates provided by Rödig et al. (Reference Rödig, Cuntz, Heinke, Rammig and Huth2017) together with the lower and upper 95% confidence interval values of the estimated hectares of avoided deforestation to calculate low and high estimates for the avoided carbon emissions (for more details of the emissions calculations, see Section 2.6 in Appendix S1).
Results
Overall, a comparison of forest loss within all PAs and their matched areas indicated that there was less deforestation per unit area within Acre’s PAs than in the non-protected control areas (Wilcoxon signed rank test, V = 55, p < 0.001). The average PA impact, calculated across all PAs and overlaps, was 0.4% (standard deviation 2.4).
The broad PA categories did not differ from each other significantly in their impact estimates (Kruskal–Wallis rank sum test, χ2 = 0.54, df = 4, p = 0.97). Although most individual PAs had a positive impact in terms of avoiding deforestation (Fig. 2 & Table S2), there was substantial variation among them. The impact estimates for individual PAs ranged from avoided deforestation of 3.6% of the forested area (PA 14, Environmental Protection Area in category ‘other’) to induced deforestation of 15.6% of the forested area (PA 5, Area of Relevant Ecological Interest in category ‘other’), compared to the levels of deforestation expected via matching (Fig. 2 & Table S2). The results for the indigenous areas varied from –0.1% induced to 3.0% avoided deforestation, with an overall average of 0.6% avoided deforestation (Figs 2 & S1 & Table S1). Out of all PAs, two had a negative impact, which means that deforestation was estimated to have been induced rather than avoided as a result of their protection status (PAs 5 and 22; Fig. 2). Of the nine overlaps we included, in all but one case the overlaps were between an indigenous area and a PA in another category. Substantial variation and no clear patterns existed in the overlap category.
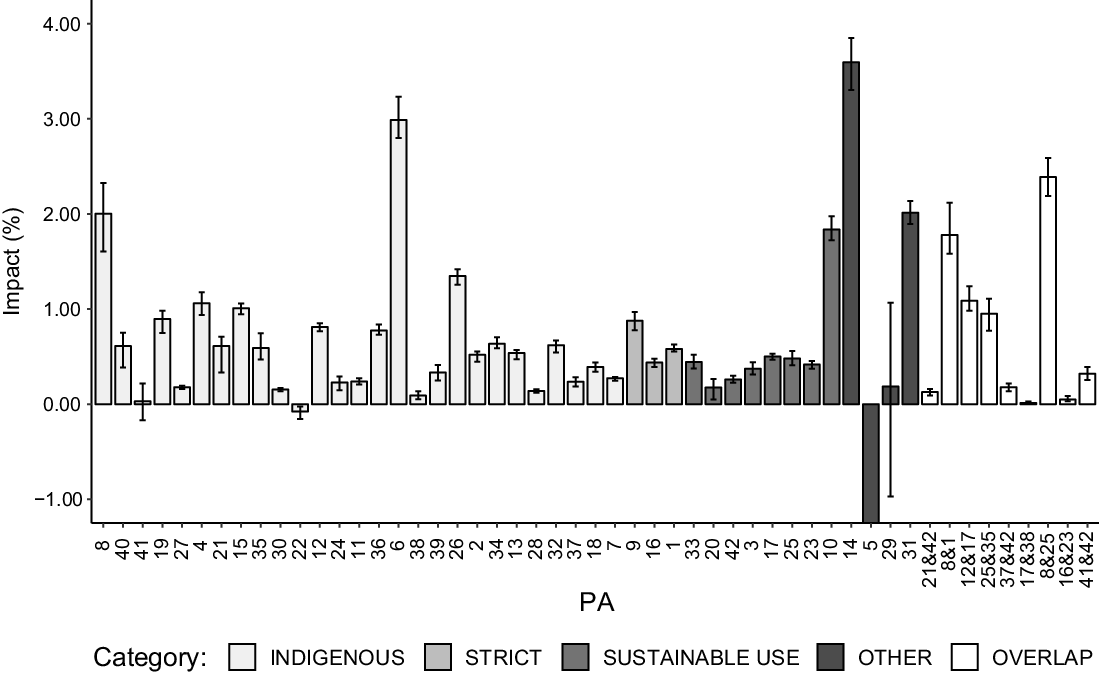
Fig. 2. Estimated protected area (PA) impacts, showing the percentage of avoided forest loss during the study period. Grouped to broad PA categories and ordered from smallest to largest PA within each category by the number of forested pixels in each PA. A negative value implies that a PA has induced deforestation rather than reduced it. The y-axis is cut off as PA 5 extended to –15.59 % (confidence interval –21.82% to –12.43%). 95% confidence intervals derived with a bootstrap method (see Section 2.5 in Appendix S1).
Although all PAs faced deforestation pressures, there was great variation among individual PAs in terms of the amount of pressure (Fig. S2 & Table S2). Seven PAs and two areas with overlapping protection were situated in areas with negative confounding effects, which means that the covariates indicated that they confronted a higher than average pressure to be deforested. The seven PAs were ARIE Seringal Nova Esperança (PA 5), APA Igarapé São Francisco (PA 29), APA Lago do Amapá (PA 14), INDIG Cabeceira do Rio Acre (PA 6), RESEX Chico Mendes (PA 10), INDIG Arara do Rio Amônia (PA 8) and ARIE Japiim-Pentecoste (PA 31), ordered from highest to lowest threat.
In terms of deforestation pressure, the estimates for the broad PA categories did not differ from each other significantly (Kruskal–Wallis rank sum test, χ2 = 0.45, df = 2, p = 0.80). However, PAs in the category ‘other’ faced higher pressures than the other three categories (Fig. S2 & Table S2). Pressures were particularly high for PAs 14 and 29, the two Environmental Protection Areas (APA), and for PA 5, which is an Area of Relevant Ecological Interest (ARIE) (Fig. S2 & Table S2).
On the basis of the impact estimates, we calculated that the PAs of Acre avoided a total of c. 46 600 ha (41 956–51 187 ha) of deforestation during the study period (Table S3), corresponding to 5800 kilotonnes (5024–6644 kilotonnes) of avoided carbon emissions (Fig. 3 & Table S3). PAs 10 (1923 kilotonnes) and 1 (597 kilotonnes) avoided the most emissions on average. Great variation existed among PAs in each broad category, with larger PAs generally avoiding more emissions within each category (Fig. 3 & Table S3).
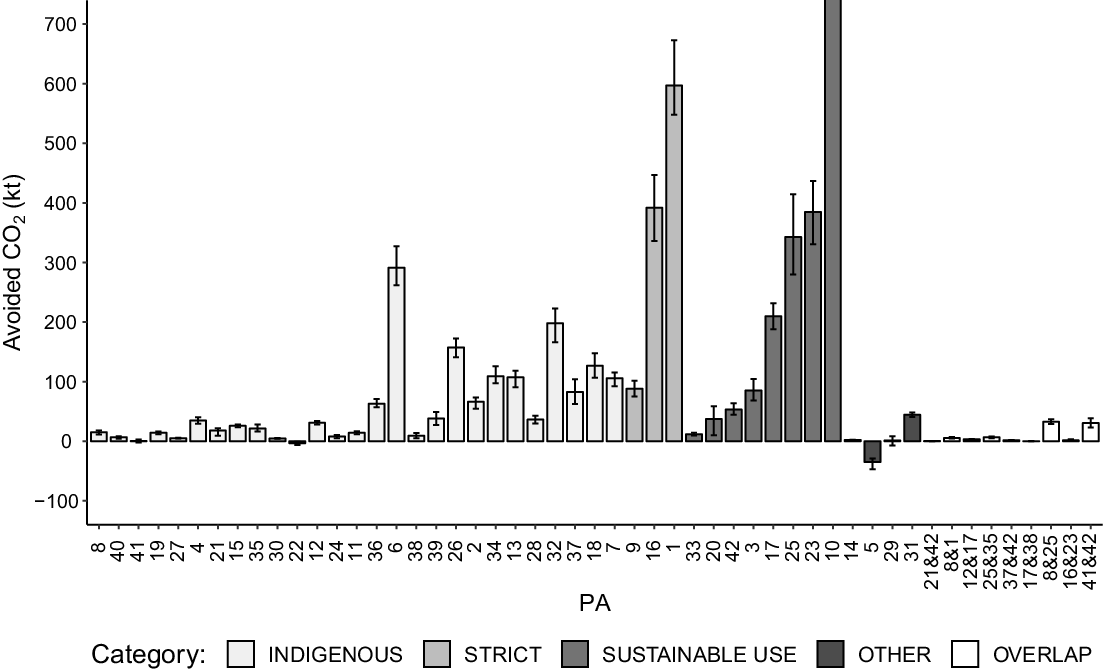
Fig. 3. Estimates of avoided CO2 emissions in kilotonnes for each protected area (PA) during the study period. Grouped to broad PA categories and ordered from smallest to largest PA within each category by the number of forested pixels within each PA. Note that the variation among PAs is so large that even seemingly small bars can in fact represent substantial amounts of avoided emissions. For example, PA 24 helped avoid an amount of emissions equivalent to the total annual emissions of over 1000 Europeans (Table S3 & Section 3 in Appendix S1). The confidence intervals are based on bootstrap-derived confidence intervals for the PA impact estimates and the low and high carbon density estimates for each PA (see Sections 2.5 and 2.6 in Appendix S1). The y-axis is cut off as PA 10 extended to 1923.17 kilotonnes (confidence interval 1734.22–2147.03 kilotonnes).
Discussion
Our results for the state of Acre in Amazonia showed great heterogeneity at the level of individual PAs, which corroborated findings from other parts of the world (Shah & Baylis Reference Shah and Baylis2015, Butsic et al. Reference Butsic, Munteanu, Griffiths, Knorn, Radeloff and Lieskovský2017, Zhao et al. Reference Zhao, Wu, Long, Hu, Yang and Jin2019). Our results showed similar pressures and impacts for each broad PA category during our study period (2011–2016), contrary to what was expected on the basis of earlier studies (e.g., Soares-Filho et al. Reference Soares-Filho, Moutinho, Nepstad, Anderson, Rodrigues and Garcia2010, Nolte et al. Reference Nolte, Agrawal, Silvius and Soares-Filho2013, Pfaff et al. Reference Pfaff, Robalino, Lima, Sandoval and Herrera2014). The reason why PAs in the category ‘other’ faced substantially higher pressures than PAs in the other three broad categories can be explained by their location, as all PAs in the ‘other’ category are within the general deforestation front area (WWF 2015, Pacheco et al. Reference Pacheco, Mo, Dudley, Shapiro, Aguilar-Amuchastegui and Ling2021), and all except PA 5 are also located near major cities. Importantly, our results reveal that all but a few PAs had helped to avoid substantial amounts of emissions.
It is worth considering some of the limitations of our study. Our definition of forests as pixels with 45% or above forest cover in the VCF dataset and non-forests as pixels below this threshold was arbitrary. A different threshold may yield different results because when the threshold is lowered, the potential to omit existing forests, which may have experienced deforestation, declines. However, the trade-off is that simultaneously the risk of sampling non-forest areas that cannot experience deforestation grows (see Section 2.1 in Appendix S1). Future studies could look into alternative forest cover rasters and optimal thresholds for different geographical areas, particularly since the VCF data are not available annually.
We did not consider displacement of forest conversion (i.e., leakage). Out-to-out leakage, meaning deforestation performed by illegal land grabbers who have no attachment to place (Azevedo-Ramos et al. Reference Azevedo-Ramos, Moutinho, Arruda, Stabile, Alencar, Castro and Ribeiro2020), was not considered because matching cannot reliably detect it. In-to-out leakage, or spillover, was not considered either, because previous research has found little to no support for the phenomenon (Soares-Filho et al. Reference Soares-Filho, Moutinho, Nepstad, Anderson, Rodrigues and Garcia2010, Carranza et al. Reference Carranza, Balmford, Kapos and Manica2014, Lui & Coomes Reference Lui and Coomes2016). In fact, PAs may sometimes reduce deforestation in their vicinity (Soares-Filho et al. Reference Soares-Filho, Moutinho, Nepstad, Anderson, Rodrigues and Garcia2010). If so, then our impact results may be considered somewhat conservative, and the potential reduction of deforestation near PAs may have contributed some additional emission reductions. Moreover, by preventing edge-related forest degradation that may occur with deforestation, the PAs may have prevented as much as 10% more carbon emissions than what we estimated, although this number remains uncertain (Numata et al. Reference Numata, Cochrane, Roberts, Soares, Souza and Sales2010, Nogueira et al. Reference Nogueira, Yanai, de Vasconcelos, de Alencastro Graça and Fearnside2018). We also did not account for belowground biomass due to a lack of reliable data for high-biomass forests (Mokany et al. Reference Mokany, Raison and Prokushkin2006). Our estimate will also be more conservative if the carbon content of biomass turns out to be higher than the estimate we used.
In addition, while the lack or presence of deforestation is a clear representation of PA impact, it should not be considered as the sole determinant of it; PAs can be effective along other dimensions as well. Forests may be degraded, for example, by selective logging or by unsustainable levels of hunting, which can result in an ‘empty forest’ (Redford Reference Redford1992, Benítez-López et al. Reference Benítez-López, Santini, Schipper, Busana and Huijbregts2019). Decline in species diversity induced by hunting can have repercussions on the ecosystem functions and services that the forests provide, affecting both the composition of the forests and their carbon density (Lewis et al. Reference Lewis, Edwards and Galbraith2015).
Given that evidence suggests an increasing rate of PA downgrading, downsizing and degazettement in Brazil (Bernard et al. Reference Bernard, Penna and Araújo2014), we should avoid giving the impression that the type of PA does not matter at all, which could be falsely used to support PA downgrading. There are real differences between the various protection types in terms of how much human activity, in particular land-use change, is allowed within the PAs (Nolte et al. Reference Nolte, Agrawal, Silvius and Soares-Filho2013). Even though our data did not show differences in impact between broad protection categories, such could still exist. Previous studies have reported differences in aggregated impacts and pressures for the broad categories in the entire Brazilian Amazonia (Soares-Filho et al. Reference Soares-Filho, Moutinho, Nepstad, Anderson, Rodrigues and Garcia2010, Nolte et al. Reference Nolte, Agrawal, Silvius and Soares-Filho2013), the Brazilian Cerrado (Carranza et al. Reference Carranza, Balmford, Kapos and Manica2014), the Peruvian Amazonia (Schleicher et al. Reference Schleicher, Peres, Amano, Llactayo and Leader-Williams2017) and the state of Acre (Pfaff et al. Reference Pfaff, Robalino, Lima, Sandoval and Herrera2014).
Pfaff et al. (Reference Pfaff, Robalino, Lima, Sandoval and Herrera2014) compared the broad PA categories in Acre and found that only sustainable use areas had a significant impact when compared to matched unprotected lands, in both 2000–2004 and 2004–2008 (2.65% and 1.71% of avoided forest loss, respectively). These authors concluded that ‘clearing prevented by sustainable use areas is higher, since their locations feature higher threat’. The impact was lower for the latter period since deforestation pressures had also decreased (Pfaff et al. Reference Pfaff, Robalino, Lima, Sandoval and Herrera2014).
Our results differ from the results of Pfaff et al. (Reference Pfaff, Robalino, Lima, Sandoval and Herrera2014) in three key respects. Firstly, we found all broad PA categories to have significantly positive impacts as well as pressures. Secondly, we found that the broad PA categories did not differ from each other because the pressures were uniform. During our study period (2011–2016), the amount of deforestation in Acre was lower, on average, than during either one of the periods considered by Pfaff et al. (Reference Pfaff, Robalino, Lima, Sandoval and Herrera2014), although the deforestation rate in our study period was rising from year to year, instead of declining as in Pfaff et al.’s study periods (INPE 2021). It may be that as the more accessible areas have been gradually deforested, the deforestation pressures have become more uniform for each broad PA category in Acre. Thirdly, our results indicate that it is more important to consider and compare the impacts of individual PAs than broad PA categories, particularly at the state level, given the small number of PAs in each category and the huge potential for heterogeneity that exists among individual PAs within each category. This is especially true for reducing emissions from deforestation and forest degradation (REDD+).
The following case examples demonstrate how the impact estimate of a PA is always dependent on the spatiotemporal context. According to our results, deforestation was induced in two PAs during our study period, rather than being reduced. PA 5 (Seringal Nova Esperança, an Area of Relevant Ecological Interest) had the largest negative confounding effect out of all PAs, indicating high pressure, and the PA experienced a very high fraction of deforestation, equivalent to 15.6% of its forested area. Previous research has explained how shortcomings in management, together with a lack of recognition by the inhabitants, has produced socio-environmental conflicts and negative outcomes for the forests within the PA (Lemos Abreu Reference Lemos Abreu2015). Although a large portion of the area has now been lost, the remaining forests might still be highly valuable ecologically, and thus resolving the socio-environmental conflicts should receive immediate attention from all relevant stakeholders. PA 22 (indigenous territory of the Jaminawa and Arara of the Bagé river) also seemed to have induced deforestation, even though the confounding effect for PA 22 indicated lower than average pressures. This can be explained by the fact that PA 22 is a relatively remote and small indigenous area with low expected deforestation, and therefore even the 22.47 ha of deforestation that seems to have been induced (Table S3) was enough to result in a slightly negative impact estimate.
Examples of PAs that had high impact estimates include PAs 14 and 10. PA 14 is the small Lago do Amapá Environmental Protection Area near Acre’s capital city, Rio Branco, and it was estimated to have prevented c. 36 ha of deforestation (equivalent to 3.6% of its forested area). However, PA 14 cannot be considered as particularly ‘successful’, given the amount of deforestation it has experienced over the years, with practically no visible difference to surrounding areas. Similarly, PA 10, the Chico Mendes Extractive Reserve, had a much higher impact than other sustainable use areas at 1.8%, but the impact estimate does not tell the whole story due to the high pressures in the surrounding areas. PA 10 also experienced the largest losses of forest cover and carbon, in absolute terms, out of all considered PAs due to a combination of impact level, size and pressures. The large negative confounding effects for PAs 14 and 10 (Fig. S2 & Table S2) indicate that both were under high pressures, which tested their impactfulness, allowing for high estimated impacts. This demonstrates how impact does not necessarily equate to success and a lack of threat.
Addressing the specific reasons why some PAs do well while others do not and examining what could explain the variation in impacts within protection categories are beyond the scope of this paper, but our findings present pertinent opportunities for future research. As our results demonstrate, remote sensing research can be used to identify potential study subjects for on-the-ground research at the local level to clarify what are the ingredients of a successful PA.
When interpreting the findings for indigenous lands, it is good to remember that these lands were established for the people, not the forests, yet forests are clearly protected by them. Our results showed that 81% of the indigenous areas experienced some deforestation during the study period (range 0.01–0.28% of forested area) compared with 67% of the strict and sustainable use categories combined (range 0.01–20.74% of forested area). The variation in impact we found between indigenous areas was also noted by Nolte et al. (Reference Nolte, Agrawal, Silvius and Soares-Filho2013), who found indigenous lands to be the most effective category in high-pressure locations in Brazil, and we concur with their reasoning that deforestation in indigenous areas may be driven more by internal processes than by external pressures. Future studies could investigate the reasons why deforestation rates are generally lower but more common in indigenous areas than in other broad PA categories and whether there are qualitative differences in the pressures and their long-term outcomes.
As with impacts and pressures, our results showed great variation for avoided carbon emissions, which were nonetheless clearly influenced by the size of the PA within all broad protection categories. This is because even a small percentage of avoided forest loss can mean substantial differences in terms of hectares and avoided carbon emissions when the total area of the PA is large. The larger the forest, the more emissions it can help avoid. This is why PAs 10 and 1 – the two largest in size – also avoided the most emissions.
Conclusions
Our analyses emphasize the importance of focusing on the variability at the level of individual PAs so as not to discount the heterogeneity, complexity and context specificity of conservation. When impact estimates at the level of individual PAs are available and can be compared, resource use and management practices can be optimized to achieve conservation goals (Shah & Baylis Reference Shah and Baylis2015, Butsic et al. Reference Butsic, Munteanu, Griffiths, Knorn, Radeloff and Lieskovský2017, Zhao et al. Reference Zhao, Wu, Long, Hu, Yang and Jin2019). Our results emphasize the importance of comparative individual-level impact estimates for PAs to help guide the conservation of tropical forests for Amazonia and for the other deforestation front areas around the globe.
Acknowledgements
We would like to thank three anonymous reviewers whose feedback greatly benefitted this paper. Daniel J Weiss provided helpful information on the travel time calculations. We also acknowledge CSC – IT Center for Science, Finland, for computational resources. TK wishes to thank Henna E Virtanen for her helpful comments, encouragement and abiding love and support throughout this work.
Financial support
Our work was supported by the Kone foundation (grant 201608614 to JE) and the University of Turku Graduate School (grant to GMM).
Conflict of interest
None.
Ethical standards
None.
Supplementary material
To view supplementary material for this article, please visit https://doi.org/10.1017/S0376892921000229.


