


Policy Significance Statement
This paper deals with the prospective evolution of official statistics to embrace and adapt to new data. The availability of reliable official statistics is the basis for evidence-based policy making in all policy domains.
Introduction
The mission of official statistics is to provide a quantitative representation of the society, economy, and environment for purposes of public interest, for policy design, and evaluation, and as basis for informing the public debate. In other words, official statistics provides the society with knowledge of itself (Letouzé and Jütting, Reference Letouzé and Jütting2015). The production of modern official statistics is based on a system of scientific methods, regulations, codes, practices, ethical principles, and institutional settings that was developed through the last two centuries at the national level in parallel to the development of modern states. At the center of each statistical system is often a single Statistical Office (SO) or a federated network thereof.
Statistical systems were formed in a predigital world where data were a scarce commodity, very costly to acquire at large scale. Consequently, a large part of SO resources was devoted to the collection of (input) data. Surveys (including censuses) and administrative registers have been for decades the only kinds of input data available for official statistics. Therefore, any aspect of the statistical production, including data processing methodologies, data governance models, regulations, organizational practices, and so forth have been tailored to such kinds of data. In the last two decades, following the digitalization, smartification, and datafication of our societies (Cukier and Mayer-Schoenberger, Reference Cukier and Mayer-Schoenberger2013), a wealth of new types of digital data sources become available. In the official statistics community, the term “Big Data” is often used to refer collectively to nontraditional data sources, as a wrapper term for all kinds of data other than survey and administrative data, but we prefer to use the term “new digital data” instead.Footnote 1
Several SOs around the world are now seeking to use new digital data in addition to legacy data sources in order to improve the process of statistical production.Footnote 2 This trend is motivated by multiple prospective benefits that (the statistical indicators based on) new data sources promise to deliver: improved timeliness, finer spatial and/or temporal resolution, increased level of detail, better accuracy, increased relevance, and (possibly in the long-term) lower production cost of official statistics. However, the potential gains that might come tomorrow involve several important challenges to be addressed today. In fact, the new types of data are not just (and not always) more or better than the traditional data: they are fundamentally different along multiple dimensions, and a systematic critical review of such differences reveals that adopting new types of data for official statistics requires (and induces) changes in almost every aspect of the statistical system: processing methodologies, computation paradigms, data access models, regulations, organizational aspects, communication and disseminations approaches, and so forth.Footnote 3 The term “Trusted Smart Statistics” (TSS) was put forward by Eurostat to signify this evolution (Ricciato et al., Reference Ricciato, Wirthmann, Giannakouris, Reis and Skaliotis2019b) and officially adopted by the European Statistical System (ESS) in 2018 in the so-called Bucharest memorandum (European Statistical System Committee, 2018). The design principles of TSS are further elaborated in the following sections.
Since in most countries the new data sources will complement but not replace the legacy ones, the established components of the statistical systems will not be dismissed but rather augmented by new ones. In other words, the prospective evolution path for the statistical system will take the form of a systemic augmentation. By analogy, we may think of data sources as fuel, and the statistical system as an engine: the new fuel cannot be fed into the legacy engine, and statistical systems need to develop a new type of engine, with different operational principles than the legacy one, tailored to the peculiarities of the new data fuel. The future statistical system will eventually be a multi-fuel machine with two engines, and TSS is how the ESS calls the new engine that is to be developed.
The design process of TSS must start from the consideration that the operational conditions around official statistics have changed. As in other socio-technological systems, the change involves not only the hardware and software layers, but also the humanware level (processes, organization, regulations, and practices). In fact, the availability of new digital data sources comes as part of a larger change in how the people perceive, use, and, in general, relate to digital data and technologies. This has an impact on what citizens and users expect from official statistics. In other words, the ongoing evolution of official statistics does not only entails new technical opportunities (what SOs can do now that was not possible beforehand) but also new social expectations and duties (what SOs are supposed to do now that was not due beforehand) that, more or less directly, encompass not only what statistics are to be delivered, but also how they are produced.
Another aspect of change associated with the datafication of society is the proliferation of data players both in the public and private sectors. In the pre-datafied world, SOs were the exclusive monopolists of a rather narrow business, where the only alternative to official statistics was no statistics at all. Today, SOs are one species among many others in a crowded data ecosystem. Multiple players in the private and public sector are now breeding on vast fields of new data, and some of them will unavoidably compete with SOs by offering alternative views. As alternative non-official statistics proliferate, the power of the label “official” to signify credible, accurate, and trustworthy will come increasingly under strain. In other words, SOs must face not only an increased availability of externally collected data, but also a change in attitudes and behaviors by the citizens and other stakeholders in the new data ecosystem. The TSS concept is the answer of official statistics to the new scenario.
Drivers for Change
In this section, we highlight some aspects of the new data ecosystem that must be taken into account for designing the TSS concept.
Micro-data and nano-data
The traditional data sources used for official statistics, namely surveys and administrative registers, represent features that are static, changing occasionally or anyway aggregated at coarse timescales (month, quarter, year). A single record consists of a collection of variables referring to an individual data subject (person, household, company) and the term micro -data is used to distinguish them from the aggregate indicators referred to groups and populations at the super-individual level, called macro -data. A set of enablers (rights to access) and safeguards (obligations to protect) are encoded in the statistical legislation to regulate the use of personal (micro-)data for the production of official statistics.
Nowadays, smart devices and sensors allow for the continuous collection of more detailed data at sub-individual level, for example, the instantaneous location, every single economic transaction and social interaction, every single step, heartbeat, and so forth. With such new data sources, data points refer to single events, transactions, encounters, or movements at sub-individual level. Data are measured continuously and at very fine timescales. We propose to use the term nano -data to refer to data records at sub-individual level.Footnote 4 Such change of scale, from micro to nano, has multiple implications for the production of official statistics, as we explain hereafter, and motivates the use of distinct terms.
The first implication is, of course, that the volume and velocity of production may be much larger for nano-data than for micro-data. Therefore, the base of the pyramid enlarges, as sketched graphically in Figure 1. Recall that the main role of official statistics remains the production of aggregate indicators at the macro-level (the top of the pyramid in Figure 1) to represent parsimoniously the whole society. Apart from data collection, we may regard statistical production as a reduction process from large amount of micro-/nano-data toward a parsimonious set of macroscopic statistics. Starting the processing from nano-data involves higher consumption of computation resources by the machines that execute the computation. However, it also implies thicker methodologies and longer analytic workflows, with additional computation functions and layers that were not previously needed. In other words, processing nano-data put more work not only on the machines that will eventually execute the computation, but also on the human experts that must design the computation methods (and write the associated code). Thicker and more complex methodologies translate into a higher number of subjective choices that human experts perform, implicitly or explicitly, along the process of methodological development (and code writing). This amplifies issues of methodological sensitivity and subjectivity, and reinforces the need to exercise a critical view on the methods and algorithms (and code) that are eventually set in place and applied to the data (Kitchin, Reference Kitchin2017).
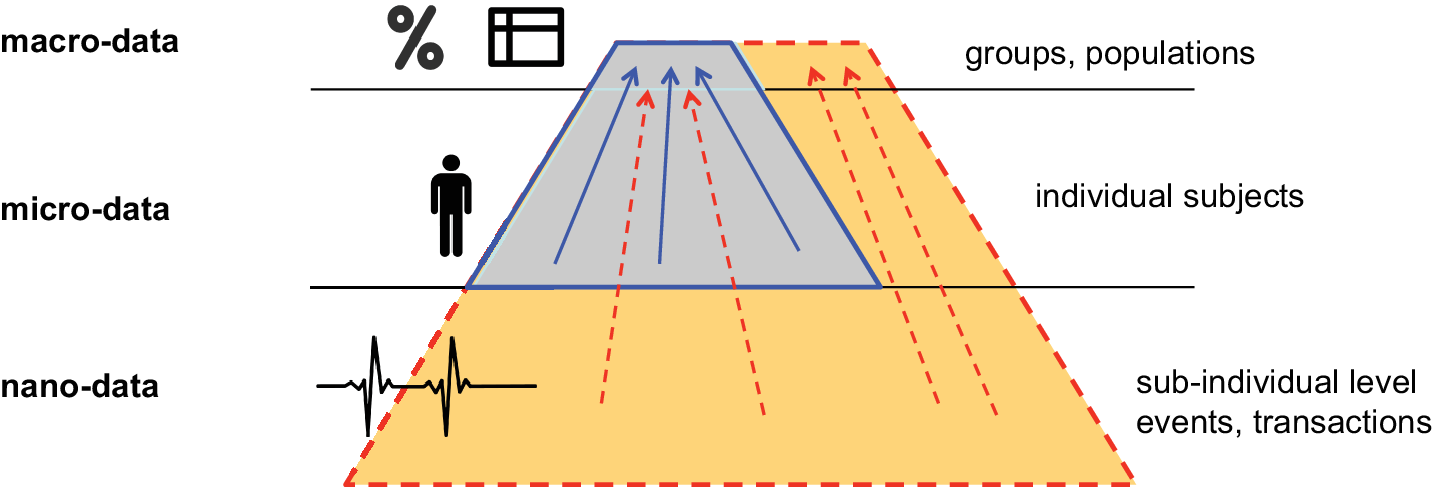
Figure 1. Graphical representation of the official statistics production as a reduction process, from micro-data at individual level to macroscopic indicators for whole populations. Nano-data represent an additional level for sub-individual units (events, transactions).
A second implication of using nano-data is the increased level of risk. Nano-data are potentially more invasive than micro-data: they qualify an individual subject well beyond a set of summary features, representing an ultra-detailed view of his/her behavior. Consequently, the risks associated to the potential misuse of nano-data are considerably larger than for micro-data, not only for the individuals, but also for the whole collectivity. The palette of potential risks includes, but does not end with potential breach of individual privacy. It encompasses also the possibility to exert mass surveillance, to enable different dystopian forms of social control, and to generate more subtle, less evident forms of power asymmetries that are examined by scholars in the growing field of Critical Data Studies (see Boyd and Crawford, Reference Boyd and Crawford2012; Iliadis and Russo, Reference Iliadis and Russo2016; and references therein). While a detailed examination of such risks goes beyond the scope of the present contribution, the point to be taken here is that the set of enablers and safeguards developed for micro-data is not necessarily sufficient for nano-data. For example, while concentration of personal micro-data for the entire population at a single trusted administration might be considered acceptable, concentration of personal nano-data is another story. Compared to the established practices in place for personal micro-data, stronger safeguards should be required (by the law and by the public) to protect the confidentiality of personal nano-data. This makes the case for adopting hard technological solutions in addition to soft provisions (laws, codes of conduct, organizational agreements, etc.) to strengthen the degree of protection.
Availability of new computing technologies
The availability of new kinds of data comes hand in hand with the availability of new tools on the side of computation technologies. Recent advancements in the field of machine learning allow to interpret unstructured data like images, speech or text, enabling their use for statistics production. Virtual assistants based on artificial intelligence (AI) might play a role in interacting with respondents in future surveys. Privacy enhancing technologies (PET) allow to extract information from confidential data without sharing them (UN GWG Big Data, 2019). Blockchains, distributed ledger technologies, and smart contracts might redefine the relation between data producers and data consumers. Likewise new data sources, also new computation technologies represent powerful enablers in the hands of SOs. They should be seen as elements to be composed in a larger system together with nontechnological elements at the humanware layer. Using these technologies should be seen as a means to achieve a set of desirable system-level properties, not as a goal in itself. Therefore, SOs should first formulate a clear view of what system-level properties are desirable and aligned with the societal values that official statistics is there to serve, and from there move towards selecting the technological solutions that, composed with other components, are instrumental to achieve these goals.
New digital behaviors
SOs must not only cope with the availability of new digital data and new digital technologies, but also with new behaviors and attitudes by the citizens. Traditional survey models based on paper questionnaire are based on a batch of questions presented to the respondent during a single survey session. Such kind of concentrated interaction model, where many questions are presented in a relatively short interval, has not changed with telephone-assisted and computer-assisted interviews. Nowadays, SOs can channel their surveys through smartphone apps: this allows to dilute the so-called burden on respondents over much longer intervals, even months or years, with a continuous flow of questions presented at very low-rate over long intervals, in the background of the respondent’s normal activities. Questions can be selected based on context information as inferred from passive sensors onboard the smartphone.Footnote 5 AI assistant tools might be used to decide when and what question to ask.
What we have outlined insofar is basically the concept of Smart Surveys. Through the smartphone app, the SO has the possibility to establish a continuous, long-term two-way dialogue with the respondent: it is now possible to feedback individualized reports, to disseminate selected figures and statistics of special interest for particular groups, and to better communicate the importance of official statistics. In the bi-directional dialogue with the respondent, the SO can fine tune the appropriate level of interactivity. Such fundamental change of paradigm is enabled not only by the availability of mobile technologies, but also by the fact that continuous interaction with mobile apps is considered rather normal nowadays. It is not only a matter of exploiting new digital technologies, but also leveraging the new digital behaviors and new digital attitudes—and confronting with new digital feelings (Kennedy, Reference Kennedy2018)—that citizens have developed through the daily use of such technologies since more than a decade. In other words, if “we are our tools” (see Boyd and Crawford, Reference Boyd and Crawford2012 and references therein), the citizen-with-a-smartphone today is a different subject than the citizen in the last century (without a smartphone), with different behaviors but also with a different view of and expectations with respect to data and statistics. And this change of behaviors, view, and expectations does influence the role of and the relationship with the SO.
In the private sector, marketing strategies are increasingly relying on continuous low-intensity interaction with customers via mobile apps, and in principle similar models—with appropriate adaptations—may be adopted by public institutions for public interest purposes, and specifically by SOs to produce better and more relevant official statistics. That does not mean that SOs are called to emulate marketing practices from the commercial sector. Rather on the contrary, SOs have the opportunity to pioneer new models of data collection and data use based on their constituent principles of transparency, openness, independence, and democratic control (United Nations, 2014), and therefore show the way to other public institutions (but also to the private sector). In other words, SOs might play a pivotal role in enabling the collectivity to (re)gain the public value of and democratic control over its data. In doing so, SOs should remain critical and vigilant of the possible negative consequences and unintended effects, not least the risk of distorting—or anyway influencing excessively—the social phenomena they aim at measuring. A truly critical view calls for caution and thoughtful consideration, not merely denial of the new possibilities out there. Taking a critical design approach, SOs can design new survey models that ripe the potential benefits of the new (data, technologies, behaviors, and attitudes) while minimizing the potential risks.
TSS principles
The operational definition of the TSS concept is a strand of ongoing work, initiated and led by Eurostat, that involves a continuous dialogue within the ESS members and with various external stakeholders, including private data holders, technology providers, academic communities, data protection authorities, and other branches of the European Commission. While the authors’ work is mostly focused on the European scenario, we believe that many of the concepts and ideas embedded in the TSS vision are relevant and applicable also to other statistical systems worldwide. In this section, we briefly sketch the main design principles and system components that collectively represent our current view of the TSS concept.
From sharing data to sharing computation
The increased sensitivity of personal nano-data and the need to avoid the higher risks associated to their concentration drive towards the introduction in the statistical system of computation models based on distributing the computation outwards (to the data sources) as opposite to concentrating the data inwards (from the data sources) during the statistics production phase, as sketched in Figure 2. This trend towards moving computation instead of data is further reinforced by the fact that often new digital data are produced by the private sector (privately held data) and therefore might be sensitive also from a business point of view. Business sensitivity and privacy sensitivity should be seen as independent issues, and depending on the particular type of data one or both are relevant. Whenever external data generated outside the SO are regarded as sensitive, whether for privacy and/or business reasons, the shift from pulling data in (to the SO) towards pushing computation out (to the data source) is functional to hardening the protection of data confidentiality. This approach, which is already at the basis of other initiatives in the private not-for-profit sector (see, e.g., the OPAL projectFootnote 6), represents a fundamental paradigm change for statistical systems, with important implications at multiple levels, not only technical, as discussed below.
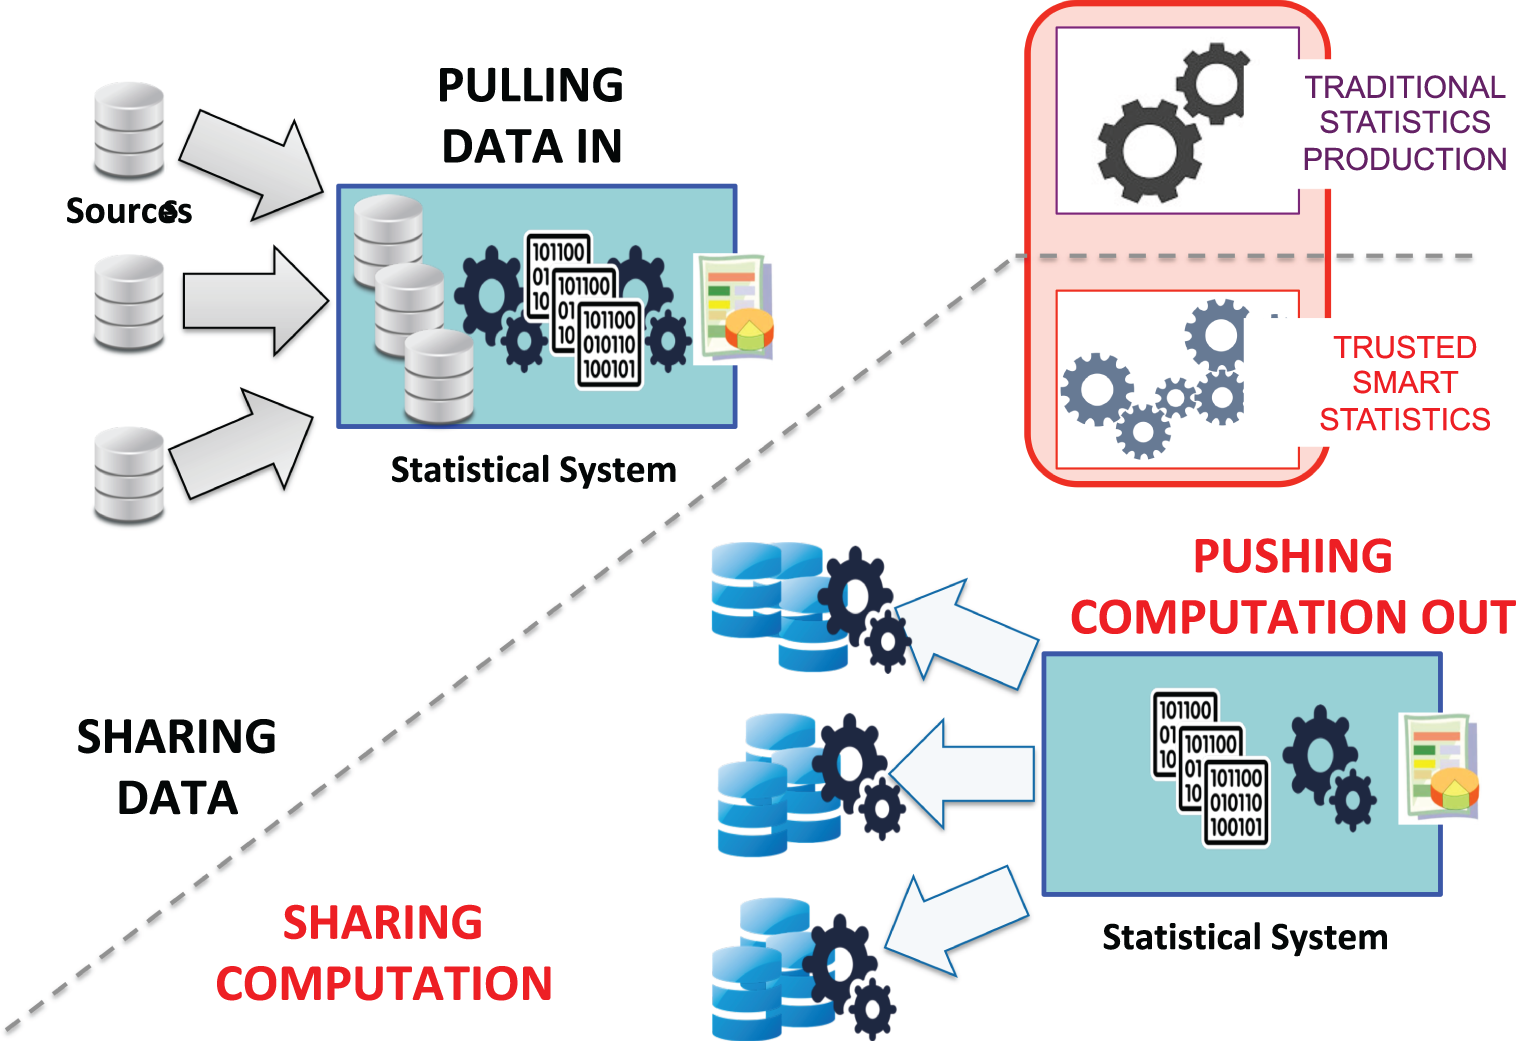
Figure 2. Pushing computation out versus pulling data in.
Besides stronger protection of data confidentiality, moving part of the computation to the data sources often (but not always) allows to minimize the global requirement for technical resources. The rate and volume of new digital data is often huge, but only a tiny part of the information embedded in the data is relevant for official statistics. We may regard the whole analytic methodology as a chain of smaller analytical modules designed to extract the desired final statistics from a huge amount of input data. Very often the volume and/or rate of intermediate data is greatly reduced after the first few blocks, where relatively simple selection and aggregation functions tend to be concentrated.Footnote 7 Executing such processing blocks at the source saves on communication bandwidth and avoids duplications of storage. In summary, sharing computation with the data sources is often a convenient option both in terms of lower costs (for computing resources) and stronger protection of data confidentiality.
Sharing control over computation execution
The move from sharing data to sharing computation entails a shift from delegating control (from the data holders to the SO) to sharing control (between the SO and data holders) on the process of statistical production. When data are moved to another entity, it is technically possible, although legally forbidden for the latter to use the data in ways and for purposes that deviate from what was agreed beforehand. In other words, notwithstanding the possible legal restrictions, from a strictly technical point of view moving data means delegating control. On the other hand, if the computation process is distributed (shared) between SO and data holder(s), each entity remains in direct but nonexclusive control of the process. That means, the potential use of data for other purposes and/or in other ways (e.g., with different algorithms) than what was declared and agreed beforehand can be made technically impossible. In other words, sharing computation (distributed computation) implies sharing control.
From a more abstract point of view, control sharing with other key stakeholders about how and for what purpose the data are used is a fundamental system property, key to build trust into the whole process. Depending on the particular case, control sharing could be extended to other stakeholders beyond data holders. In general, any stakeholder carrying a legitimate interest as to how the data are used might be given direct, nonexclusive control over the process or some part thereof. For an illustrative example, in a scenario where the SO aims to extract statistics from the personal data collected by private companies about their customers, a civil rights association or privacy watchdog agency may be called to share direct (but nonexclusive) control with the SO and the private data holders. In this scenario, each party can ensure directly, with no delegation, that its legitimate interests are safeguarded: for example, the SO will ensure that methodological quality is preserved, the private data holder will verify that business compatibility is respected, and the citizen association will guarantee that civil rights are adequately protected.
We discriminate between active and passive control. The former means that a potentially nonlegitimate computation instance cannot take place without the ex-ante agreement of all active controllers. The latter means that any computation instances, including possibly nonlegitimate ones, will be surely made known ex-post to all passive controllers. Active control can block ex-ante, while passive control can only detect ex-post. Active control is stronger, but the value of passive control should not be underestimated: it involves a certain power of deterrence that contributes to prevention of abuses, in addition to allowing reaction. In principle, ex-post control might be open to the public if technological solutions are adopted to ensure public auditability of what queries are run on the data. Opening up passive control to the whole public is a fully legitimate option, probably to be considered as the default option when it comes to using new data for public interest. The increasing interest for distributed ledgers (spurred by the success of the now-fashionable blockchain technologies) contributes to build expectations in this sense by citizens and users of official statistics.
The design of a control sharing configuration for a particular instance involves the decision about which stakeholders are granted active and/or passive control. The design must take into account not only the prospective benefits, but also a critical consideration of the associated costs and risks. Like any consensus-based mechanisms, sharing active control requires time and organizational procedures to achieve agreements among all controllers. Generally speaking, the cost of adding a new active or passive controller should be considered against the cost of not doing so: the careful consideration of certain implicit cost items (e.g., reputational risks, or a reduced degree of public acceptance that could in turn induce lower participation and/or reduced data quality) might lead to determine that adding a new controller is indeed the minimum cost solution.
Another aspect to be considered relates to the (un)availability of competent staff with adequate technical skills on the side of the controller(s). Ideally, a multi-disciplinary team comprised of experts from different fields (e.g., experts in computer science and social sciences, statisticians, and law experts) would be needed to understand and critically examine the methodology (or algorithm) encoded in a piece of software code, to critically identify the assumptions and design choices at the basis of such methodology, and to critically determine the potential implications in terms, for example, of bias, uncertainty, correctness, and so forth. Not all organizations might have such a multi-disciplinary team today, and the acquisition of missing skills is certainly an additional factor in the cost equation. However, if sharing computation control is put in place, organizations in controlling roles would be incentivized to build such multi-disciplinary teams, and in this way reduce the digital divide and foster a more generalized critical approach to the analysis and interpretation of data (Boyd and Crawford, Reference Boyd and Crawford2012).
Engineering trust
Generally speaking, sharing computation is one means, but not the only one to achieve sharing of active control. We may adopt other technical solutions to ensure that only computation instances approved by all involved parties can be executed (shared active control) also when computation is centralised. The design of such solutions at the technical level must takes into account specific requirements case-by-case, and it is unlikely that a single solution will fit for all use-cases. The set of possible components at our disposal include cryptographic tools, secure multi-party computation (SMC) techniques (Archer et al., Reference Archer, Bogdanov, Kamm, Lindell, Nielsen, Pagter, Smart and Wright2018), trusted execution environment (Sabt et al., Reference Sabt, Achemlal and Bouabdallah2015) and in general any flavor of so-called Privacy Enhancing Technologies (UN GWG Big Data, 2019), distributed ledgers (including but not limited to blockchains), and so forth. These technologies, however, should not be seen as complete solutions, but rather as components available to be selected and composed with others to engineer a larger architecture aimed at delivering trust. For example, the solution envisioned in (Zyskind et al., Reference Zyskind, Nathan and Pentland2015) combines blockchain and SMC, but this is only one particular point in a much larger solution space that is still largely unexplored.
We are probably at the inception of a new engineering field that we may call trust engineering. It is a field that blends together security engineering and privacy engineering but extends over the scope of both domains. Like those, trust engineering must consider all layers of a socio-technical infrastructure: hardware, software, and humanware (practices, behaviors, and organizational processes). Defending against security breaches and personal re-identification threats are part of the task. SOs know how to deliver such guarantees for traditional data, but now they need to develop new, stronger solutions for the new, more pervasive digital data. In doing so, they need to counteract additional threats against the whole collectivity that do not fall in the traditional scope of security and privacy domains. In a nutshell, SOs are well positioned today to act as pivots of a new global system to exert public social control on data usage in order to prevent the risk that, on the opposite direction, data may be used as instruments for social control. It is also important to remark that adoption of strong safeguards must be accompanied by their effective communication in order to achieve public acceptance. In summary, strengthening safeguards against data misuse at all levels, and communicating that such safeguards are in place, are both consequences of and preconditions for using more and deeper data: this circular reasoning is exemplified in Figure 3.
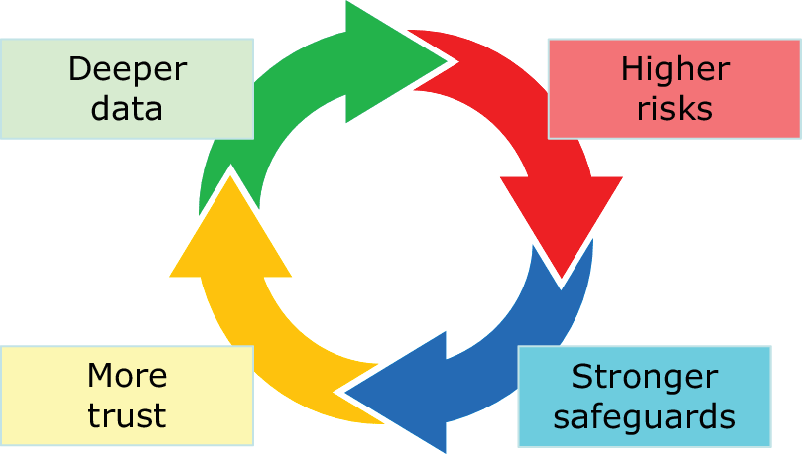
Figure 3. The circular relation between data, risks, safeguards, and trust.
From methodologies to code
Moving computation outside the SO domain implies full automatization of the statistical production process, that must be necessarily encoded into binary code executable by machines—and not only into methodological handbooks targeted to human experts—as a prerequisite to be exported outside the SO. If the statistical methodology is encoded into a software program, the phases of methodological development (writing the source code) and production (executing the binary code) are clearly distinct. Such separation allows to export the physical computation (code execution) outside the SO, partially or in full, without giving away control over the methodology (code writing). In other words, where the code runs remains independent from what the code does, and sharing control over the execution, in the production phase, does not imply any loss of control by the SO over the development of the statistical methodology.
SOs will increasingly identify a statistical methodology with a (possibly large and complex) piece of software. This change of paradigm has multiple additional implications. First, it enables SOs to regularly publish machine-readable executable code, not only human-readable methodological manuals, thus stepping up the level of methodological transparency, public auditability, and independent verification of statistical methodology (Grazzini et al., Reference Grazzini, Lamarche, Gaffuri and Museux2018; Luhmann et al., Reference Luhmann, Grazzini, Ricciato, Meszaros, Giannakouris, Museux and Hahn2019; Stodden, Reference Stodden2014). To this aim, SOs can learn practices and apply principles from the open-source movement toward an open-source statistics.
Second, it will more naturally lead toward the development and implementation of statistical methodologies that are highly modular and evolvable—as is good software. A modular and evolvable software architecture will reflect a modular and evolvable organization of the statistical methodology, and doing so is particularly compelling when processing new digital data sources, due to their increased complexity and to the fact that such data were primarily designed for other purposes (then repurposed for official statistics as a secondary use). In a modular architecture (of the methodology and of its software implementation) each individual component can be reused, that is, exported to or imported from other workflows, within and outside the same organization. This in turn eases and fosters co-development by multiple methodological contributors and inspection of code/methods, within the statistical systems and between SOs and external experts (e.g., researchers and domain experts from data holders), but also the reuse, replication and independent validation of the methods. A modular architecture is a prerequisite for evolvability, as each component can evolve and adapt independently from the others, following changes in the data generation and/or methodological advancements.Footnote 8 Good software is architected to be continuously evolvable, so should be statistical methodologies. SOs know how to deal with (input) data coming from multiple sources and subject to temporal changes, and they now must learn to apply the same principles to their methodologies and code. The identification of statistical methodology with software code suggest that SOs may import established practices, principles and tools from the field of software development, where such issues are the daily bread and butter. Track versioning and good documentation should be regarded by statisticians not less central to their profession than data lineage and meta-data. At the end of the day, as long as some piece of code was instrumental to produce in output some data  $ Y $ based on the processing of input data $ X $, that piece of code should be legitimately regarded as a key meta-data element for $ Y $.
The identification of statistical methodology with software code may sound weird to those professionals that interpret these items as ontologically distinct matters: one up-in-the-sky of maths (and of course statistics), the other down-the-ground of software programming. This view might perhaps be viable as long as statisticians deal with data that are amenable to be treated with parsimonious models, with a limited number of parameters, for which a formal representation (in maths formulas) can be given that is reasonably decoupled for a particular software implementation. In such condition, a formal representation of the statistical methodology can be documented in human-readable manuals, and we may expect that different software implementations of the same methodology would not produce results that are too different from each otherFootnote 9. In other words, the formal representation in human-readable manuals retains its descriptive power
This approach is seriously challenged by new digital data whose generation process tends to be much more complex than for traditional data. The fact that such data were primarily designed for other purposes adds further complexity to their processing (repurposing) for official statistics. Their correct interpretation requires putting in place a long sequence of operational blocks that collectively constitute very thick workflows. The implementation of a particular block often involves choosing among multiple algorithmic choices (e.g., a clustering algorithm, an imputation method) and setting several parameter values. All such choices cannot be reduced to mere “implementation details” and are indeed fully part of the methodological development process, critical to determine the exact final output. Some blocks might embed numeric algorithms for which a formal representation might not be even available. In such nonparsimonious scenario, rich of parameters and design choices, it may be impossible to describe the whole methodology in a comprehensive and unambiguous manner only through a human-readable manual. Choosing one clustering algorithm rather than another, or setting a particular parameter value, might have a non-negligible influence on the final results for the very same set of input data. Sensitivity to model specifications and parameters is an issue for parsimonious models as well, but in that case it may be possible to identify upfront the few choices that are critical. On the other hand, for very thick methodologies consisting of long chains of operational blocks and functions (as unavoidably needed with new digital data that are re-purposed for statistics) the statistician cannot identify ex-ante which modules and which parameter values are critical. Therefore, different development teams may easily end up producing distinct machine-readable software implementations that are nominally implementing the same high-level description of the methodology, as represented in the human-readable manual, but with very important differences in the final results (and performances). In such case, the high-level description is too vague and ambiguous to ensure replicability, and a much more detailed description is needed to unambiguously describe the method. Such detailed level of description is basically the source code itself (along with its documentation).
Layered organization of data processing workflow: the hourglass model
Considering that new data sources are often generated as a by-product of other technology-intensive processes, the development of new methodological approaches requires contribution by experts from disciplines that are outside the traditional knowledge field of statistics (e.g., engineers and computer science experts). Generally speaking, in most cases the whole data processing flow, from the collected input data to the final output statistics, can be split into distinct segments, or layers, as sketched in Figure 4. In the lower layer, the collected data are transformed into intermediate data (and associated meta-data) with a clear structure, easy to be interpreted by statisticians. If the collected input data are unstructured (e.g, text or images) the lower processing layer shall include algorithms to transform them into structured dataFootnote 10 (e.g., text classification and object recognition modules). Other kinds of data originated by technological processes can be seen as semi-structured data, with formats and semantics that are complex and specific to the particular technology domain, for example, mobile network operator (MNO) data, smart meter data, ship or airplane tracking data, and so forth. In most cases, only a small part of the information embedded in the collected data is relevant for official statistics, and the first layer of data processing is devoted to extract the relevant component. This stage is logically homologous to the interpretation stage for unstructured data: it involves selection functions (for variables, events, etc.) but also some form of low-level transformations (e.g., geo-mapping of events in MNO data Ricciato et al., Reference Ricciato, Lanzieri and Wirthmann2019a). The definition of such first layer of processing requires close involvement of specialists and technology experts from the specific source domain (e.g., telecom engineers for MNO data). Similar to the case of unstructured data, sources of errors and uncertainty must be understood by statisticians, represented and properly modelled in meta-data and data models.
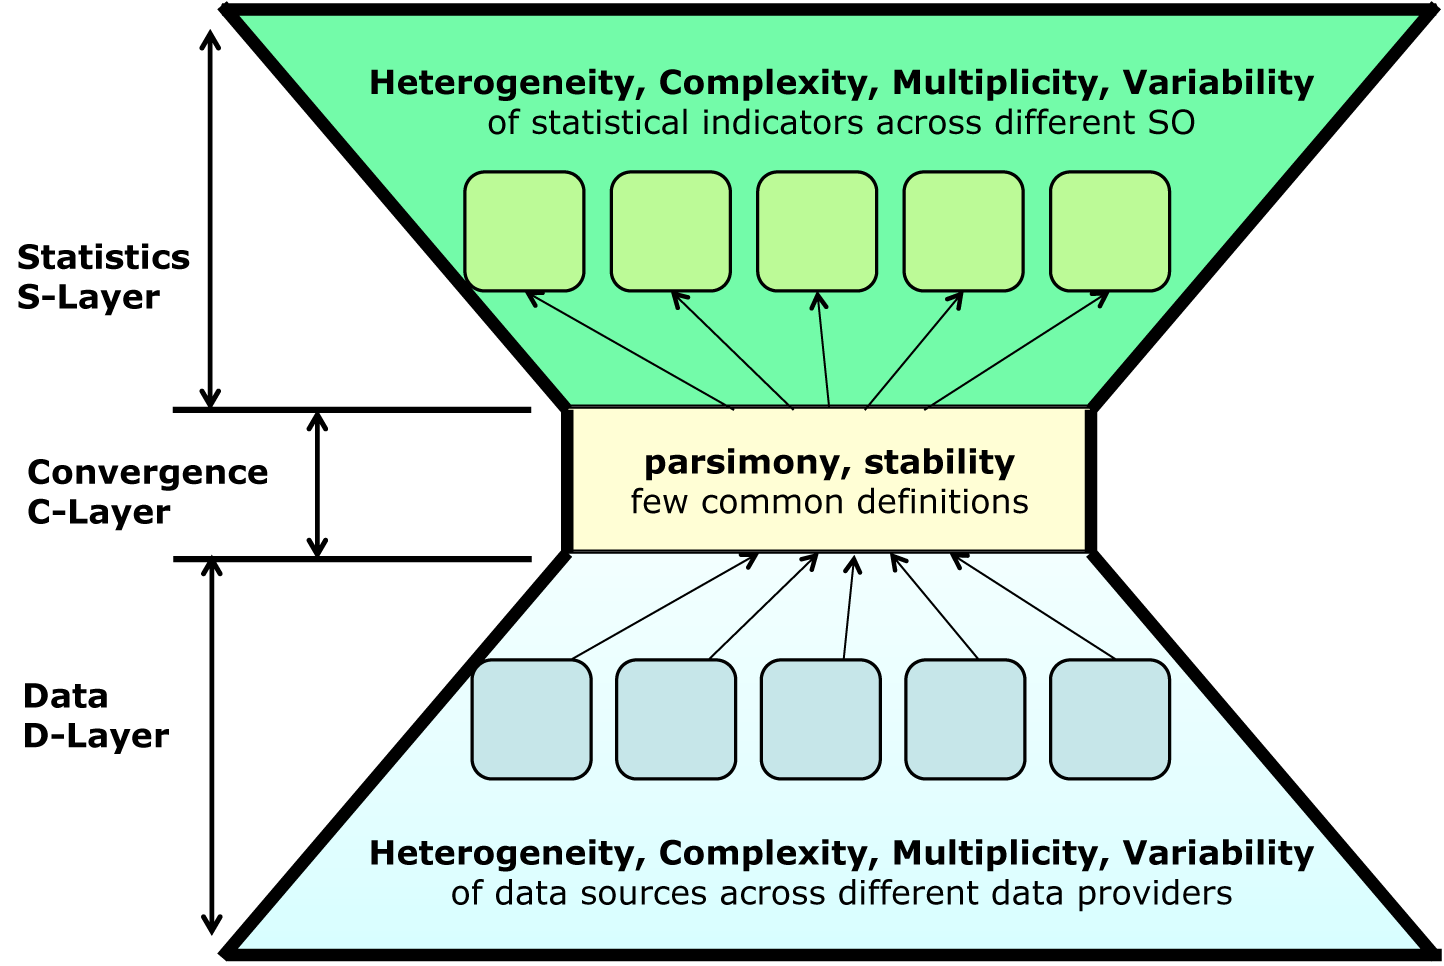
Figure 4. The layered hourglass model at the foundation of the Reference Methodological Framework being worked out by Eurostat in cooperation with ESS members.
In all examples above, a first lower layer of data processing is required to transform the collected data (possibly unstructured and/or rich of technology-specific information that is not relevant for official statistics) into intermediate data (and associated meta-data) that can be more easily interpreted and further processed by statisticians, possibly in combination with other data sources, following the multi-source paradigm discussed below. Close cooperation between statisticians and domain-specific technology specialists is required only at this first (lower) layer, in order to build functions with technology-specific logic for selecting and transforming the data components that are relevant for further statistical purposes.
In the uppermost layer, the methods developed by statisticians transform the intermediate data and meta-data produced by the lower layer into statistical information and indicators, as relevant to their respective application domains. The intermediate data block between the lower and upper processing segments (exemplified for each data source by a colored bar in Figure 5) has a critical role. Ideally, the semantics, format, and structure of such intermediate data should meet the following requirements:
1. It should follow a common structure and format for a given class of data sources, independently from technological details that may vary across different instances within the same class.Footnote 11
2. It should be designed in order to accommodate for the future changes in the technological details, due to the physiological evolution of the technologies underlying the generation of such data.Footnote 12
3. It should encode all (and only) the data component that are relevant for different statistical purposes in a way that is agnostic to the particular application domain and/or statistical use case.
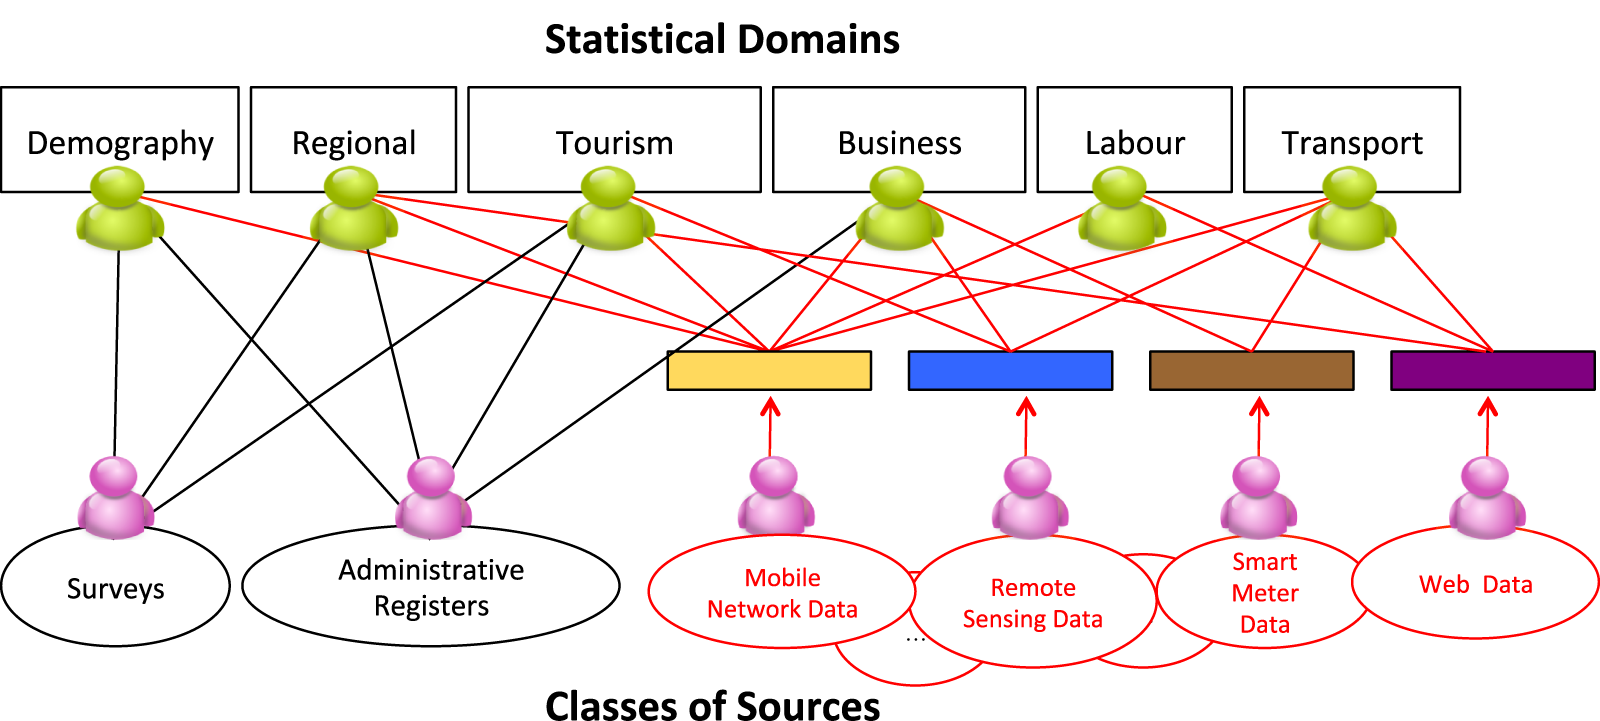
Figure 5. Each class of data serves multiple statistical domains (multi-purpose sources) and each statistical domain can benefit from different sources of data (multi-source statistics).
In other words, the first two items above require the intermediate data structure to be input agnostic, that is, independent from the detailed characteristics of the input data that may vary across particular instances (e.g., mobile operators, specific types of satellite images) and/or in time, while the third item requires it to be output agnostic, that is, independent from the particular application domain and use case. If the intermediate data block fulfils the above requirements, changes in time (due to technological evolution) and differences in space (across countries and/or across instances of data sources within the same class) of the primary input data at the bottom can be resolved by adapting the processing functions at the lower processing layer only, with no need to modify the processing functions at the upper layer. Conversely, the modification or extension of particular use cases will be resolved by changes in the upper layer, with no need to modify the lower layer. In other words, the presence of an intermediate structure for data and meta-data that is both input-agnostic and output-agnostic allows decoupling the complexity, heterogeneity and temporal variability on the two sides, input and output, easing the development and enabling independent evolution of the processing functions at both layers.
The resulting layered structure resembles the hourglass model sketched in Figure 4. Notably, the principles of modularity, functional layering and the hourglass that we have sketched insofar are among the fundamental success factors of the Internet architecture (Akhshabi and Dovrolis, Reference Akhshabi and Dovrolis2011; Chiang et al., Reference Chiang, Low, Calderbank and Doyle2007). Such similarity is not coincidental considering the similarities between the (actual) Internet and the (envisioned) TSS system when they are seen as large socio-technological systems, with a mixture of common design and distributed operation. In both cases, they are large infrastructure (of hardware, software and humanware components) that ultimately move and transform data, involving various types of players with different roles across multiple administrative domains, developed through a combination of centralization and distribution, adherence to common design standard and adoption of local configuration and operation variants, flexible in enabling independent growth of the lower and upper components.
Modular methodological frameworks
New data sources are often generated by socio-technological processes that are not static, but instead subject to change following the natural evolution of technologies and/or usage habits. This introduces temporal changes in the source data, that is nonstationarity. Moreover, for some classes of data sources, certain detailed aspects of the technology are not completely standardized and may vary across countries. This introduces changes to the detailed formats and structures of data generated by different sources and/or across different countries (e.g., different mobile operators). Heterogeneity and nonstationarity of input data details pose additional challenges for the development of processing methodologies in terms of evolvability (to cope effectively with changes in time) and portability/interoperability (to address differences across countries and individual sources). The key to address such challenges is to develop highly modular methodological frameworks, within the layered approach outline above, where each module can be evolved or replaced without requiring changes to the rest of the processing workflow. The layering approach outlined above represents itself a form of modularity, but the pursue of modularity should inform also the development of statistical methodologies within each layer and at more operational levels.
One advantage of the modular approach is that the execution of each processing module can be assigned to the physical or logical environment that best fit for such module. Therefore, the allocation of processing modules to different physical/logical execution environments can be decided taking into account the relevant scoping constraints at administrative, business and legal levels. For instance, some of the processing modules at the lower processing layer can be executed at the source premises, following the principle of pushing computation out discussed above.
Similarly to software development, modularity is a key to achieve evolvability and enable cooperative development of complex statistical methodologies—the other key driver being opennes (Grazzini and Lamarche, Reference Grazzini and Lamarche2017). Following a modular approach in the methodological design leads naturally to identify two levels of design that we may call architecture and instantiation. Designing a methodological architecture involves deciding which sub-functions are needed and what they should achieve, which intermediate data is given in input and what is expected in output. The subsequent phase of methodological instantiation involves deciding how to perform each function. In other words, the methodological architecture aims at designing the overall modular organization, identifying which modules are needed and how they connect to each other, while the following instantiation phase populates each module with a particular algorithm and set of parameter values. To illustrate, a methodological architecture may foresee a generic “clustering” or “imputation” module along the data flow, without specifying any particular clustering algorithm or imputation method. The detailed definition of the latter is then conducted in the logically separate phase of methodological instantiation.
Such view of methodological development as a two-level process, based on a strong modularity, has multiple advantages. First, it facilitates the evolution and collective advancement of the methodology by multiple entities (e.g., SOs and research organizations). Second, it paves the way toward a more systematic exploration of methodological sensitivity issues. For example, we may ask how sensitive are the final results (statistics) to a change in the clustering method of choice, or to the imputation method, or to a small change in the parameters thereof. Sensitivity analysis should become standard practice when analyzing complex data through long analytic workflows, and a modular design approach allows to explore in parallel multiple methodological versions, that is, multiple instances of the same methodological architecture. A more clear identification of which parts of the final analysis results are robust to seemingly marginal design choices would reinforce trust in such result.
This two-level view of methodological design has also some epistemological implications related to the value and impact of research results in the field of “Big Data”. In fact, researchers dealing with the analysis of complex data tend to present their methodology as a compact object that can be either adopted in whole or not adopted at all. The same “all or nothing” view represents a limitation also for the (more than legitimate) quests for reproducibility and verification: it is often the whole methodology, seen as a compact unit, that is to be reproduced and (in)validated. But as openness and modularity are distinct properties, so are reproducibility and evolvability. Both openness/reproducibility and modularity/evolvability are dramatically needed in so-called “Big Data” research, but while the quest for the former is now clear (Stodden, Reference Stodden2014), less attention is being devoted to the latter.
Generally speaking, in most cases the methodology presented in one paper may be more conveniently seen as a particular instance of a more general class of methodologies following the same architecture, with a particular solution adopted (implicitly or explicitly) for each functional block. With this view, other researchers and practitioners may explore other methodological variants (instances) within the same methodological architecture, and possibly propose improvements to specific blocks thereof. This approach mirrors what is commonly adopted in collaborative open-source development, where different modules within a larger architecture are elaborated and advanced separately by different contributors. Through this path, the community of SOs and researchers may regain the sense of methodological development as a collective collaborative process, where different contributors take care of refining the multiple parts of a single overall methodological architecture, rather than a marketplace of independent algorithms developed concurrently.
Multi-purpose sources and multi-source statistics
The paradigm change outlined insofar fosters a shift of focus for statisticians and SOs, from the input toward the output side of the computation process. With more and more (new, big) data available out there, the bulk of SO resources expands from the collection of fresh primary data, based on traditional collection methods, toward the extraction of statistics from nontraditional data that were previously collected by other entities, produced for some other purpose and then re-purposed for official statistics. These two tasks should be seen as complementary, not concurrent to each each, for instance because statistics based on nontraditional data often benefit from some form of fusion with data collected through more traditional means, for example, in the case of statistics based on MNO data that are calibrated or adjusted based on census data and/or ad-hoc surveys. A thorough understanding of the data generation process is a necessary (though not sufficient) precondition for correctly interpreting the data. For data that were primarily produced by other actors, statisticians need to team up with specialists from those other domains to acquire the necessary knowledge about the data generation process.
By their nature, new data sources can provide multi-faceted information serving multiple statistical domains. Thus, rather than pursuing domain-specific approaches to data collection, processing, and analysis, we envision statistical systems where new data sources represent the basis for multi-purpose extraction of different statistical indicators, as sketched in Figure 5. One benefit of this approach is that the investment required to deal with each data source (e.g., for developing new methods and processes, for building new skills and capabilities) can be repaid across multiple application domains. The dual implication of this view, represented by the bipartite graph of Figure 5, is that novel statistics and indicators can be developed integrating multiple data sources, including combinations of traditional and nontraditional data sources. For instance, surveys can be used to calibrate indicators computed from new data sources, for example, against selectivity bias and/or under-coverage errors, similarly to what is done today in those countries where census is based on administrative data integrated by specifically designed sample surveys (see, e.g., ISTAT, 2014).
The fusion of different classes of data sources (multi-source) to serve different statistical domains (multi-purpose) entails an unavoidable mixing of different competencies in the teams of human experts that are called to develop the data processing methods (multi-disciplinarity). As new digital data are often produced by the interaction of humans with technological systems—be it a physical object, a network infrastructure, a computer application, or a combination of all that—the correct interpretation of the data must be based on sound understanding of both behavioral aspects (how humans function) and technological aspects (how technology behaves). In other words, the correct interpretation of new digital data requires a sound understanding of data generation systems and processes that are at the same time social and technical, or socio-technical, and therefore requires expertise from both domains.
Trusted Smart Surveys
The term “Smart Survey” has been used to refer to a survey model based on smart personal devices, typically the smartphone. A smart survey involves (continuous, low-intensity) interaction with the respondent and with his/her personal device(s) (Ruppert et al., Reference Ruppert, Gromme and Cakici2018). It combines (inter)active data provided explicitly by the respondent (e.g., responses to queries or images captured upon request by the application) together with passive data collected in the background by the device sensors (e.g., accelerometer, GPS) on the same device or by other devices within his/her personal sphere. The term “Trusted Smart Survey” refers to an augmentation of the smart survey concept by technological solutions aimed at increasing the degree of trustworthiness, hence promote public acceptance and participation. Constituent elements of a trusted smart survey are the strong protection of personal data based on PET and full transparency and auditability of processing algorithms. PET can be leveraged to use the collective data of many respondents for specific queries without sharing the individual data. Together with other technological solutions, strong safeguards will guarantee also on the technical level (in addition to the legal one) that individual data are used exclusively to compute statistics serving the collective good, with computation methods that adhere to privacy and ethical standards that have been defined and checked by qualified entities, ruling out legally and also technically the possibility of alternative uses, for other purposes and/or with other methods. Furthermore, active and truthful participation should be promoted by means of a coherent strategy for public communication and engagement, based on the principle that TSS is one way for the collectivity to regain control of the information embedded in the data that are ultimately produced by the collectivity itself.
The envisioned concept of Trusted Smart Survey blends together technological solutions and nontechnical aspects into a coherent vision. Its design entails inter-disciplinary development and requires cooperation with and contributions by experts from multiple knowledge fields, beyond the traditional competence perimeter of statisticians—from cryptology to psychology, from behavioral sciences to human–computer interaction design, from sociology to engineering. It will represent a novel way for SOs to interact with citizen, and a pivot tool towards participatory statistics—or Citizen Statistics.
Conclusions and Outlook
The high-level mission of official statistics in democratic societies is to provide a parsimonious quantitative view of the society to the society itself, thereby including decision makers and the public at large. Official statistics are produced according to established principles, rules, and standards that collectively aim at achieving independence, professionalism, transparency, and quality along the whole process. The official statistics are made available to everybody and at the same time. As data is power, official statistics represent the democratization of data.
The advent of digital technology has changed the meaning of “data” and the relation between data and society. As the power of the new data is now stronger than ever, the need for data democratization is even more compelling now than it was in the past. This adds importance to the high-level mission of official statistics and SOs. However, down to a more operational level, the changing characteristics of the new data calls for a profound rethinking of the official statistics production model. In order to fulfil the same mission and abide by the same principles that have qualified them for decades, statistical systems must augment their working models, operational processes, and practices with new components fit for the new digital data, digital technologies and digital behaviors that are now out there. The physiological process of incremental updates to existing components, that is already in place to ensure continuous adaptation of the statistical system to a slowly-changing environment, is not sufficient in this historical moment. A more fundamental system-level upgrade (i.e., an evolutionary leap) is needed in the functioning of statistical systems. In recognition of that, the ESS has adopted the term TSS to label the vision of official statistics in the new datafied society. This concept is now in the process of being defined and refined: it is not yet a mature, fully fledged complete solution ready for implementation, but it is already past the early stage of merely recognizing the challenges. In several aspects, the walking direction has been identified and the first steps are being taken.
In this paper we have tried to provide a comprehensive view of the directions taken by the current reflection inside the ESS. Our goal was not to drill down any specific aspect, but rather outline the overall “big picture,” taking a synthetic rather than analytic perspective. We hope this contribution will help raising awareness about the TSS vision, its pillars and motivations, and in this way attract contributions by scholars and specialists in the different relevant fields to progress it further.
Acknowledgments
We are grateful to the anonymous reviewers for their constructive comments on the earlier draft of this paper.
Disclaimer
The information and views set out in this paper are those of the authors and do not necessarily reflect the official opinion of the European Union. Neither the European Union institutions and bodies nor any person acting on their behalf may be held responsible for the use, which may be made of the information contained therein.
Funding Statement
This research was not supported by external funding.
Competing Interests
The authors declare no competing interests exist.
Authorship Contributions
Conceptualization, F.R., A.W., and M.H.; Writing-original draft, F.R.; Writing–review & editing, F.R.
Data Availability Statement
Data availability is not applicable to this article as no new data were created or analyzed in this study.


 Open access
Comments
No Comments have been published for this article.