


Engineered barriers and backfill for the geological disposal of radioactive waste require ultra-long-term stabilization. The use of compacted sodium-type bentonite–sand mixtures for this purpose has received increased attention. Previous work has studied the swelling characteristics, permeability and self-sealing capacity of bentonite and bentonite–sand mixtures (e.g. Komine & Ogata, Reference Komine and Ogata1994, Reference Komine and Ogata1999a; Mollins et al., Reference Mollins, Stewart and Cousens1996; Cho et al., Reference Cho, Lee and Chun1999; Sivapullaiah et al., Reference Sivapullaiah, Sridharan and Stalin2000; Shirazi, Reference Shirazi, Kazama, Salman, Othman and Akib2010; Suzuki et al., Reference Suzuki, Asano, Yahagi, Kobayashi, Sellin, Svemar and Holmqvist2013). Pusch (Reference Pusch1999) studied the swelling pressure and hydraulic conductivity of various clay materials such as kaolinite, smectite and palygorskite. Sellin & Leupin (Reference Sellin and Leupin2013) have reviewed most of the results from over the past 35 years on the safety-relevant properties of clays used as engineered barriers for the geological disposal of radioactive waste. However, few quantitative data on the effects of clay mineral types, contents and alterations on the swelling characteristics and permeability of bentonite–sand mixtures have been reported to date. Furthermore, many researchers (e.g. Nakayama et al., Reference Nakayama, Sakamoto, Yamaguchi, Akai, Tanaka, Sato and Iida2004; Yamaguchi et al., Reference Yamaguchi, Sakamoto, Akai, Takazawa, Iida, Tanaka and Nakayama2007; Cuisinier et al., Reference Cuisinier, Masrouri, Pelletier, Villieras and Mosser-Ruck2008; Chen et al., Reference Chen, Guo and Zhang2016) have studied the swelling characteristics and permeability of altered bentonite using alkaline solutions and various approaches. Yamaguchi et al. (Reference Yamaguchi, Sawaguchi, Tsukada, Kadowaki and Tanaka2013) reported an increase in the hydraulic conductivity of bentonite–sand mixtures after alteration by alkaline fluids. However, the swelling characteristics and permeability of bentonite–sand mixtures containing kaolinite and chlorite as alteration minerals have yet to be investigated. In the ultra-long-term use of bentonite–sand mixtures for geological disposal of radioactive waste, it is assumed that montmorillonite will be at least partly altered to illite or chlorite, and feldspar to kaolinite (e.g. Inoue et al., Reference Inoue, Kohyama, Kitagawa and Watanabe1987; Japan Nuclear Cycle Development Institute, 2000; Nakayama et al., Reference Nakayama, Sakamoto, Yamaguchi, Akai, Tanaka, Sato and Iida2004; Yokoyama et al., Reference Yokoyama, Nakamura, Tanaka and Hironaga2006; Savage et al., Reference Savage, Walker, Arthur, Rochelle, Oda and Takase2007; Yokoyama & Nakamura, Reference Yokoyama and Nakamura2010). These alterations may deteriorate the properties of bentonite–sand mixtures. Thus, the swelling characteristics and permeability of bentonite appear to be affected by alteration. The rate of alteration of bentonite–sand mixtures is slow. Several mathematical models have been developed to predict the ultra-long-term effects of alteration on the properties of bentonite–sand mixtures (e.g. Ishikawa et al., Reference Ishikawa, Shibata and Fujita1994; Savage et al., Reference Savage, Noy and Mihara2002; Ishii et al., Reference Ishii, Yahagi, Owada, Kobayashi, Takazawa, Yamaguchi, Takayama, Tsurumi and Iizuka2013). However, very few experimental data on the modification of hydraulic conductivity have been reported.
Hydrothermal alteration by volcanic–hydrothermal systems and weathering over geological time and historical periods have occurred widely throughout the Pacific Rim region. As a result of these processes, a wide variety of clay-rich sediments, bentonites and soils occur on the surface and in the crust of the Earth. The mineral composition of bentonite depends on the parent material and weathering environment. Bentonite is composed mainly of montmorillonite mixed with other clay minerals (e.g. illite, kaolinite, chlorite) and non-clay minerals (e.g. quartz, feldspars, carbonates, pyrite). Furthermore, the physical and mechanical properties of clay minerals vary, as shown by their structures.
Thus, clay-mineral type and content, crystal-chemical composition and assemblage and the expected alteration products of bentonite are important factors for the ultra-long-term stabilization of barriers and backfill in radioactive waste disposal. This study investigated the effects of clay-mineral types and contents on the swelling characteristics and permeability of bentonite–sand mixtures in laboratory experiments. Bentonite–sand–clay mineral mixtures might be affected by the alteration of bentonite via changes in the clay-mineral content. To clarify the effect of clay-mineral content, the bentonite–sand–clay mineral mixtures were subjected to one-dimensional swelling-pressure and constant-pressure permeability tests.
METHODS
Materials
One-dimensional swelling-pressure and constant-pressure permeability tests with samples containing one clay mineral were carried out to clarify the influence of clay mineralogy on swelling pressure and hydraulic conductivity. The clay minerals used were kaolinite, 10 Å halloysite, talc, mica and chlorite. The clay-mineral samples were collected primarily from ancient hydrothermal fields. The samples passed through a 75 µm mesh sieve. Next, the kaolinite, mica and chlorite were mixed with bentonite and sand to form bentonite–sand–clay mineral mixtures for one-dimensional swelling-pressure and constant-pressure permeability tests. The bentonite and silica sand used in this study were Kunigel-V1 collected in Tsukinuno Mine, Japan, and Mikawa no. 6 silica sand, respectively. Kunigel-V1 is composed of montmorillonite (46–49%), quartz (29–38%), feldspars (2.7–5.5%), calcite (2.1–2.6%), dolomite (2.0–2.8%), zeolites (3.0–3.5%) and pyrite (0.5–0.7%) (Ito et al., Reference Ito, Okamoto, Shibata, Sasaki, Danhara, Suzuki and Watanabe1993; Japan Nuclear Cycle Development Institute, 2000). Mikawa no. 6 silica sand is composed mainly of quartz. In order to avoid confusion with montmorillonite (clay mineral), we use the term ‘clay mineral sample’ for kaolinite, 10 Å halloysite, talc, mica and chlorite. In addition, the kaolinite, mica and chlorite used for the bentonite–sand–clay mineral mixtures are referred to as ‘non-swelling alteration products’ (NSAPs) (Fig. 1). Table 1 and Fig. 1 show the particle densities of the samples and proportions of bentonite, silica sand and clay mineral samples. The particle densities (ρS) of bentonite–sand mixtures were calculated from equation 1:
 $${\rm \rho} _{\rm s} = \displaystyle{m \over {\displaystyle{{m_{\rm B}} \over {{\rm \rho}_{\rm B}}} + \displaystyle{{m_{\rm N}} \over {{\rm \rho}_{\rm N}}} + \displaystyle{{m_{\rm S}} \over {{\rm \rho}_{\rm S}}}}}$$
where m is the mass, ρ is the particle density and the subscripts B, N and S represent bentonite, mixed NSAPs and silicate sand, respectively.
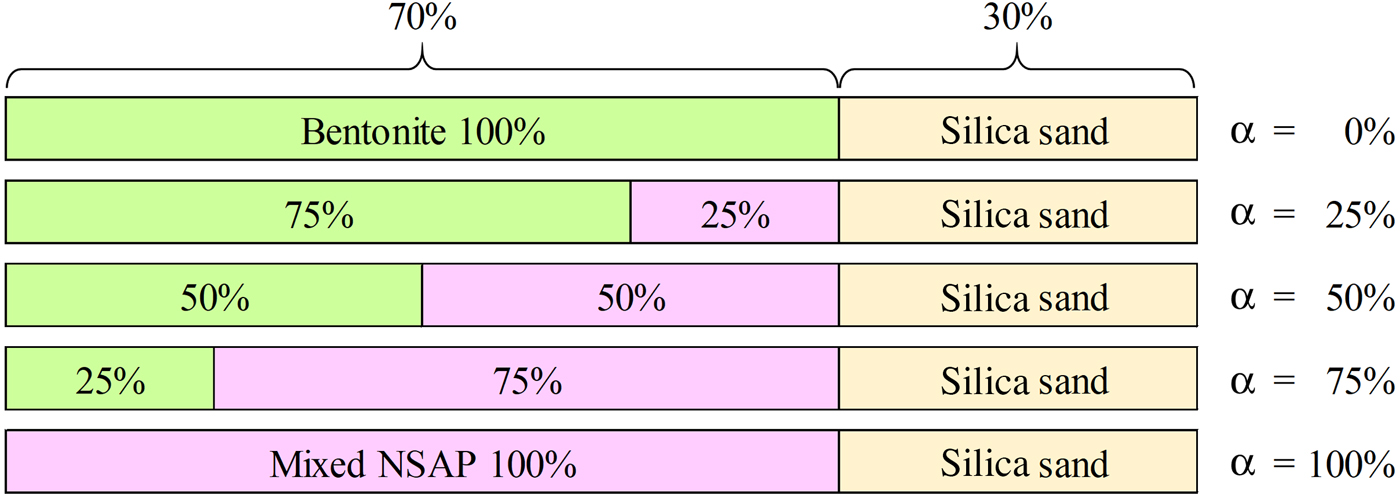
Fig. 1. Proportions of components in bentonite–sand–clay mineral mixtures. Mixed NSAPs were kaolinite, mica and chlorite.
The ratio of bentonite and mixed NSAPs to sand was 7:3 in dry mass. The materials were dried at 40 ± 3°C in an electric oven to achieve a constant mass and to avoid structural collapse caused by dehydration of 10 Å halloysite and montmorillonite. The mixed NSAP replacement ratio to bentonite (α), defined as the mass of the clay-mineral sample divided by the mass of the bentonite and clay mineral sample, ranged from 0% to 100% at 25% intervals (Fig. 1). Three materials (bentonite, mixed NSAPs and silica sand) were mixed in a container. Bentonite and the clay mineral sample were identified by X-ray diffraction (XRD) traces of untreated powder samples (Fig. 2). The XRD was performed with a Rigaku Ultima IV diffractometer (40 kV, 20 mA, 0.03 s/step) using Cu-Kα radiation, a 0.15 mm receiving slit, a 0.5° divergence slit and a 2° scattering slit. The kaolinite sample is composed mainly of kaolinite with traces of quartz (Fig. 2c). The talc sample consists mainly of talc and traces of chlorite (Fig. 2e). The chlorite sample is composed mainly of chlorite with minor quartz, feldspars calcite and sepiolite (Fig. 2g). The specific surface areas of the clay-mineral powder samples and silicate sand were determined by N2 adsorption with the Brunauer–Emmett–Teller (BET) method after degassing at 200°C for 1 h. The specific surface areas of the samples are listed in Table 2.
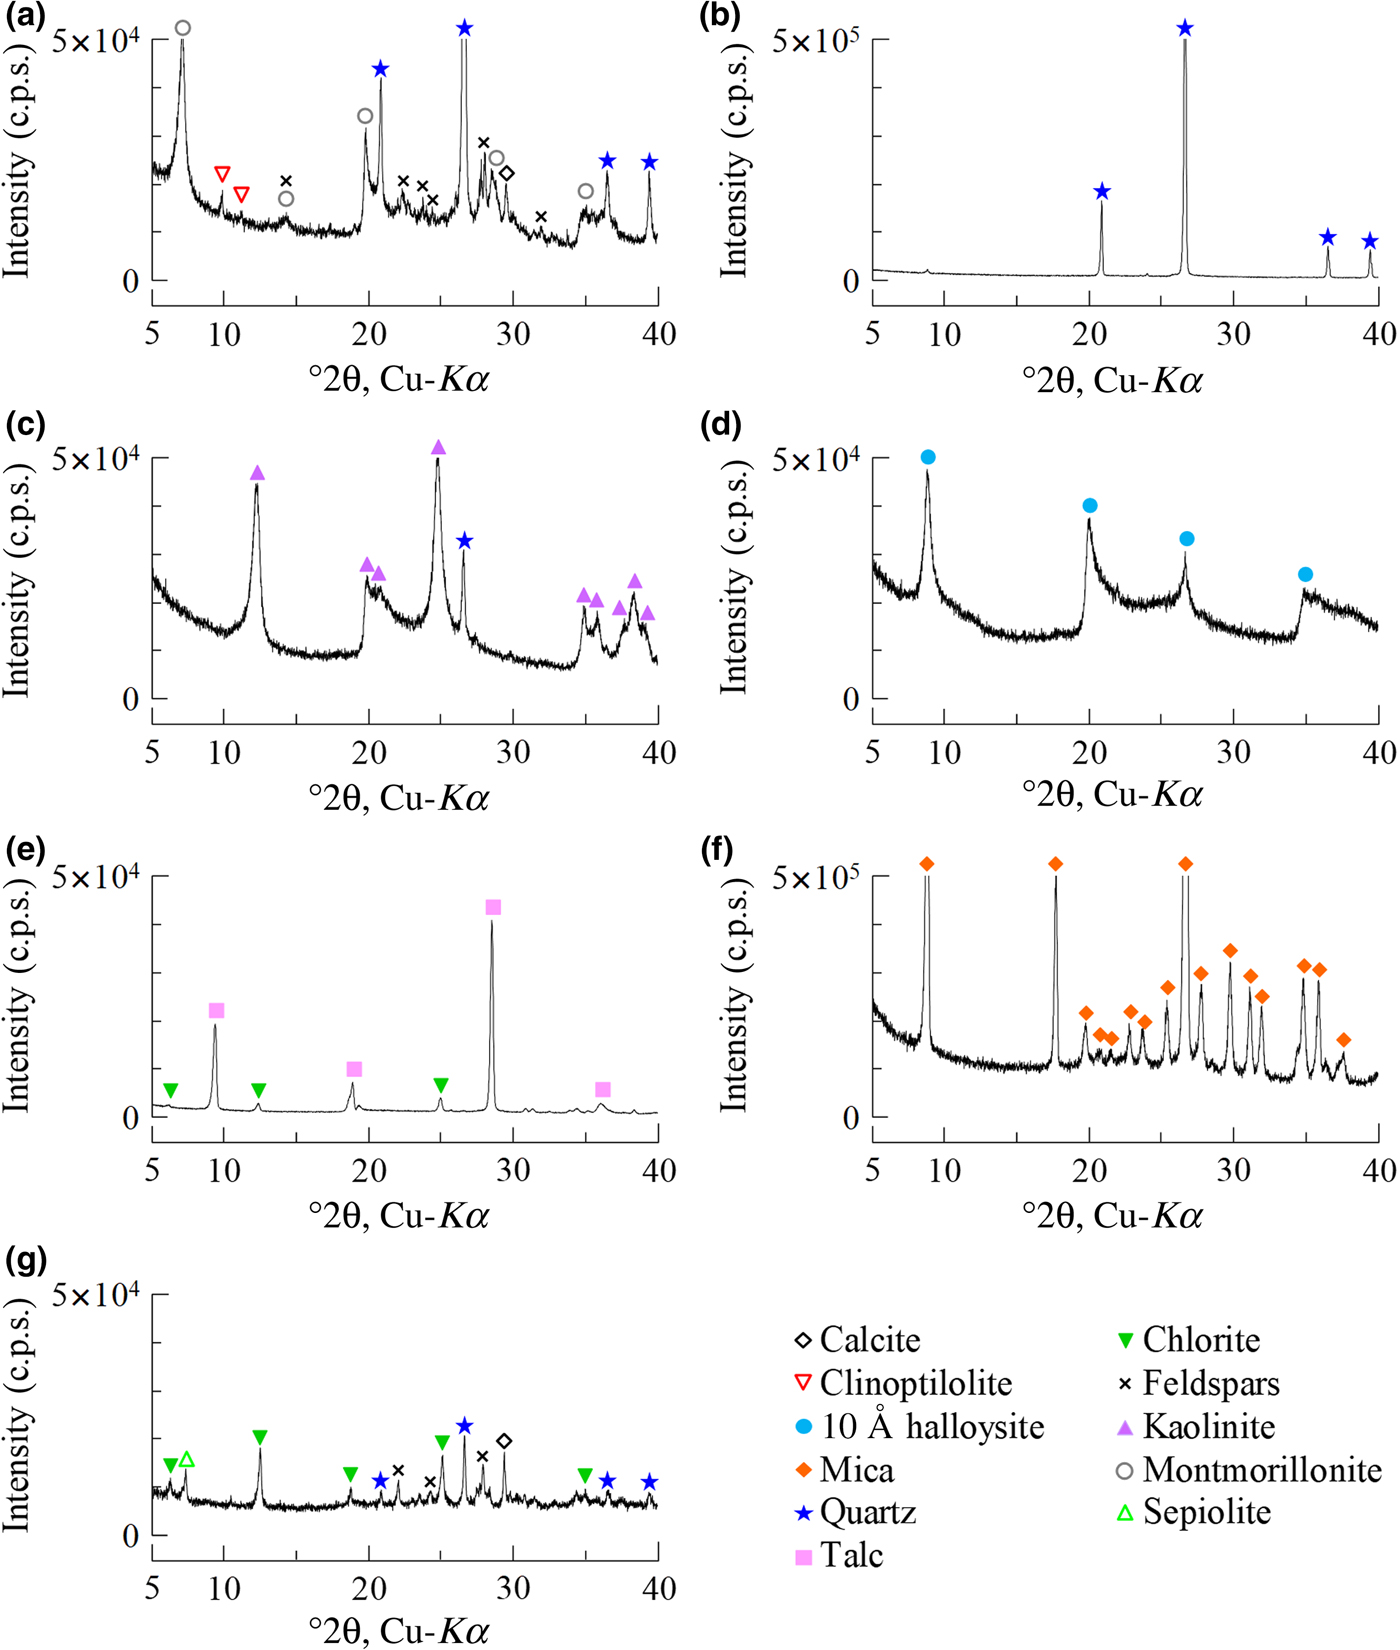
Fig. 2. Random XRD traces of (a) bentonite, (b) silica sand and clay-mineral powders: (c) kaolinite, (d) 10 Å halloysite, (e) talc, (f) mica and (g) chlorite. c.p.s. = counts per second.
Table 2. Specific surface areas of clay-mineral powder samples and silica sand, measured according to the BET method.
a The Clay Science Society of Japan (2009).
b Holland & Murtagh (Reference Holland and Murtagh2000).
Sample preparation and test procedure
The specimens used for one-dimensional swelling-pressure and constant-pressure permeability tests were 50 mm in diameter and 10 mm in height. The dried clay mineral and bentonite–sand mixtures were compacted statically to a dry unit mass of 1.4 mg/m3. The compacted specimens were produced using an apparatus composed of a cylindrical mould, pistons and an oil-pressure jack. The tests were performed at 22 ± 1°C in a temperature-controlled room.
Figure 3 shows the experimental configuration of the one-dimensional swelling-pressure test. The testing system consisted of an elevating-load machine, cylindrical mould (acrylic resin ring), base plate, loading plate, load cell, porous stone, water-immersing container and displacement transducer. The test was performed at constant volume. A specimen was placed in the cylindrical mould with a base plate, the assembly was inserted into the water-immersing container and the container was filled with distilled water. A 0.003 kN load was then applied to ensure that the height of the specimen did not change, and the axial swelling pressure was determined from the vertical force applied at that time. A displacement transducer was used to measure the displacement of the specimen throughout the test. The maximum value of displacement was 0.01 mm. The swelling pressure is given by equation 2:
 $$P_{\rm s} = \displaystyle{F \over A}$$
where P s is the swelling pressure, F is the vertical force and A is the cross-sectional area of the specimen. A data logger was used to measure vertical force at 1 s intervals. The test was conducted for at least 72 h, after which measurements were taken until the swelling pressure had been constant for 24 h.
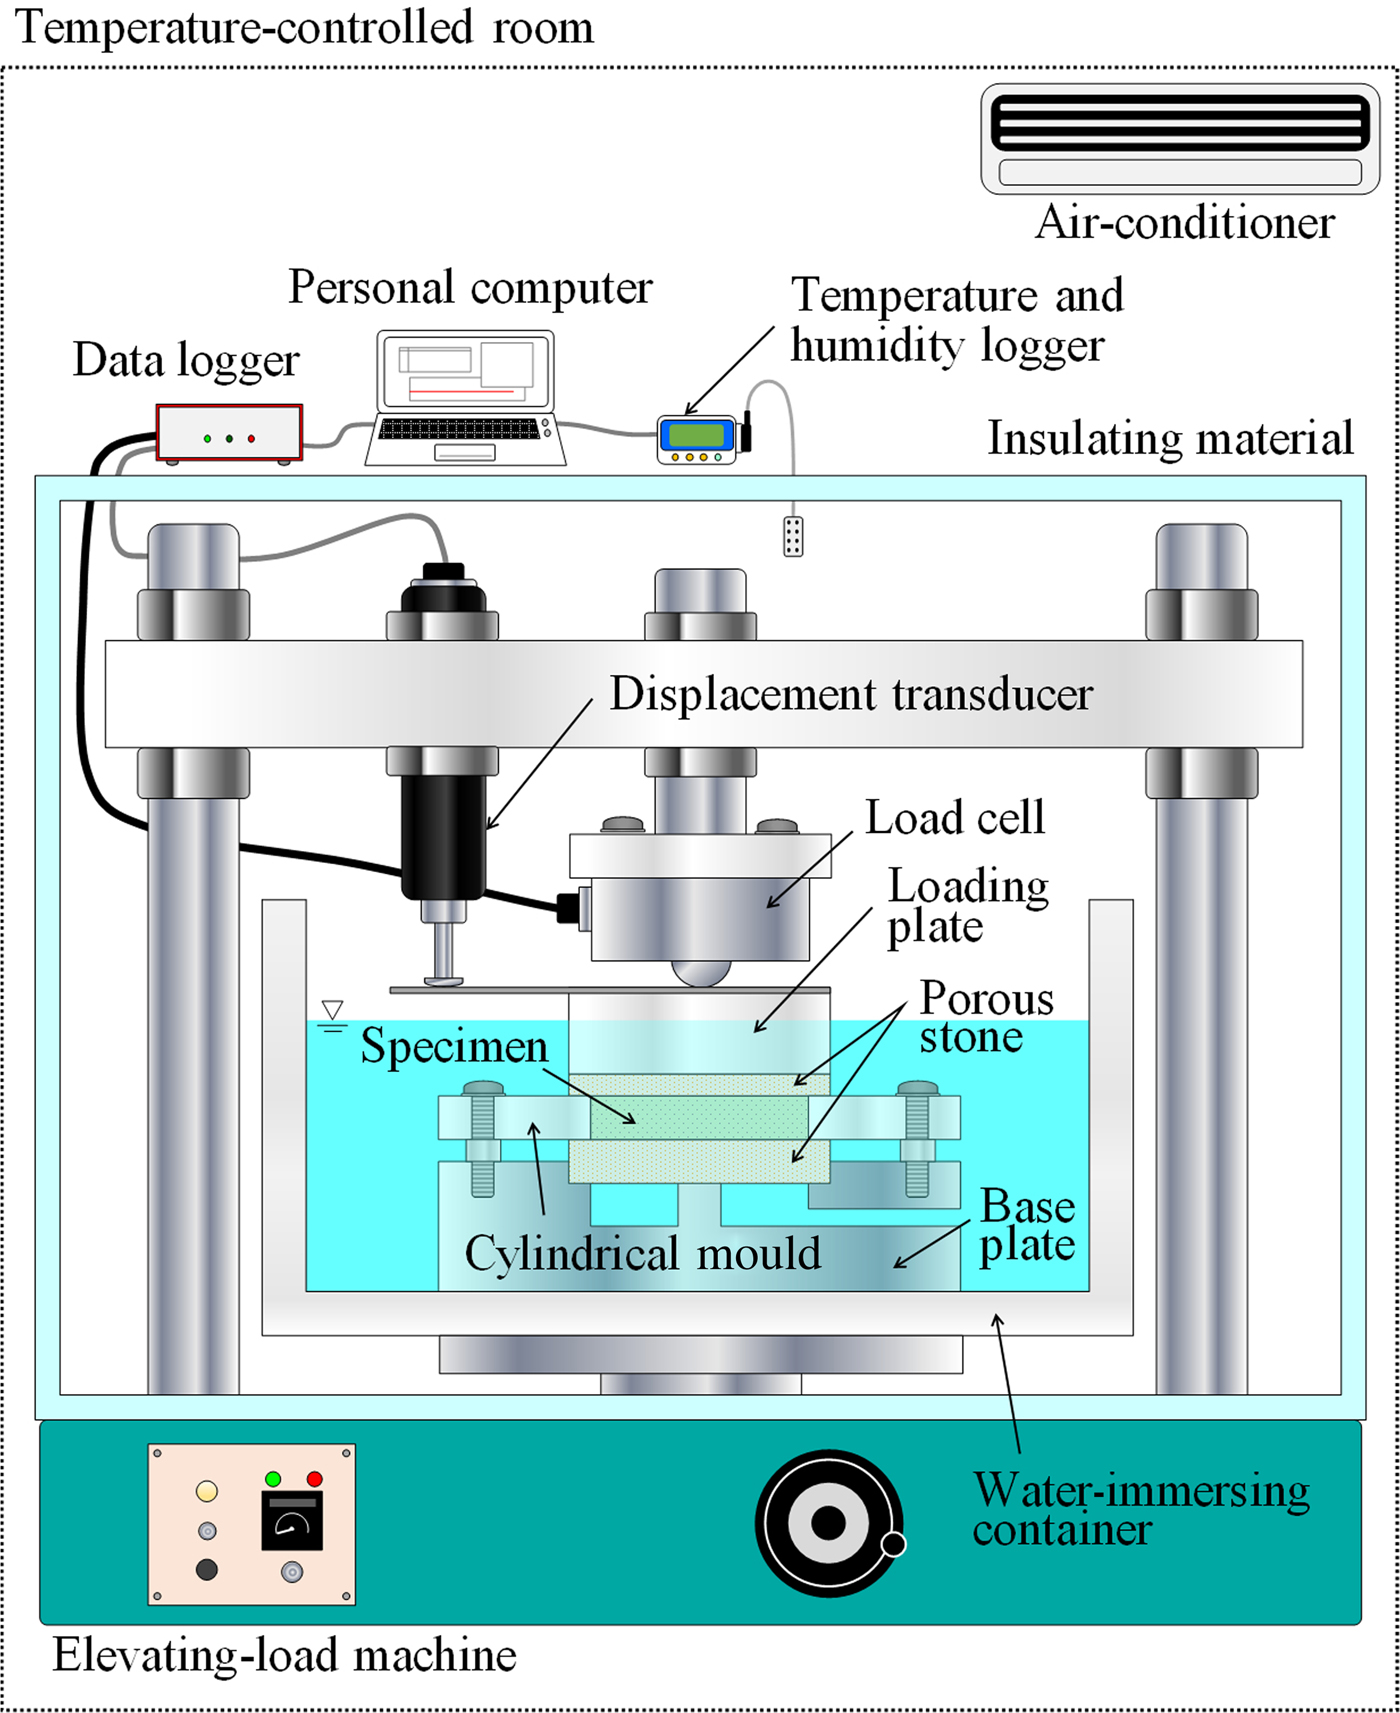
Fig. 3. Schematic diagram of the experimental configuration for the one-dimensional swelling-pressure test.
Figure 4 shows the experimental configuration of the constant-pressure permeability test. The testing system consisted of a compressor, pressure water tank, pressure regulator, pressure gauge, water pipe, permeability cylindrical mould (stainless steel), filters (paper and porous stone), O rubber ring and electronic balance. The pipe and cylinder were made of stainless steel. The electronic balance (0.1 mg accuracy) was used to measure the amount of water discharge, with consideration of evaporation. The runoff volume was measured at 1 min intervals, and the data were transmitted from the balance to a personal computer. Each specimen was saturated using a water-filled decompression container. The swelling pressure of the clay mineral samples attained equilibrium at ~2 days (Fig. 5). Therefore, the water-immersion times were determined to be 4 days for the clay-mineral samples and 7 days for bentonite. The water-immersion time for bentonite corresponds to at least the duration of the one-dimensional swelling-pressure tests. The minimum degree of saturation of specimens was 98.9%. Therefore, the specimens used were considered to be water-saturated. Distilled water was passed through the specimen at constant water pressure using a compressor and pressure water tank. Measurements were taken for ≥24 h after the first confirmation of water runoff. The water pressure was kept lower in the constant-pressure permeability test than in the swelling-pressure test to avoid consolidation or water path (Table 3). As an exception, the water pressure of the chlorite sample and chlorite–sand mixtures (α = 100%, P s <0.002 MPa) was 0.002 MPa. Consolidation or water path of these specimens was not observed after the test. The hydraulic conductivity of clay mineral samples and bentonite–sand mineral mixtures was calculated from Darcy's law (equation 3):
 $$k = \displaystyle{{QL} \over {hAt}}$$
where k is the hydraulic conductivity, Q is the runoff volume, L is the height of the specimen, h is the difference in water level, A is the cross-sectional area of the specimen and t is time. h was calculated according to the pressure in the pressure water tank (e.g. at water pressure 0.1 MPa, h is 1020.4 cm). The water pressure was controlled using the pressure regulator and the pressure gauge. The accuracy was to 0.002 MPa. The hydraulic conductivity of bentonite–sand mixtures depends slightly on the hydraulic gradient i (= h/L) (Nakamura et al., Reference Nakamura, Tanaka and Hironaga2011). In this study, the hydraulic gradient (i = 20.4–3571.4) did not affect hydraulic conductivity.
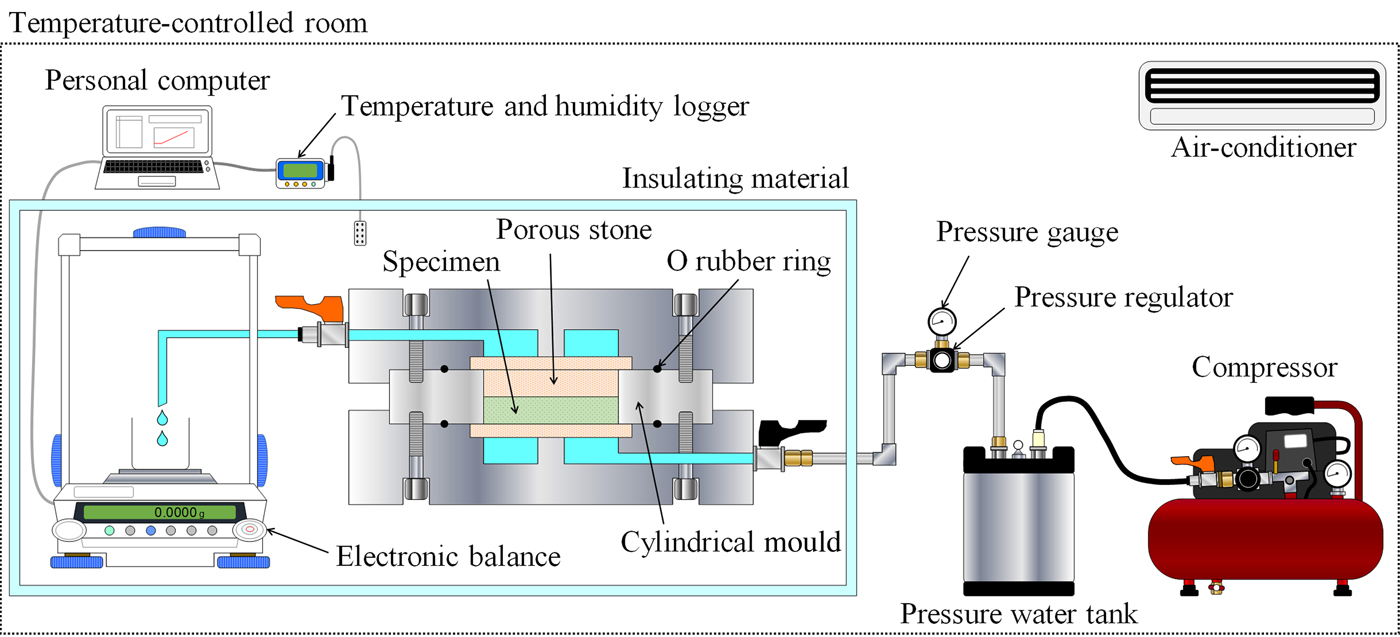
Fig. 4. Schematic diagram of the experimental configuration for the constant-pressure permeability test.
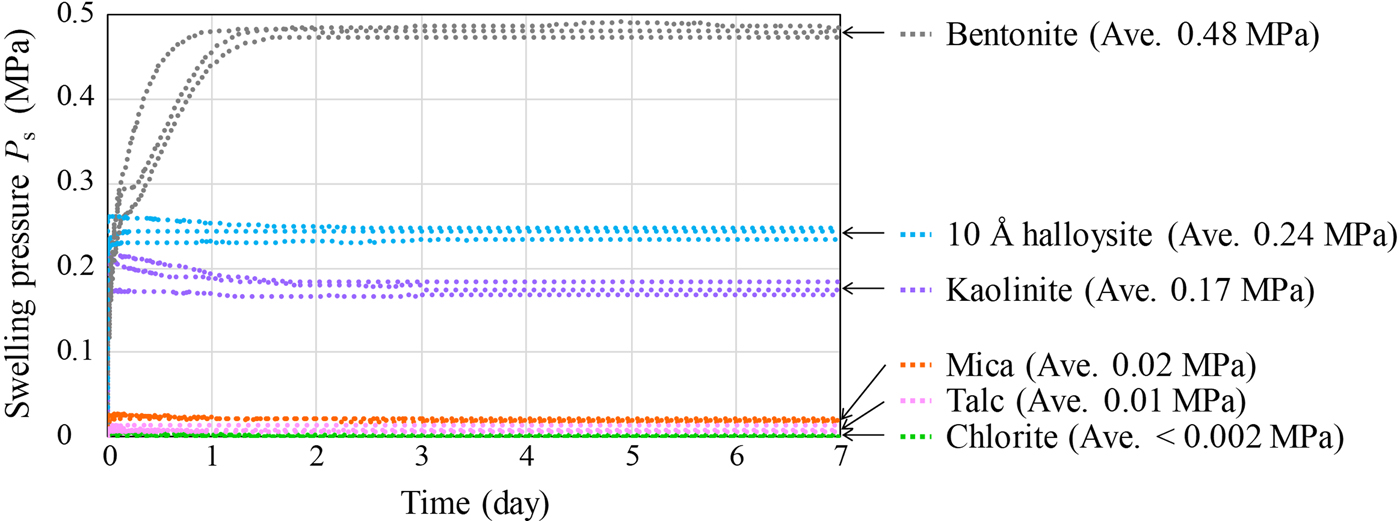
Fig. 5. One-dimensional swelling pressure of clay-mineral samples and bentonite (Kunigel V1).
Table 3. Swelling pressure (P s) of specimens and water pressure (P w) for the constant-pressure permeability test.
RESULTS AND DISCUSSION
Swelling-pressure and hydraulic conductivity measurements were performed with mixed NSAPs and bentonite (Figs 5, 6) and admixtures thereof (Fig. 7). The reproducibility of the one-dimensional swelling-pressure and constant-pressure permeability tests was assessed in triplicate experiments. Sample data in Fig. 5 represent the average of at least three measurements under the same conditions. Figure 6 shows the error bars (range of maximum and minimum values) of the sample data. The standard deviation of the swelling pressure was 0.008 MPa. The differences between the maximum and minimum values of the hydraulic conductivity of samples were less than one order of magnitude. Therefore, the variation in the swelling pressure and hydraulic conductivity of the samples was very small.
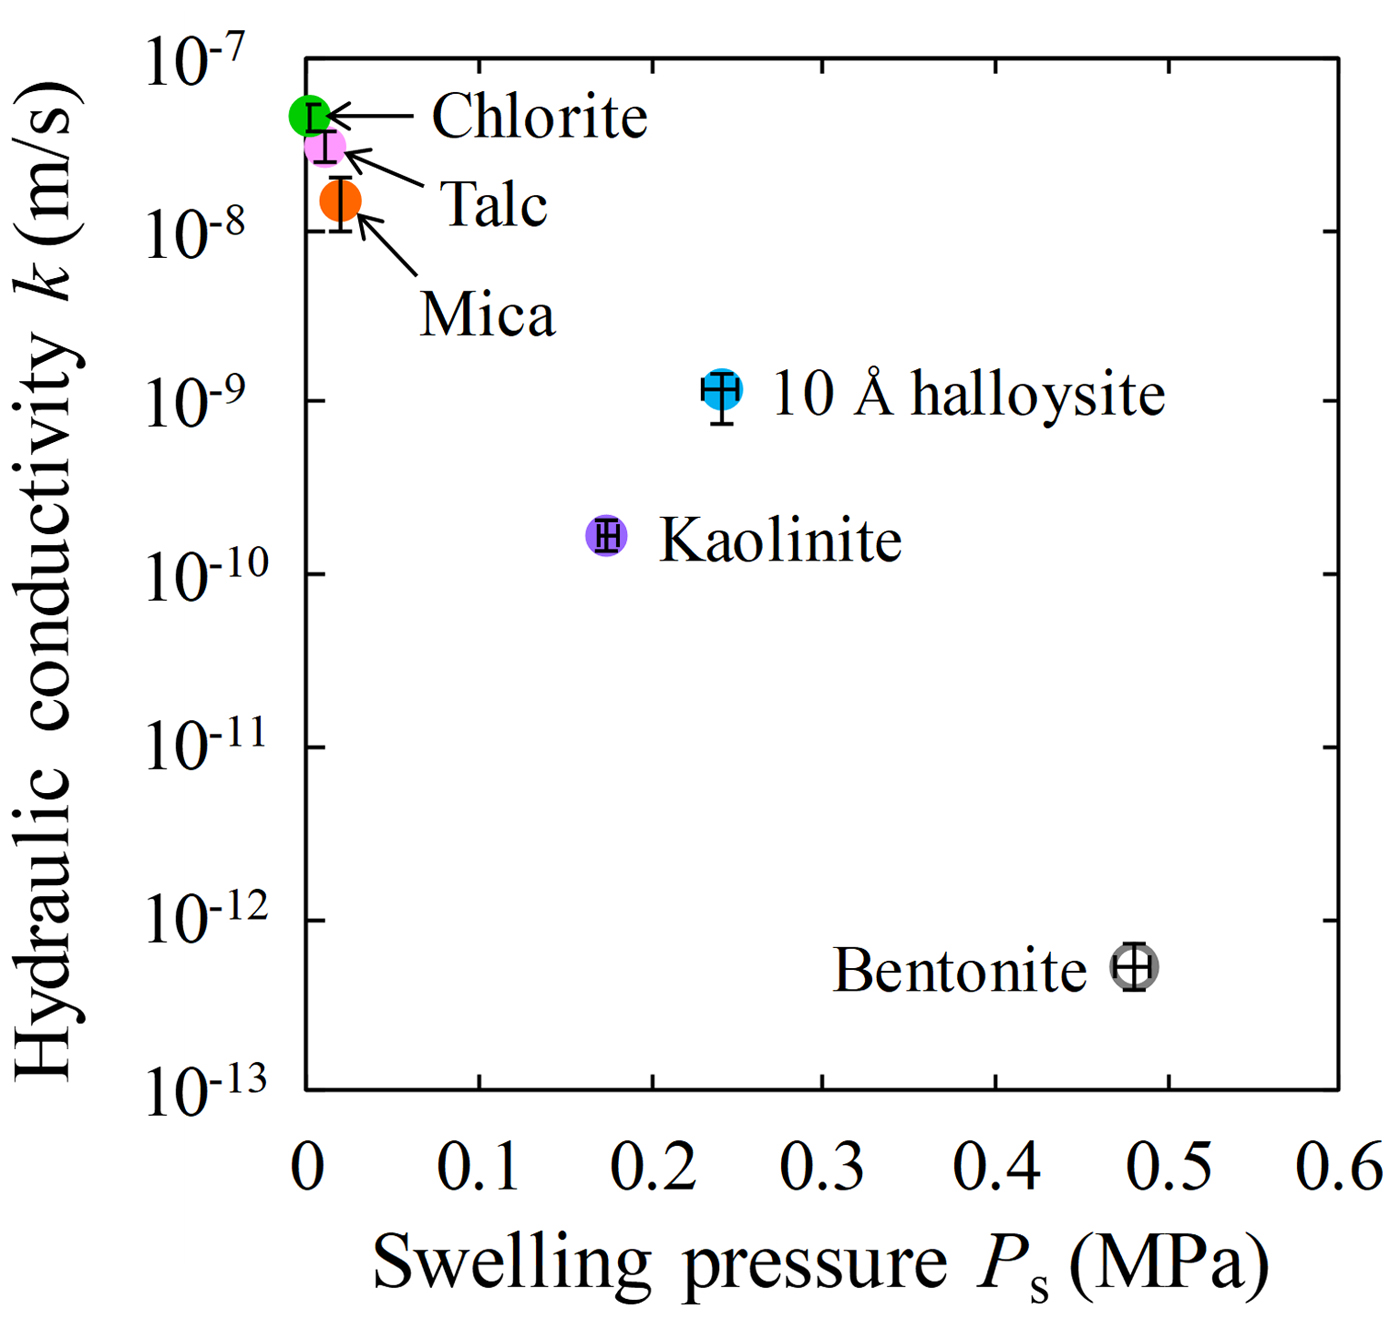
Fig. 6. Relationship between swelling pressure and hydraulic conductivity of clay-mineral samples and Kunigel V1.
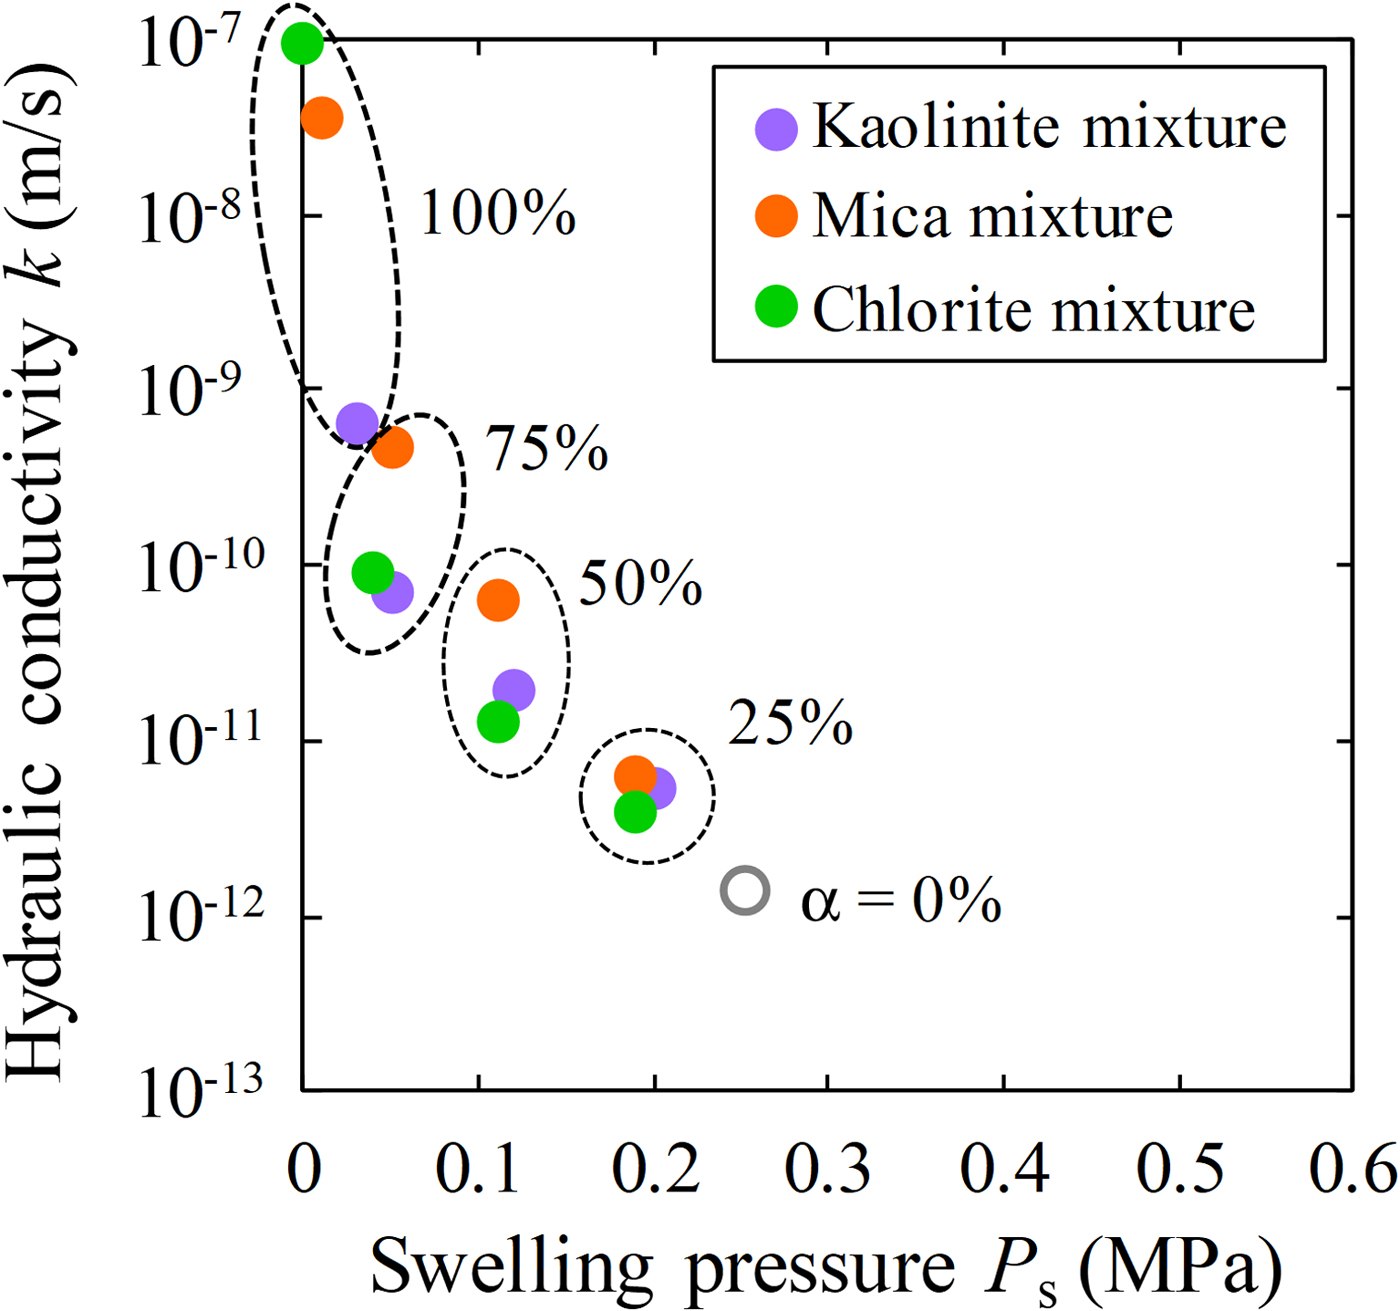
Fig. 7. Relationship between swelling pressure and hydraulic conductivity of bentonite–sand–clay mineral mixtures.
Swelling pressure and hydraulic conductivity of the clay-mineral samples and bentonite
The swelling pressures of five clay-mineral samples and bentonite are shown in Fig. 5. The average swelling pressure was highest for bentonite (P s = 0.48 MPa), followed by 10 Å halloysite (P s = 0.24 MPa) and kaolinite (P s = 0.17 MPa). In contrast, values for talc and mica were low (P s = 0.01 and 0.02 MPa, respectively), and that for chlorite was <0.002 MPa. The bentonite required a longer time than the clay mineral samples to reach equilibrium swelling pressure. However, because bentonite has low permeability, a longer time was required for the water to reach all parts of the specimen. The swelling pressures of the clay mineral samples differed according to the clay-mineral type. In particular, the swelling pressures of 10 Å halloysite and kaolinite were greater than those of the other clay-mineral samples. Because the specific surface areas of 10 Å halloysite and kaolinite were also larger than those of the other clay-mineral samples (Table 2), the adsorbed water owing to surface tension increased. Thus, the pore-water pressure and the swelling pressure of halloysite and kaolinite increased.
The relationships between swelling pressure and hydraulic conductivity for the five clay-mineral samples and bentonite are shown in Fig. 6 and Table 4. Hydraulic conductivity was lowest for bentonite (average of k = 5.3 × 10⁻¹³ m/s), followed by kaolinite and 10 Å halloysite (10–10 m/s) and mica, talc and chlorite (10–8 m/s). The hydraulic conductivity of bentonite in this study was comparable to that reported in previous studies under similar conditions (4.8 × 10⁻¹² m/s) (Suzuki et al., Reference Suzuki, Shibata, Yamagata, Hirose and Terakado1992). The hydraulic conductivity of the specimens decreased with increasing swelling pressure, and analysis revealed a strong correlation (R = 0.97; Fig. 6). The hydraulic conductivity of the clay-mineral samples varied according to the clay-mineral type. Interestingly, the swelling pressure (P s), hydraulic conductivity (k) and specific surface area (S) of the kaolinite and halloysite (both with 1:1 layer structures) were similar, and the P s, k and S of talc (2:1 layer), mica (2:1 layer) and chlorite (2:1:1 layer) were comparable. The large specific surface area resulted in an increase in pore-water viscosity, which in turn led to low hydraulic conductivity (Achari et al., Reference Achari, Joshi, Bentley and Chatterji1999). The relationship between the clay-mineral structures or the interlayer bonding force and hydraulic conductivity will be clarified in future studies. In particular, montmorillonite in bentonite has a 2:1 layer. Because it is a swelling clay mineral containing water and cations between layers, however, a significantly larger electric double layer is formed compared with those for mica or chlorite. It is suggested that the formation of an immobile water film in the electric double layer and physicochemical action (adsorption and flocculation) by the swelling clay mineral contributed significantly to the low hydraulic conductivity of bentonite (Achari et al., Reference Achari, Joshi, Bentley and Chatterji1999; Mitchell & Soga, Reference Mitchell and Soga2005). The hydraulic conductivities of kaolinite, mica and chlorite, which might have formed during the alteration of bentonite under repository conditions, and those of mica and chlorite were approximately three to five orders of magnitude greater than the hydraulic conductivity of bentonite. These experimental results suggest that an increase in non-swelling clay minerals due to alteration of bentonite increases hydraulic conductivity.
Table 4. Hydraulic conductivity (k) of samples.
Swelling pressure and hydraulic conductivity of bentonite–sand–clay mineral mixtures
The relationship between the swelling pressure and hydraulic conductivity of the bentonite–sand–clay mineral mixtures is shown in Fig. 7. The swelling pressure of the bentonite–sand–clay mineral mixtures ranged from 0.00 to 0.25 MPa. The swelling pressure decreased with increasing replacement of bentonite by NSAPs, without major differences among the various types of NSAPs. The hydraulic conductivity of the bentonite–sand mixtures decreased with increasing swelling pressure, and analysis revealed a strong correlation (R = 0.87).
The relationships between the mixed NSAP replacement ratio to bentonite and hydraulic conductivity of the bentonite–sand–clay mineral mixtures are shown in Fig. 8. The hydraulic conductivities of the kaolinite–sand, mica–sand and chlorite–sand mixtures (α = 100%; k = 6.3 × 10⁻¹⁰ m/s, 3.6 × 10⁻⁸ m/s and 9.4 × 10⁻⁸ m/s, respectively) were more than two to four orders of magnitude greater than that of the bentonite–sand mixture (α = 0%, k = 1.4 × 10⁻¹² m/s). The hydraulic conductivity of the bentonite–sand mixture (α = 0%) was similar to that observed previously under the same test conditions (1.0 × 10⁻¹² m/s) (Suzuki et al., Reference Suzuki, Shibata, Yamagata, Hirose and Terakado1992). Compared with the hydraulic conductivity of the bentonite–sand mixtures (α = 0%), that of the bentonite–sand–clay mineral mixtures did not differ in magnitude for α = 25%. However, a difference of one order of magnitude was noted for α = 50%, and a difference of one to two orders of magnitude was observed for α = 75%.
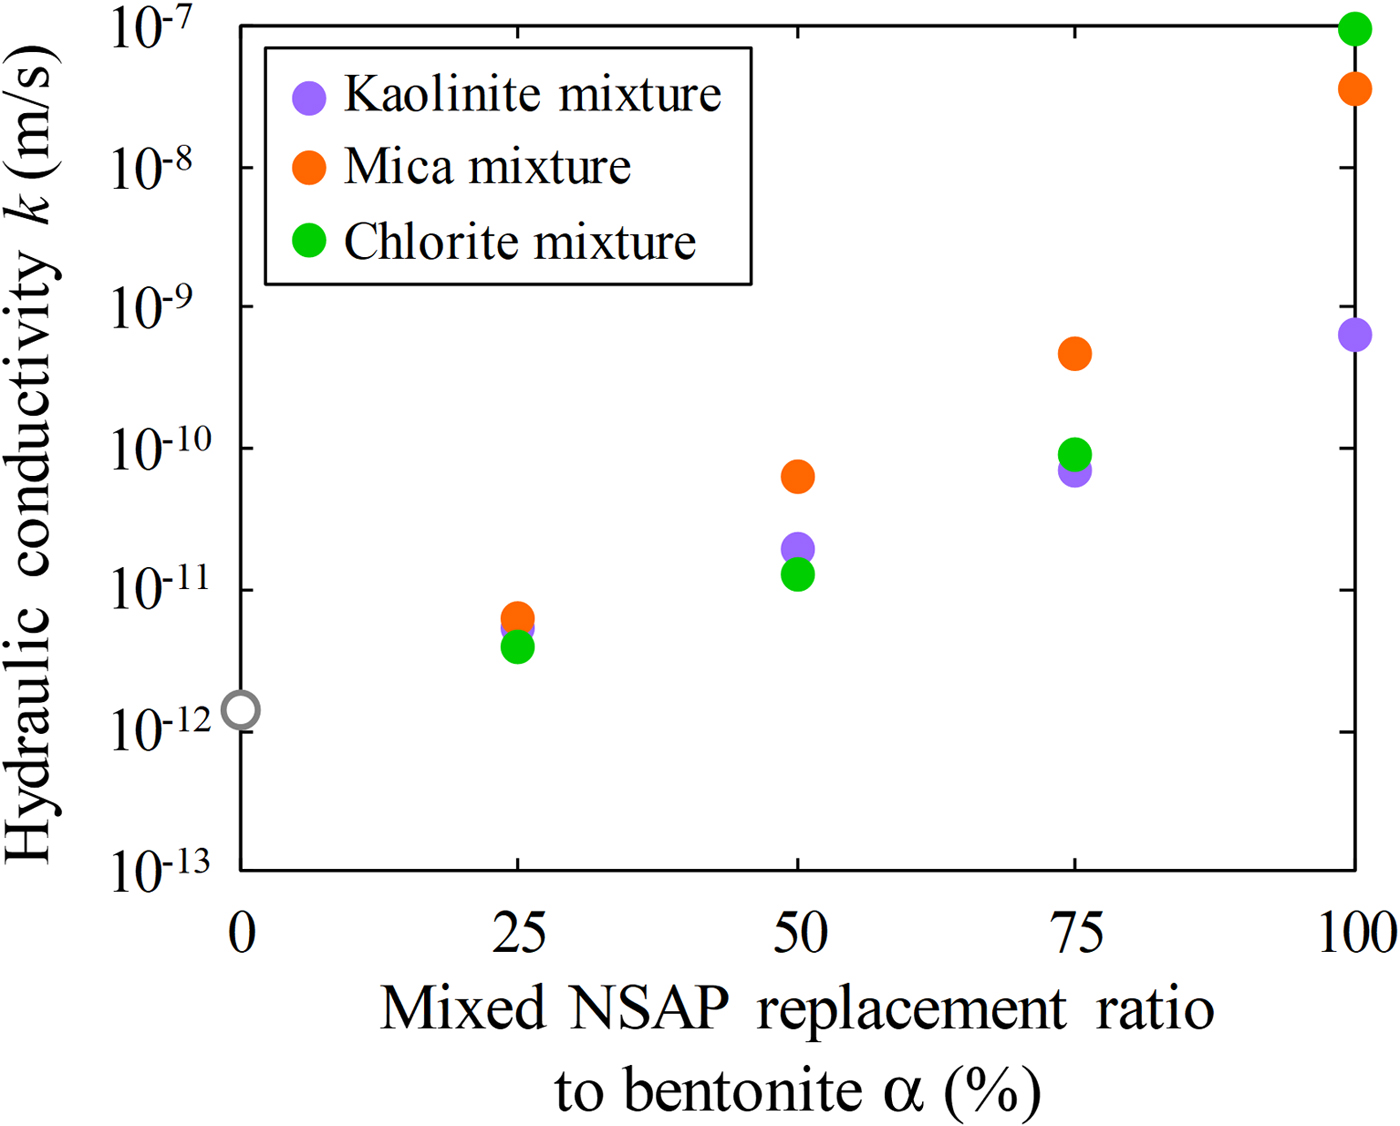
Fig. 8. Relationship between mixed NSAP replacement ratio to bentonite and hydraulic conductivity of bentonite–sand–clay mineral mixtures.
The hydraulic conductivity of the bentonite–sand–clay mineral mixtures increased with the mixed NSAP replacement ratio. For mixtures without bentonite (i.e. clay mineral–sand mixtures), hydraulic conductivity differed depending on the mixed NSAP mineral type, suggesting that an increase in clay minerals due to alteration leads to increased hydraulic conductivity. Conversely, the hydraulic conductivity of kaolinite, mica and chlorite (α = 25%) was comparable, and was not affected by the mixed NSAP type. When a small amount of bentonite was added, the hydraulic conductivity was not affected considerably by the mixed NSAP type. In other words, hydraulic conductivity appears to be affected significantly by bentonite swelling. This swelling fills most voids when the bentonite content is large. However, as the mixed NSAP content increases, swelling pressure decreases and the filling of voids becomes difficult, resulting in increased hydraulic conductivity. Therefore, hydraulic conductivity may not be affected significantly by clay-mineral type when bentonite is present.
Hydraulic conductivity of bentonite–sand–clay mineral mixtures as determined by the Kozeny–Carman equation
Various parameters, such as the specific surface area and void ratio, change due to differences in the clay mineral content. Among models representing the hydraulic conductivity of the porous media, the Kozeny–Carman equation (equation 4) uses the specific surface area. As this equation incorporates macroparameters (i.e. void ratio) and microparameters (i.e. specific surface area), it is often used to evaluate the hydraulic conductivity of bentonite–sand mixtures (e.g. Ren et al., Reference Ren, Zhao, Deng, Kang, Li and Wang2016; Kobayashi et al., Reference Kobayashi, Owada, Ishii and Iizuka2017). The Kozeny–Carman equation (Kozeny, Reference Kozeny1927; Carman, Reference Carman1937) is:
 $$ k_{{\rm KC}} = C\displaystyle{{{\rm \rho} _{\rm w}g} \over {\rm \eta}} \cdot \displaystyle{1 \over {S_{\rm m}^2 {\rm \rho} _{\rm s}^2}} \cdot \displaystyle{{e^3} \over {1 + e}}$$
where k KC (m/s) is hydraulic conductivity, C is a dimensionless shape constant with an approximate value of 0.2, ρw (= 997.770 kg/m3) is the density of water at 22°C, g is gravitational acceleration (= 9.8 m/s2), η (=0.000958 Pa·s) is the coefficient of viscosity at 22°C, S m (m2/kg) is the specific surface area per unit mass of particles, ρs (kg/m3; using equation 1) is the particle density and e (ρs/ρd – 1, ρd = 1400 kg/m3) is the void ratio. The dimensionless shape constant C = 0.2 gives the best fit with experimental results (Carman, Reference Carman1973).
In this study, the specific surface areas (S m) of bentonite–sand–clay mineral mixtures were calculated according to mixed NSAP replacement ratio to bentonite (α) using equation 5 (Komine & Ogata, Reference Komine and Ogata1999b):
 $$S_{\rm m} = \displaystyle{{S_{\rm B}{\rm \rho} _{\rm B}V_{\rm B} + S_{\rm N}{\rm \rho} _{\rm N}V_{\rm N} + S_{\rm S}{\rm \rho} _{\rm S}V_{\rm S}} \over {{\rm \rho}_{\rm B}V_{\rm B} + {\rm \rho}_{\rm N}V_{\rm N} + {\rm \rho} _{\rm S}V_{\rm S}}}$$
where S is the specific surface area per unit mass, ρ is the particle density, V is the volume of the component and the subscripts m, B, N and S represent bentonite–sand–clay mineral mixtures, bentonite, mixed NSAPs and silicate sand, respectively. This equation shows the S m changes due to differences in the volume of the component (i.e. α). Therefore, the calculated specific surface area (S m; Table 5) changes depending on the difference in mixed NSAP type and α. When using N2 gas adsorption, only the outer surface area of montmorillonite may be determined. As water also enters the interlayer region, the specific surface area of the bentonite was calculated using equation 6 (Komine & Ogata, Reference Komine and Ogata1994, Reference Komine and Ogata1999b):
 $$S_{\rm B} = \displaystyle{{C_{\rm M}} \over {100}}S_{\rm M} + \left( {1-\displaystyle{{C_{\rm M}} \over {100}}} \right)S_{{\rm other}}$$
where S B is the specific surface area per unit mass of bentonite (= 388.8 m2/g), C M is the montmorillonite content by percentage of weight (48%; Komine & Ogata, Reference Komine and Ogata1999b), S M is the specific surface area of montmorillonite in bentonite (= 810 m2/g; Komine & Ogata, Reference Komine and Ogata1999b) and S other is the specific surface area of component minerals, excluding montmorillonite, in bentonite. S other (i.e. ~52%) is composed mainly of quartz, feldspars and carbonates. The specific surface areas of these minerals are considered to be very small, as represented by silica sand in Table 3. The assumed value of <1 m2/g is consistent with Komine & Ogata (Reference Komine and Ogata1999b). The calculated specific surface area was substituted into equation 4 to calculate hydraulic conductivity k KC and to compare it with the experimental value k (Table 5).
Table 5. Hydraulic conductivities (k, k KC), specific surface areas (S m) and void ratios (e) of the bentonite–sand–clay mineral mixtures.
Table 5 and Fig. 9 show the hydraulic conductivities (k, k KC), specific surface areas and void ratios of the bentonite–sand–clay mineral mixtures. The specific surface area decreased with increasing mixed NSAP replacement ratio. The particle density of kaolinite was less than that of bentonite. Therefore, the void ratios excluding kaolinite increased with mixed NSAP replacement ratio. For α = 75% and 100%, the k KC hydraulic conductivity values differed from the experimental k values by about one digit. This problem should be addressed in the future. On the other hand, for α = 0% and 25%, the k KC and k values were similar. These results suggest that the hydraulic conductivity may be estimated according to the mixed NSAP replacement ratio (i.e. degree of alteration) when the proportion of clay minerals formed by alteration is small. These data provide a basis for evaluating the hydraulic conductivity of bentonite–sand mixtures with their alteration products in clay radioactive waste-disposal systems.
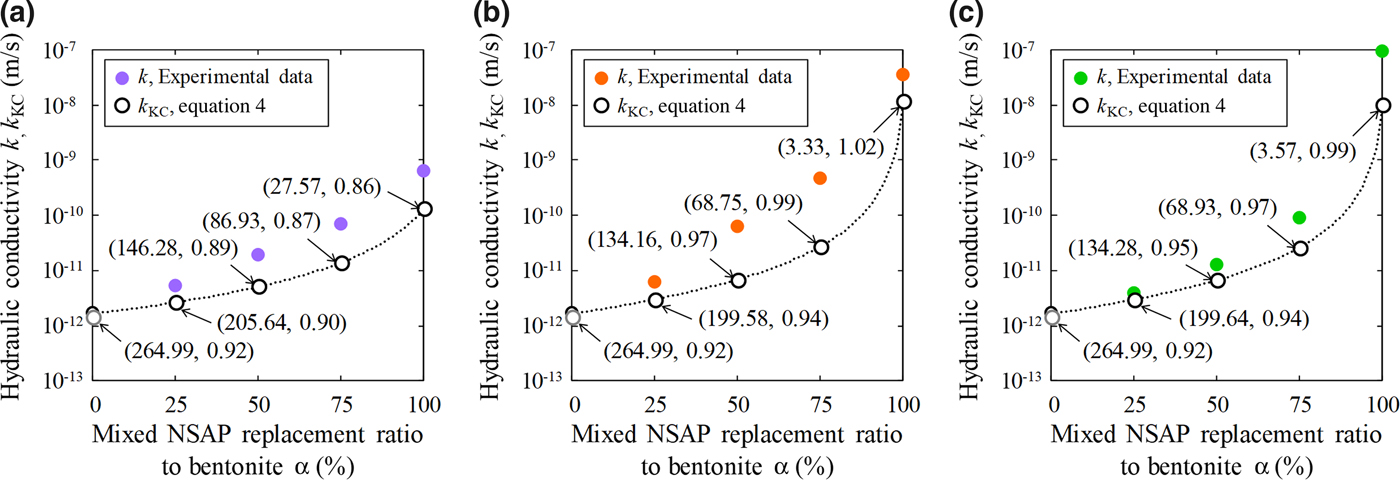
Fig. 9. Comparison between hydraulic conductivities (k, k KC): (a) kaolinite, (b) mica and (c) chlorite mixtures. The numerical values (S m, e) in parts (a), (b) and (c) are the specific surface area (m2/g) based on equation 5 and the void ratio, respectively.
CONCLUSIONS
To clarify the effects of clay mineral type and content, bentonite–sand–clay mineral mixtures and clay mineral specimens were subjected to swelling-pressure and permeability tests. These experiments produced the following results:
(1) Swelling pressure and hydraulic conductivity differed according to clay-mineral type. In particular, the hydraulic conductivity of kaolinite, which is considered to have formed by the alteration of bentonite, and those of mica and chlorite were approximately three to five orders of magnitude greater than the hydraulic conductivity of bentonite. Thus, alteration probably increases hydraulic conductivity.
(2) The swelling pressure of bentonite–sand–clay mineral mixtures decreased with increasing mixed NSAP replacement ratio, without major difference in the various mixed NSAP types. The hydraulic conductivity of bentonite–sand–clay mineral mixtures increased with the mixed NSAP replacement ratio. These findings suggest that an increase in clay minerals due to alteration increases hydraulic conductivity.
(3) The hydraulic conductivity values were similar to those calculated using the Kozeny–Carman equation and specific surface area. These results suggest that hydraulic conductivity may be estimated from the clay-mineral content (i.e. degree of alteration).
Our data provide a basis for the evaluation of the swelling characteristics and permeability of engineered barriers and backfills for the geological disposal of radioactive waste. The relationship between the clay-mineral structures or the interlayer bonding force and hydraulic conductivity will be clarified in future studies. Such research requires an accumulation of data on the swelling pressures and hydraulic conductivities of a large number of bentonite–sand–clay mineral mixtures and clay mineral samples.
ACKNOWLEDGEMENTS
This work was partly supported by Grants-in-Aid for Scientific Research ‘KAKENHI’ (grant number 16K21174) of the Japanese Society for the Promotion of Sciences (JSPS). The support is gratefully acknowledged. The authors thank Mr Sumi K. and Mr Otsuki R. from Tottori University for their assistance with the experiments. The authors also thank two reviewers for their helpful comments and advice.


 Open access