


INTRODUCTION
Emergency Departments (EDs) are complex, fast paced environments set up to quickly and efficiently diagnose and address patient complaints. For many years, EDs have been struggling with crowding and access block; recently this problem has become particularly dire. 1 - Reference Hoot and Aronsky 6 Increased physician productivity (patients seen per hour), may enhance ED operational efficiency if associated with reduced patient wait times, and is financially rewarding to physicians working within volume-incentivised compensation models such as fee-for-service.Reference Blomqvist and Busby 7 However, rapid care may limit the duration and quality of physician-patient interactions, which are primary determinants of the patient experience.Reference Moffatt, Timmons and Coffey 8 , Reference Sun, Adams and Orav 9 One way of measuring how patients are affected by the constraints placed on physicians and EDs is to measure the quality of the patient experience during their ED visit. In fact, some argue that the quality of health care in EDs is best reflected in patient experience measures.Reference Yarris, Frakes and Magaret 5 , Reference Hansagi, Carlsson and Brismar 10 , Reference Yarnold, Michelson and Thompson 11
One challenge in measuring the patient experience is that it is composed of many contributing factors with variable strengths of influence.Reference Boudreaux and O’Hea 12 Factors such as resource availability, patient age and health status, perceived and expected wait times, and illness acuityReference Yarris, Frakes and Magaret 5 , Reference Hansagi, Carlsson and Brismar 10 , Reference Wartman, Morlock and Malitz 13 - Reference Bhakta and Marco 15 all influence patient satisfaction. However, the strongest predictor of patient satisfaction appears to be the quality of interpersonal interaction with care providers.Reference Boudreaux and O’Hea 12 , 16 Furthermore, a USA study found that patient dissatisfaction relates more to the ability of a physician to meet patient expectations and communicate effectively than it does to the medical complexity of a patient’s case.Reference Cydulka, Tamayo-Sarver and Gage 17
Numerous studies have evaluated these determinants of ED patient experience; however, there are limited data quantifying the relationship between patient satisfaction, interpersonal experiences, and Emergency Physician (EP) productivity, while existing studies rarely have survey response rates greater than 20%.Reference Boudreaux and O’Hea 12 , Reference Cassidy-Smith, Baumann and Boudreaux 18 - Reference Pines, Iyer and Disbot 22 The relationship between physician productivity and patient perception of care is critical if the pressuring of EPs to be more efficient compromises the patient experience.
Our objective was to assess the relationship between EPs productivity and patients’ satisfaction with ED care provided. We assumed that physicians who saw larger numbers of patients hourly were spending less time with each patient. Thus we considered productivity to be inversely related to the quality of interpersonal interaction between the physician and the patient and hence the patient experience. We hypothesised that patient satisfaction with ED care would decrease as the number of patients seen per hour by the physician increased.
METHODS
This retrospective observational study, performed in collaboration with the Health Quality Council of Alberta (HQCA), linked Calgary regional EPs performance data with the validated HQCA Patient Experience Surveys completed during the same time period. Linking these data allowed us to assess the correlation between EP productivity and patient satisfaction with their ED interactions.
Study setting and population
The study was performed in three urban EDs within the Calgary Health Region (Foothills Medical Centre, Rockyview General Hospital and Peter Lougheed Centre) between June 2010 and July 2013. Average ED census for each ED ranged from 75,000 to 79,000 visits per year; approximately 15% of visits involved a resident and 10% involved a medical student. The survey population included patients over 16 years old who presented to one of the three EDs and completed an HQCA ED Patient Experience Survey. All physicians were remunerated on a fee-for-service basis and were excluded from the analysis if they had less than 10 completed survey responses. The study was approved by the University of Calgary Research Ethics Board (REB13-0092).
Data sources
The HQCA, an organization independent from the provincial health authority, has a legislated mandate to measure, monitor, and assess patient safety and health care quality, and to collaborate with health authorities in making recommendations for improvement. 16 Since 2007, the HQCA has been administering the HQCA ED Patient Experience Survey to patients in Alberta’s 15 busiest EDs. 16 This survey was developed by Picker Europe for the British National Health Service and Healthcare Commission, and was selected by the HQCA for its relevance, availability, and level of validation.Reference Jenkinson, Coulter and Bruster 23 , Reference Bullen, Reeves and Richards 24 Further details about the survey tool selection, adaptation, validation, consent process, and application can be found in the 2007 HQCA Emergency Department Patient Experience Survey Report. 25
From the HQCA surveys, we identified key items of patient experience most influenced by physicians. These individual survey questions were grouped into six composite domains as previously identified by the HQCA 25 to improve the robustness of obtained responses. The domains each address a common patient experience issue and are defined as follows:
-
1. Staff Care: how well ED staff discussed and explained a patient’s medical condition, plan, and results. How well they listened to patients’ concerns. How much did patients trust their physicians and feel that they were involved in decision-making.
-
2. Pain Management: how effectively and efficiently pain was managed by ED staff.
-
3. Discharge Communication: how well staff discussed discharge plans, follow-up care, danger signs to be aware of, and how well they addressed any concerns prior to discharge.
-
4. Respect: how respectful were staff of patients and their families.
-
5. Medication Communication: how effectively medication use and side effects were explained to patients.
-
6. Wait Time and Crowding: how did wait time and crowding influence the patient experience.
A full list of the questions used in each composite domain can be found in Appendix 1.
Physician productivity was defined as the average number of patients seen per scheduled work hour over the sampling interval.Reference Moore 26 Productivity information was extracted from the Real-Time Emergency Department Information System (REDIS) used in the Calgary Zone of Alberta Health Services until April 2013 and the Sunrise Emergency Care (SEC) used since May 2013 in all Calgary Zone facilities. EP productivity levels and HQCA Patient Experience Survey outcomes were then correlated for individual EPs, and de-identified data was provided to the research team for analysis. Our primary objective was to determine whether a correlation existed between ED physician productivity and ED patient experience.
Statistical analysis
A post-hoc power calculation was performed (G*Power 3.01.0) which confirmed that our sample size was sufficient to detect an effect as 0.0613 with a beta error of 0.80. The data was analysed using SPSS (IBM Statistics Version 19). We used descriptive statistics to analyse the composite satisfaction domains as well as average physician productivity (patients/hour). We used a Pearson correlation coefficient to examine the bivariate relationships between physician productivity and patient satisfaction domains. We then used multivariable linear regression models to further quantify the association between physician productivity and patient experience scores. After the assumptions of linear regression were assessed, we developed models with the score for each patient experience domain as the dependent variable and physician productivity as the independent variable along with physician age, training route (CCFP EM or FRCPC), average patient age per shift, and proportion of patients admitted per physician as potential confounders. A backward stepwise selection procedure was used to generate the most parsimonious model for each satisfaction variable.
Finally, we performed a path analysis using Stata Statistical Software (StataCorp. Release 12). This method is an extension of a regression model and examines whether variables influence each other in a chain-like fashion. In other words, it tests for interrelationships between variables.Reference Klem 27 , Reference Streiner 28 The path analysis was broken up into two sections. The first decomposed the effects of physician and patient characteristics on physician productivity and the second decomposed those characteristics on patient experience ratings. For a more complete explanation of the path analysis, please refer to Appendix 2.
RESULTS
During the study period, 3,794 patient surveys were completed for 130 eligible ED physicians. Overall, the survey response rate was 45%. Mean patient age was 52 years (SD=20; 45% male). Mean physician age was 45 years (SD=9; 80% male) (Table 1). A detailed table of physician productivity versus composite domain scores can be found in Appendix 3.
Table 1 Overall descriptive characteristics of physicians including mean and median composite domain scores with accompanying SD and IQR
SD=standard deviation; IRQ=interquartile ranges; FRCPC=Fellow of The Royal College of Physicians of Canada.
Very weak non-significant negative correlations existed between productivity and the composites: “Staff Care” (r=-0.057, p=0.521), “Discharge Communication” (r=-0.144, p=0.102), “Respect” (r=-0.027, p=0.760), and “Wait Time and Crowding” (r=-0.064, p=0.470). Very weak non-significant positive correlations existed between productivity and composites: “Medication Communication” (r=0.003, p=0.974) and “Pain Management” (r=0.020, p=0.824) (Table 2). Scatter plots that visually represented the relationship between productivity and each patient experience domain did not suggest an alternative non-linear relationship (Figures 1–6).

Figure 1 Patient experience score in the Staff Care Composite domain versus physician productivity
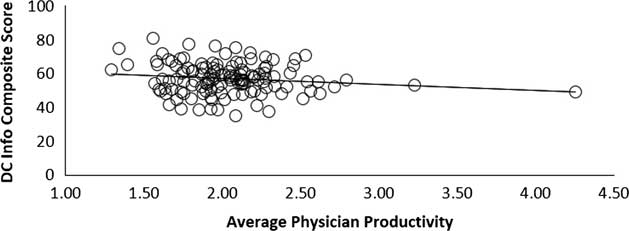
Figure 2 Patient experience score in the Discharge Information Composite domain versus physician productivity.
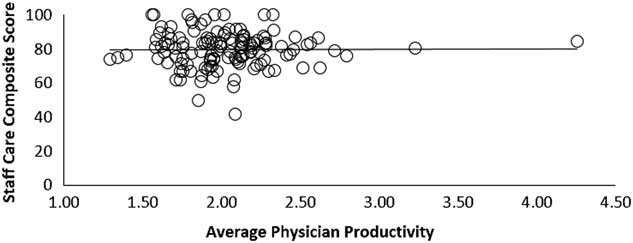
Figure 3 Patient experience score in the Medication Communication Composite domain versus physician productivity
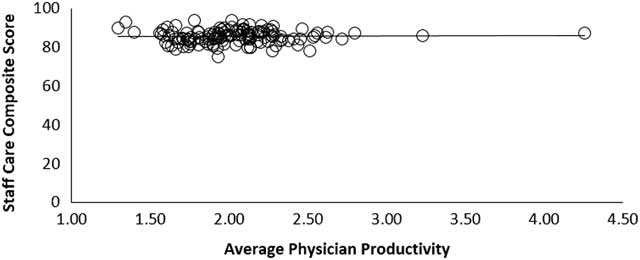
Figure 4 Patient experience score in the Respect Composite domain versus physician productivity.

Figure 5 Patient experience score in the Pain Management Composite domain versus physician productivity.

Figure 6 Patient experience score in the Wait Time and Crowding Composite domain versus physician productivity
Table 2 Pearson correlation results comparing composite domain outcomes to physician productivity.
Linear regression modelling did not identify any statistically significant association between physician productivity and any of the composite domains of patient satisfaction (Table 3) after adjusting for potential confounders.
Table 3 General linear model results comparing composite domains to physician productivity
Both decompositions in our path analysis reinforced the findings of the primary analysis. Standardized coefficients showed that physician training program, physician age, patient age, and admission status had weak, non-significant effects on physician productivity (see Table 4). These variables had no significant effect on patient experience either directly through physician productivity or indirectly by modifying physician productivity. We found that the patient experience ratings regarding “Medication Communication” and “Wait Time and Crowding” improved when a higher percentage of patients were admitted (total effects: 0.188; p=.037 and 0.214; p=0.016, respectively) (see Table 5).Reference Cohen 29
Table 4 Decomposition of the total effects of physician characteristics and patient characteristics on physician productivity

CCFP-EM=Canadian College of Family Physicians - Emergency Medicine; FRCPC=Fellow of The Royal College of Physicians of Canada
Table 5 Decomposition of the total effects of physician characteristics (including productivity) and patient characteristics on patient experience ratings
*p≤0.05.
DISCUSSION
Our findings showed no linear relationship between EP productivity and the patient experience. Visual examination of scatter plots did not suggest any alternative non-linear relationship. The only relationship that approached statistical significance was the relationship between physician productivity and satisfaction with discharge instructions. Similar non-significant associations between physician productivity and patient satisfaction have been reported in USA primary care settings.Reference Wood, Spahr and Gerdes 30 Nonetheless, these results were surprising given the rational link between productivity, throughput, and wait times, and the logical assumption that more “efficient” physicians have less time to devote to patient communication and rapport. One potential explanation for our finding is that patients in our study may place high value on physicians who provide care in an efficient fashion. Whereas patients in other clinical settings may be expecting lengthy discussions of their health, ED patients may be expecting fast care and are more satisfied when this expectation is met.
Because findings were discordant with our hypothesis, we performed a path analysis to determine if interrelationships between variables were confounding the observed relationship between EP productivity and patient experience. For example, patient age was associated with greater complexity, reduced EP productivity, higher admission rates, and differences in patient experience; therefore, any observed differences in patient experience could be due to factors other than the proposed explanatory variable of EP productivity. Although we found some statistically significant associations in the domains of “Medication Communication” and “Wait Time and Crowding” when a higher percentage of patients were admitted, it is important to note that the indirect effects via physician productivity were extremely small (0 for “Medication Communication” and 0.001 for “Wait Time and Crowding”). Thus, these impacts most likely reflected the higher complexity of admitted patients than any relationship to physician productivity.
Despite previous findings that interpersonal interactions between physicians and patients were the strongest predictors of patient satisfactionReference Boudreaux and O’Hea 12 , Reference Boudreaux, D’Autremont and Wood 31 our study suggests that time spent with physicians does not by itself determine the perceived quality of the interaction. This implies that EPs’ ability to establish positive rapport with their patients was independent of their productivity, which further contributes to an increasing body of literature suggesting that multiple factors (e.g., physician technical skill, wait times) influence patient satisfaction.Reference Boudreaux and O’Hea 12 , Reference Wood, Spahr and Gerdes 30 - Reference Mercer, Hernandez-Boussard and Mahadevan 32 This apparent lack of association between productivity and patient experience may simply be due to methodological differences between our study and the majority of published literature on the subject.Reference Boudreaux and O’Hea 12 , Reference Boudreaux, D’Autremont and Wood 31 For example, most of the existing studies were conducted in USA EDs, which represent a dramatically different environment from the publically funded Canadian EDs we examined.
This study had several strengths. Notably, it is the first to correlate EP productivity performance with patient experience in an ED population. Similar studies have been done in clinics or inpatient settings, but these may not be generalizable to the ED.Reference Wood, Spahr and Gerdes 30 Second, we were able to link a large sample of patient satisfaction scores with physician productivity data. Furthermore, the 45% survey response rates in this study were relatively high. Typically, ED patient satisfaction surveys yield response rates around 25%–30%, with some studies as low as 15%.Reference Sun, Adams and Burstin 19 , Reference Pines, Iyer and Disbot 22 , Reference Jenkinson, Coulter and Bruster 23 , Reference Castle, Brown and Hepner 33 Finally, the data we used was collected using an internationally validated tool that was administered by an arm’s length organization, thereby, reducing collection bias.Reference Jenkinson, Coulter and Bruster 23 , Reference Bullen, Reeves and Richards 24
Limitations
Our study adapted data that was collected for a different purpose. Although the survey tool is widely validated, its purpose was not solely to evaluate the patient-physician interaction, but rather the patient experience with all care providers in the department. Therefore, a degree of instrument bias may have been introducedReference Indrayan 34 potentially decreasing the sensitivity of our study to physician efficiency. Furthermore, since we did not directly measure time spent by physicians with patients, but rather used productivity as a proxy with the assumption that faster EPs interacted less with their patients. We also assumed that the effects of shift variability (both from a departmental flow and physician productivity perspective) leading to fluctuations in productivity would have been mitigated by the large number of surveys filled out per physician (mean=29) over the 37-month study period. Nonetheless, these limitations may have impacted our ability to detect a difference and may have introduced bias.
Thus, we acknowledge that in the ED, where medical complexity varies significantly from one patient interaction to the next, the number of patients seen per hour is a simplistic measure of productivity, less robust than the USA RVU model, which incorporates physician work, practice expense, and opportunity cost of specialty training.Reference Moore 26 , Reference Indrayan 34 - Reference Jeanmonod, DelCollo and Jeanmonod 39 However, in Canada no standardised comprehensive measure of productivity exists. Until a more complete productivity tool is adopted in Canada, we feel that “patients seen per hour” is a reasonable metric.
Finally, though it is well documented that other variables such as wait times, crowding, and interactions with non-physician ED staff all influence patient satisfactionReference Yarris, Frakes and Magaret 5 , Reference Hansagi, Carlsson and Brismar 10 , Reference Boudreaux and O’Hea 12 - Reference Bhakta and Marco 15 , we were unable to determine how variables such as learner involvement, illness acuity, and treatment outcome influenced our data.Reference Wood, Spahr and Gerdes 30 , Reference Bhat, Dubin and Maloy 40 Such a study would require significantly greater resources to determine the influence of these multiple variables. We recommend that future studies account for these potential confounders.
CONCLUSION
We found no association between EP productivity and the patient experience. Therefore, we failed to confirm our hypothesis that patient experience is inversely related to physician speed. Patient experience is influenced by many variables but data from our centers do not suggest that EP practice speed is a critical determinant of measurable differences in patient experience.
Competing Interests: None declared.
SUPPLEMENTARY MATERIALS
To view supplementary material for this article, please visit http://dx.doi.org/10.1017/cem.2016.385


