


CLINICIAN'S CAPSULE
What is known about this topic?
Physicians are increasingly being provided with feedback on their own clinical practice metrics, called audit and feedback.
What did this study ask?
We assessed whether physicians wanted to participate in audit and feedback activities, asked which data were most important, and then sought differences among subgroups.
What did this study find?
We found physicians wanted audit and feedback, had clear and common preferences for the data being reported with some notable subgroup differences.
Why does this study matter to clinicians?
Physicians want audit and feedback and have clear data preferences that should be used to drive implementation success and improvement.
INTRODUCTION
Audit and feedback is a widely used strategy for assessing and improving physician performance.Reference Ivers, Jamtvedt and Flottorp1–Reference Cooke, Duncan, Rivera, Dowling, Symonds and Armson3 It involves measurement of performance on several metrics and feedback of those results to physicians for comparison against peers or other benchmarks. There is evidence that audit and feedback is both demanded by physiciansReference Lavoie, Plint, Clifford and Gaboury4 and leads to modest improvements in professional practice.Reference Ivers, Jamtvedt and Flottorp1
With the growth and increasing availability of robust electronic health records systems, there is now a greater ease in measuring and reporting physician clinical performance measurement and reporting. Much of these activities have been driven by hospital administrators, government agencies, and quality assessment organizations rather than physicians themselves.Reference MacLean, Kerr and Qaseem5 Limitations in the available data, in addition to insufficient engagement with clinicians, has led to the use of metrics poorly suited for the goal of improving care, including measures of practices unsupported by evidence.Reference MacLean, Kerr and Qaseem5
Meanwhile, when initiating new educational initiatives, it is common to engage in some level of needs assessment to establish the stated and hidden needs of one's intended audience.Reference Stefan, Hall, Sherbino and Chan6,Reference Chan, Jo and Shih7 Needs assessments may be a powerful tool to understanding how best to engage in audit and feedback implementation but are lacking in the current literature.
Recognizing the local peculiarities of all audit and feedback activities and their implementation, we conducted a regional needs assessment of emergency medicine (EM) physicians in the Southern Ontario. A needs assessment process such as this has not previously been completed for EM physicians in Canada. We aimed to assess EM physician's impressions of audit and feedback, including their perceptions of specific metrics from diverse practice categories and their attitudes toward who should have access to practice data.
METHODS
We surveyed EM physicians in our region to assess their audit and feedback needs (online Supplemental Appendix A). The data metrics used in the survey were based on a framework currently used in the emergency department (ED) at the University of Calgary.
Survey development
The survey included participant demographics, as well as questions regarding attitudes toward audit and feedback. The survey covered the following broad feedback categories included in the University of Calgary framework: Operational, Flow, Balancing, Resource Utilization, Patient Satisfaction, and Disease-Specific Measures. We added Collaboration, Education, and Patient-Reported Outcome Measures categories to the survey to unify current feedback activities with newer metrics and to include novel ideas that are presented in the literature. Further questions to assess respondents’ preferences for audit and feedback frequency and data anonymity were also included. All questions were evaluated on a 10-point Likert scale.
Two experienced researchers (M.M. and K.W.) assessed the first draft for face and content validity. The revised survey was then uploaded to SurveyMonkey®, which includes a proprietary survey review tool. A local qualitative researcher then reviewed the survey for content, methods, and language (T.C.). Our chief resident with methodological expertise in Quality Improvement then reviewed the survey for readability, consistency, and comprehension (R.G.). At this stage, the survey was reviewed by a survey expert and qualitative researcher at McMaster Education Research, Innovation, and Theory (MERIT) (Sa.M.). A local physician colleague then performed a cognitive review of the survey for the research team and provided feedback on modifications, improvements, and clarity (A.M.). Finally, the survey was completed and reviewed by two external clinicians from the University of Ottawa Department of Emergency Medicine to again assess the face and content validity, as well as readability (G.M. and A.K.).
Participants
Respondents were recruited through seven local health systems. Emails requesting participation were sent to each clinical chief for dissemination. Respondents were entered into a draw for a $150 gift card. The recruitment email was sent at the end of January 2019. Reminder emails were sent in mid-February and early March 2019. The final email soliciting participation included a “leaderboard” of participating sites in an effort to gamify survey responses. The target for total survey responses was 100 respondents. The project was granted Quality Improvement (QI) exemption from Hamilton Integrated Research Ethics Board (HiREB).
Analysis
Means and standard deviations were calculated for each question. Overall rankings of metrics were conducted based on averages and standard deviations. In instances where averages were the same, those metrics with smaller standard deviations were ranked more highly. Unpaired t-tests were used for gender-group and practice-type comparisons. The statistical testing was only applied to questions in which there was a mean difference of greater than 0.5 on the 10-point Likert scale, as the research team believed that to be the lower limit value for significance in real practice. Data regarding duration of practice were stratified into three duration-based classifications for each question. Analysis of variance was not performed due to the significant number of study questions (49) and the likelihood of positive finding due to chance alone. Our study purpose was primarily descriptive, and any statistical comparisons were meant for hypothesis generation only.
RESULTS
Reporting guidelines as described by Kelley et al.Reference Kelley, Clark, Brown and Sitzia8 were followed for this publication. A total of 104 EM physicians responded to the survey from a total of six hospitals and one regional health system (Niagara Health - containing five clinical ED sites). Among these institutions, one hospital treated only a pediatric population (McMaster Children's). Two regional community hospitals had only one respondent to the survey, both of whom were included in summary data but eliminated from site-specific descriptions. After excluding the sites with single respondents, there were a total of 195 EM physicians, yielding an overall response rate of 52.3%. The percentage of respondents from each clinical site ranged from 27.8% to 81.0%.
Five respondents identified both as academic and community practitioners and their data were included in both the academic and community cohorts for analysis as it was believed that this was a better representation of their actual practice and was likely to diminish statistically significant differences rather than accentuate them. A total of 69 (66.3%) practitioners identified as having an academic practice and 40 (38.5%) as having a community practice. Thirty-eight (36.5%) respondents identified as female and 65 (62.5%) as male. The total percentage of males employed at each site ranges from 57.1% to 83.3%. Respondents were for the most part within the first 10 years of practice (42 at <5 years, and 65 at <10 years). Only 17 respondents had more than 20 years of practice.
Attitudes on audit and feedback
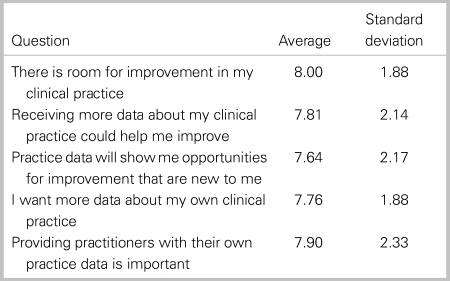
Respondents indicated the desire to engage in more audit and feedback regarding their clinical practice and believed audit and feedback could improve their clinical practice. The distribution of responses to questions regarding attitudes on audit and feedback are presented in Table 1.
Table 1. Responses for attitudes towards audit and feedback
Overall metric rankings
The entire family of proposed metrics was sorted by medians, then by the lower quartile followed by the upper quartile value. The 10 metrics that were rated highest by respondents are displayed in Table 2, and the bottom 10 rated metrics are displayed in Table 3. A full ranking on individual metrics can be found in the online Supplemental Appendix B.
Table 2. Top 10 metrics as evaluated by respondents
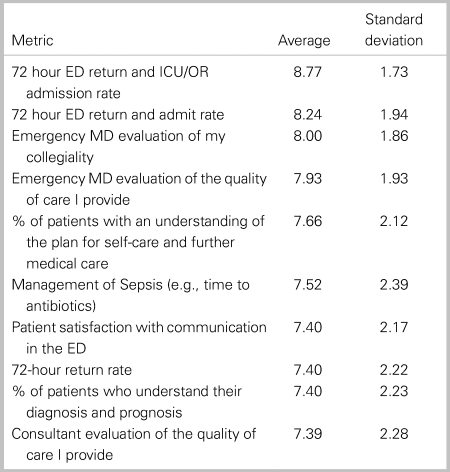
Table 3. Bottom 10 metrics as evaluated by respondents

Site-specific comparisons
All five clinical sites that were surveyed had the following four data elements in common within their top 10 lists: 72 hour return and admit rate, 72 hour return admitted to the operating room/intensive care unit (OR/ICU), EM physician evaluation of my collegiality, and EM physicians evaluation of the quality of care that I provide. The remaining elements in the top 10 at each site are found in Table 4 in rank order.
Table 4. Other top 10 elements for each specific site included in the survey

Data privacy and dissemination
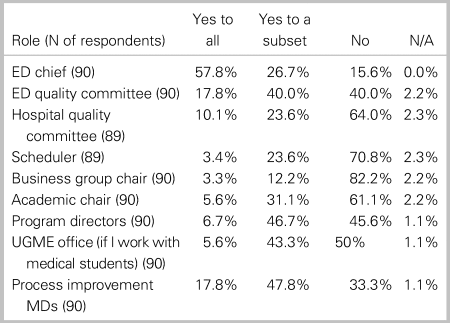
Questions around data anonymity had only 90 respondents. Of these, 82 (91.1%) preferred seeing the distribution of data within their department but only being able to identify their own practice data. Two respondents hoped to all un-anonymized data, and six respondents believed they should have access to only their data without comparators. Table 5 details whom respondents believe should have access to their own practice data.
Table 5. Privacy and dissemination preferences of respondents
Notable differences between academic and community practitioners
Overall, few statistically significant differences were observed between academic and community practitioners. Comparisons between both groups identified that community physicians were more interested in having their transfer rates reported to them (5.71 v. 4.52; p = 0.03), were more interested in registration to physician assessment time (5.17 v. 4.19; p = 0.01), were less interested in 72 hour ED return rate with ICU/OR admission (8.35 v. 9.05; p = 0.04), and were significantly more interested in the management of stroke (7.33 v. 5.69; p = 0.004).
Notable differences between genders
There were statistically significant gender differences in some metrics. Female respondents were less likely to believe that receiving more practice data would help them improve (7.30 v. 8.30; p = 0.02), were less likely to want more data about their clinical practice (7.22 v. 8.11; p = 0.02), and were less likely to think that providing individuals with practice data was important (7.16 v. 8.36; p = 0.01). The only other statistically significant data point was that female respondents rated the metric of “Number of patients seen per shift” lower than their male counterparts (5,82 v. 6.87; p < 0.01)
Notable trends between years in practice
Those individuals with less than 5 years of practice ranked almost all metrics higher than their peers with the exception of the disease-specific metrics and patient outcomes categories. Those practitioners with between 16 and 20 years of practice placed a higher value on disease-specific and patient outcome metrics. Those practitioners between 5 and 10 years or those with greater than 20 years of experience generally rated the value of audit and feedback metrics the lowest through the majority of categories.
DISCUSSION
The results of this survey show a strong desire by EM physicians to engage in local audit and feedback. This is in keeping with previous findings described in the literature.Reference Lavoie, Plint, Clifford and Gaboury4 Across all sites, 72-hour return metrics figured prominently and has been described in the literature.Reference Calder, Pozgay and Riff9 Surprisingly, peer ER physician assessments of collegiality and competence were highly sought-after metrics, both of which are also described.Reference Norcini10–Reference Ramsey, Wenrich, Carline, Inui, Larson and LoGerfo13 In addition, this study shows that patient satisfaction metrics and patient-reported outcome metrics were important for physician audit and feedback in many centers. Finally, metrics focused on adherence to clinical practice guidelines (CPGs) were meagerly represented within the top metrics rated by clinicians, with a focus only on adherence to sepsis among the top 10. In contrast, our regional pediatric center rated five metrics related to adherence to CPGs among their top 10.
Of interest, many of the lowest-ranked metrics were focused on ED resource use. Other literature has documented that, when surveyed, EM physicians believe that there is an overuse of medically unnecessary advanced diagnostic imaging.Reference Kanzaria, Hoffman, Probst, Caloyeras, Berry and Brook14 Our study allowed respondents to rate the importance of resource use among other practice metrics. It may be that participating physicians place less value on resource awareness in the ED when compared with other practice metrics, supporting the need for initiatives such as Choosing Wisely Canada.15 An alternative explanation may be that the physicians believe there is little room for improvement in these areas, which could be the case in their local environments. For some of these metrics, the notion that there is little room for improvement would not be supported by the literature (de Wit, unpublished findings: Qualitative assessment of physician practices of DVT and PE diagnostic ordering practices, October 2019). Combined with the presence of the “consultation rate” among the lowest-ranked metrics, it is also possible that the picture may represent the physician's desire to preserve independent decision-making and practice.
We noticed that female respondents rate audit and feedback activities in general and volume-based metrics of lower value. One hypothesis to explain this is that female physicians’ actual practice reflects a more patient-centered approach with more time spent at the bedside. This would lead to less emphasis on metrics outside of that interaction, particularly volume-centered metrics. Previous large studies have demonstrated more patient-centered practices in womenReference Bertakis, Helms, Callahan, Azari and Robbins16–Reference Roter and Hall19 and lower mortality and 30-day readmission.Reference Tsugawa, Jena, Figueroa, Orav, Blumenthal and Jha20 This was demonstrated in an internal medicine population and has not been explored in an ED setting. The signal for gender preference in our survey should be considered hypothesis generating rather than generalizable across populations, and we are currently pursuing a qualitative study to further explore these findings.
Responses from practitioners with less than 5 years of experience were almost universally positive regarding audit and feedback activities. This may indicate a shift toward the need for objective measurements of practice, or a reflection of a persistent desire for feedback, which physicians in training are increasingly accustomed to receiving. This said, there is no literature to support these hypotheses.
Physicians had very specific preferences for which individuals and entities should have access to their practice data. Among all presented options in Table 5, only four entities retained the approval of more than half of the respondents (answered “yes” or “yes to a subset”): The ED chief, the ED quality of care committee, program directors, and the process improvement physician in the group. It seems that physicians are quite invested when they know that practice data will be seen by individuals who understand the clinical context in which they practice. It could be hypothesized that physicians are hopeful that these data may be used internally to drive positive change but should not be used as external pressure for change.
Finally, it should be noted that physician preference should not make up the entirety of how we choose appropriate audit and feedback metrics. By choosing areas outside of these preferences, physicians and departments may have identified unperceived learning needs and practice gaps that were not appreciated by physicians alone. These areas represent important targets for practice improvement.
LIMITATIONS
As in all surveys, it is possible that, despite its response rate, the survey attracted largely those individuals who have an interest in having practice data. Those who have not participated may have more negative impressions of audit and feedback for physicians and may have ranked different elements as more desirable. The sequelae of this study would inform a starting point for audit and feedback in other centers, leading groups who are developing this functionality to include “late-adopters” early in the project development and derivation phase.
Due to the significant number of metrics (49) that were ranked by respondents, conducting analyses of significance on all variables would yield a high probability of spurious findings. As such, analyses were limited to differences between results that were externally valid (0.5). It is possible that there were some significant results that did not meet this threshold and were not analyzed.
Within the group of respondents, there were some sites that have begun activities of audit and feedback and others that have not. Those that are already conducting this practice may have a more pragmatic and experienced view of what data are truly useful to their practice. Those who have not yet participated in this activity may have ranked elements that will later prove to be less useful. This is less likely due to the homogeneity of the data between clinical sites, yet remains possible.
CONCLUSION
This is the first needs assessment described in the literature that examines EM physicians’ readiness and desired metrics with audit and feedback within an entire health care region. The results of this study should help inform the development and implementation of physician-centered audit and feedback activities. Understanding what information physicians value with respect to their practice is an important aspect of the change management cycle during the implementation of such activities.
Supplemental material
The supplemental material for this article can be found at https://doi.org/10.1017/cem.2020.348.
Clinical trials registry
Not applicable.
Ethics
This project received QI exemption from the Hamilton Integrated Research Ethics Board (HiREB).
Financial support
Dr. Mondoux holds an early career research award through the Department of Medicine at McMaster University and receives financial support for his role as the Quality and Safety Lead at St. Joseph's Hospital Hamilton.
Competing interests
None declared.


