


Introduction
In order to understand and predict how insect populations will respond to environmental disturbances, such as climate change and human intervention, we need to understand what drives individual movement (Morales et al. Reference Morales, Moorcroft, Matthiopoulos, Frair, Kie, Powell, Merrill and Haydon2010). However, there are challenges with current practices of measuring movement, most notably that popular choices such as geographic positioning systems, radio telemetry, and cameras that trace movements in the laboratory can be expensive (Lavandero et al. Reference Lavandero, Wratten, Hagler and Jervis2004). This can limit how many researchers study questions of movement, particularly if they are graduate students or early career researchers with limited access to funding. We therefore developed a method that can detect differences in movement among groups of terrestrial insects in the laboratory that is inexpensive in terms of materials required, can be used in the dark without near-infrared sources, and produces data that can be captured in an image and later analysed with computer software applications.
To test our method, we measured the effect of light on the movement of Harpalus rufipes (De Geer) (Coleoptera: Carabidae). Harpalus rufipes is a common nocturnal ground beetle in many cropping systems of North America and Europe (Lövei and Sunderland Reference Lövei and Sunderland1996; Fournier and Loreau Reference Fournier and Loreau1999; Cutler et al. Reference Cutler, Renkema, Majka and Sproule2012) and was therefore easily accessible to us. Since Carabidae and many other insects use light to orient themselves in their environment (Colombini et al. Reference Colombini, Chelazzi and Scapini1994; Heinze and Reppert Reference Heinze and Reppert2011; Lebhardt and Ronacher Reference Lebhardt and Ronacher2014), this was a logical relationship to test our method with.
The objective of this study was to determine how H. rufipes movement is affected by light and ultraviolet (UV) light when compared to darkness using our method. We predicted that the amount of movement would be higher in darkness than in light, given that H. rufipes is a night hunter, and that the amount of movement would be higher in darkness than in UV light, because many insects can see UV light (Burkhardt Reference Burkhardt1977).
Materials and methods
Beetle collection and experimental design
We collected H. rufipes specimens from a commercial lowbush blueberry field in Debert, Nova Scotia, Canada (45° 25′ 12′′ N; 63° 30′ 41′′ W), with pitfall traps (Greenslade Reference Greenslade1964). We identified them using Lindroth’s keys (Lindroth Reference Lindroth1961, Reference Lindroth1968) and voucher specimens located in the A.D. Pickett Entomology Museum at the Dalhousie Agricultural Campus, Truro, Nova Scotia, Canada. We stored the beetles in sealable plastic cups (120 mL) with a 50:50 (v:v) moistened peat and play sand mixture on laboratory bench tops and fed them cat food (Whiskas; Mars Canada, Bolton, Ontario, Canada). We set up a randomised block design experiment, with 10 blocks (time as the blocking factor) and three treatments in each block: light, dark, and UV light. We ran each block for two hours with three unsexed beetles in each treatment arena at a time, with new beetles in every block, making for a total of 90 beetles. We ran all blocks between 09:00 and 17:00 hours.
Movement detection method and measurements
We set up three arenas on a clean table, covered with black plastic. The arenas were made of a plexiglass wall (height × diameter = 3.6 × 105 cm) enclosed in a cardboard box (height × length × width = 53 × 125 × 100 cm) with a 12-cm-diameter hole in the top for the treatment lights. The floor was a layer of white sand (≈ 2 mm deep, White Play Sand; Shaw Resources™, Shubenacadie, Nova Scotia, Canada), with four equidistant straight lines of orange fluorescent powder (2 cm wide; ≈ 3 mm deep; Radiant Color, A Magruder Color Co., Elizabeth, New Jersey, United States of America). After walking through the fluorescent powder, the beetles left a fluorescent trail on the sand that would glow under UV light. The sand and powder were replaced for each block.
In order to record the movement patterns, we photographed the arenas under UV light after each trial. Then we measured total path area travelled (cm2) by the beetles, using area by colour in the software ImageJ (Abràmoff et al. Reference Abràmoff, Magalhães and Ram2004; https://imagej.net/ [accessed 17 June 2020]). We classified the images using hierarchical classification with a Euclidian distance function, and Ward linkage (Silla and Freitas Reference Silla and Freitas2011) using the Agglomerate function in Mathematica 11.2 (Wolfram Research 2018). We measured three statistics for each image: for circularity, we used the correlation between path segment direction and angle to centre; for activity, we used the proportion of area covered by tracks; and for evenness, we used the proportion of track density in the centre half versus the outside half. The procedure classified the images into four categories, which we called circular (“A”), webbed (“B”), scattered (“C”), and indistinguishable (“D”) (Table 1 and Figs. 1 and 2).
Table 1. Harpalus rufipes movement pattern categories, as determined by path circularity (correlation between path segment direction and angle to centre), activity (proportion of area covered by tracks), and evenness (proportion of track density in centre half versus the outside half of the arena floor). See Fig. 1 for example images.


Fig. 1. Example images of Harpalus rufipes movement pattern categories: A, Circular (A); B, Webbed (B); C, Scattered (C); D, Indistinguishable (D). See Table 1 for the relevant movement statistics of each category.

Fig. 2. Three-dimensional plot of Harpalus rufipes movement pattern images measured on three statistical axes. Each point represents one image from one experiment, with the letters representing the four classified categories: (A) Circular; (B) Webbed; (C) Scattered; and (D) Indistinguishable.
Light treatments
The light treatment was a 16-W, 5000-K, 1520-lumen LED light (model: LED16LS2/850; GE Lighting, East Cleveland, Ohio, United States of America) with an intensity of ≈ 1053 Lux (measured with a Reed Light Meter ST-1301, REED Instruments, Newmarket, Ontario, Canada), while the UV treatment was a UV light, 7-W, 50- to 60-Hz LED light (CroLED, model: HZT-1101B-1130B; Shenzhen Huazhitai Technology Co., Shenzhen, Guangdong, China) with an intensity of ≈ 43 Lux (measured with an HDE Digital Lux Meter LX-1010 B, Shenzhen Huazhitai Technology Co., Shenzhen, Guangdong, China), and the dark treatment consisted of a piece of cardboard put over the hole. We measured light and UV intensities at the “ground level” of the fully assembled arenas.
Statistical analyses
We compared the movements of beetles in light versus dark and dark versus UV treatments. To analyse the path area, we ran an analysis of variance for mixed models, with blocking as a random factor (using the aov function in R 3.4.1; R Core Team 2013). We ran Fisher’s Exact Test (using the fisher.test function in R) to determine whether the classification of beetles’ movement patterns interacted with light treatments.
Results
Path area (cm2) did not differ significantly between light and dark treatments (Table 2). Light treatments and movement patterns interacted significantly (P-value = 0.0001). In all 10 dark arenas, the beetles showed movement pattern “B” (webbed), while in most of the light arenas, they showed pattern “A” (circular; see Tables 1 and 2 and Fig. 1).
Table 2: Frequency of Harpalus rufipes movement patterns and mean path area (± standard error) in the arenas of each light treatment at the end of the experiment.
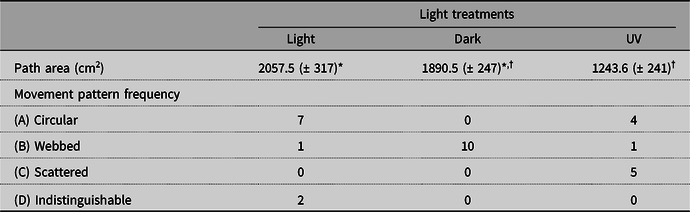
* Comparisons between light and dark: df = 1; error df = 9; F-value = 0.24; P = 0.63.
† Comparisons between UV and dark: treatment df = 1; error df = 9; F-value = 11.47; P = 0.008.
The beetles moved significantly more in the dark than in UV light (Table 2), and light treatments and movement patterns interacted significantly (P-value = 0.0001). In the 10 UV arenas, four groups of beetles showed pattern “A” (circular), and five showed pattern “C” (scattered), while in all 10 dark arenas, they showed pattern “B” (webbed; see Tables 1 and 2 and Fig. 1).
Discussion
Our method was successful at detecting differences both in path area and in movement patterns of beetles under the influence of different light treatments. All three treatments yielded considerably different movement patterns. All beetles in the dark treatment displayed pattern “B” (webbed), a more distributed movement pattern relative to other treatments. Meanwhile, the light treatment made the beetles circle the light sources. For the UV treatment, approximately half of the arenas showed pattern “A” (circular) and half showed pattern “C” (scattered), a pattern with little movement in the centre of the arena.
Biologically, our results are both expected and unexpected. For example, the similarity in path area between the dark and light treatments was unexpected, because H. rufipes is a night hunter (Luff Reference Luff1978). Many beetles respond to light by finding shelter in dark places (Griffiths et al. Reference Griffiths, Wratten and Vickerman1985; Allema et al. Reference Allema, Rossing, Van der Werf, Heusinkveld, Bukovinszky, Steingröver and Van Lenteren2012), but no shelters were provided for the beetles in the current experimental setup. The lack of shelters might explain why we were able to detect the light movement patterns, because, if they had been provided, the beetles would have probably sheltered and not crossed the fluorescent powder lines. This explanation is supported by Allema et al. (Reference Allema, Rossing, Van der Werf, Heusinkveld, Bukovinszky, Steingröver and Van Lenteren2012), who showed that Pterostichus melanarius (Illiger) (Coleoptera: Carabidae) moved less under white light than under near-infrared radiation when shelter was available. The majority occurrence of movement pattern “A” (circular) in the current experiment suggests that the beetles might have used the light to orient themselves in the arena, a phenomenon previously recorded across many insect taxa (Wehner Reference Wehner1984; Colombini et al. Reference Colombini, Chelazzi and Scapini1994) but never before for H. rufipes. On the other hand, beetles in every dark arena showed movement pattern “B” (webbed), which resembles the correlated random walk, a pattern of movement carabids are expected to showcase when hunting (Mols Reference Mols1979; Kareiva and Shigesada Reference Kareiva and Shigesada1983). Under UV light, beetles moved less than those under the dark treatment, possibly because they were deterred by the UV light (negative phototaxis), a behaviour that has been observed in many organisms, including carabid beetles and water fleas (Cladocera: Daphniidae) (Storz and Paul Reference Storz and Paul1998; Andersen Reference Andersen2006). Again, if the beetles had had somewhere to hide, we might have not been able to detect these patterns at all.
To increase the reproducibility of our method, there are a few things to take into consideration. In order to capture behaviours that are closer to what would happen in the wild, depending on the taxa being studied, adding some form of shelter to the arena might be useful. Testing to ensure the powder does not affect your taxon is also recommended. In our case, the effect of the powder was undetectable, given that all three treatments had the powder and yet yielded significantly different results.
Most advances in insect-movement methodologies have occurred for field experiments (Jones et al. Reference Jones, Hagler, Brunner, Baker and Wilburn2006; Kissling et al. Reference Kissling, Pattemore and Hagen2014; Perry et al. Reference Perry, Wallin, Wenzel and Herms2017; Rossetti et al. Reference Rossetti, Dynes, Brosi, de Roode and Kong2018), while relatively little has been done concerning laboratory techniques. Our method is relatively inexpensive (Lavandero et al. Reference Lavandero, Wratten, Hagler and Jervis2004) and can be used to answer questions about other terrestrial insects and the effects various factors may have on their movements in a laboratory setting. For example, one could treat the arthropods in question with varying concentrations of pesticides or with different diets and then compare how these affect the movement patterns and path areas. This method will allow researchers who do not have access to much funding to study insect movement in the laboratory with little material investment.
Acknowledgements
We thank the summer students of the Cutler Entomology Laboratory (Emily Vance, Robyn Slater, and Alec McOnie) and the National Sciences and Engineering Research Council of Canada (Discovery Grant RGPIN-2015-05201).


