


Introduction
Relatedness among potential helpers and the individuals that will benefit from that help is one of the key factors influencing cooperation in group-living animals (Hamilton Reference Hamilton1964; Trivers and Hare Reference Trivers and Hare1976; Rubenstein and Abbot Reference Rubenstein and Abbot2017). At the most basic level, relatedness within groups is a function of the number of mothers and fathers that produced the group: the more parents that contribute to a group, the lower the relatedness among their offspring. The number of parents contributing to a group is, in turn, influenced by both the social system and the mating system. Groups can be produced by a single female mated to a single male (highest relatedness among offspring), a single female mated to multiple males, multiple females each mated to a single male, or multiple females each mated to multiple males (lowest relatedness among offspring).
In insects, links between female mating frequency and group living have frequently been studied in eusocial Hymenoptera because maternal monogyny promotes high relatedness among workers and the brood they raise, whereas maternal polyandry dilutes relatedness (Hamilton Reference Hamilton1964; Trivers and Hare Reference Trivers and Hare1976). A phylogenetic analysis focused mainly on ants, but also including bees and wasps, suggested that in Hymenoptera as a whole, single mating by queens favoured evolutionary transitions from solitary to eusocial colony organisation (Hughes et al. Reference Hughes, Oldroyd, Beekman and Ratnieks2008). In line with this result, it is frequently presumed that in solitary bees, whose behaviour represents a condition ancestral to various forms of sociality, females generally mate only once (Danforth et al. Reference Danforth, Minckley, Neff and Fawcett2019), thus producing closely related offspring. Yet the few available estimates of female mating frequencies for solitary bees suggest that in four of nine solitary species (representing four of seven genera), females may be polyandrous (Supplementary material, Table S1). This suggests that single mating may be less frequent among solitary bees than is generally presumed. Multiple mating is also known to occur in (primitively) eusocial sweat bees, although estimates are available for only a handful of species (Supplementary material, Table S1). Nevertheless, available evidence clearly demonstrates that eusocial behaviour is not dependent on single mating by queens, although evolutionary transitions from solitary to eusocial behaviour probably are more likely in solitary lineages with singly mating females (Hughes et al. Reference Hughes, Oldroyd, Beekman and Ratnieks2008).
While eusociality is the best-known form of insect sociality, cooperation and group-nesting also occur in non-eusocial species. In facultatively social carpenter bees and orchid bees, adult females of the same generation nest together, sometimes exhibiting cooperative nest defense and reproductive division of labour (Hogendoorn and Velthuis Reference Hogendoorn and Velthuis1999; Cameron Reference Cameron2004; Ostwald et al. Reference Ostwald, Dahan, Shaffer and Fewell2021). One such species is the eastern carpenter bee, Xylocopa virginica (Hymenoptera: Apidae); females usually nest in small groups in which a primary female does the majority of foraging and egg-laying, while secondary females queue for reproductive opportunities that arise when a primary female dies or disappears (Richards Reference Richards2011; Richards and Course Reference Richards and Course2015; Vickruck and Richards Reference Vickruck and Richards2018). Because many primary females die before the breeding season ends (Richards Reference Richards2011), brood in many nests are produced by two or more adult females, a phenomenon known as sequential maternity. This behaviour results in low relatedness among natal nestmates in winter (r = 0.35). Within-group relatedness declines even further in spring, to about 0.09–0.24, because many females leave their natal nests to join breeding groups or to found their own nests (Peso and Richards Reference Peso and Richards2011; Richards and Course Reference Richards and Course2015; Vickruck and Richards Reference Vickruck and Richards2021).
In this paper, we investigate whether multiple paternity, which would occur if egg-laying females mate multiple times, might be an additional factor contributing to low relatedness among female nestmates. We used two approaches to estimate female mating frequency. First, we used visual observations of mating behaviour collected while observing bees near nest entrances; we used these to estimate mating frequencies and to evaluate evidence for temporal variation in female receptivity to males. Second, we used a large data set of microsatellite genotypes collected over seven years to evaluate evidence for multiple paternity based on inferred proportions of full- and half-sister sibships.
Methods
Field sites and phenology in southern Ontario, Canada
We studied several aggregations of eastern carpenter bees nesting in six wooden bridges at the Glenridge Quarry Naturalization Site, in St. Catharines, Ontario, Canada (43.1° N, 79.2° W). Each bridge was approximately 4.5 m long and 2.2 m wide and contained from 3 to 34 nests. Bridges were 30–60 cm above the ground, and nest entrances were located on the underside of each bridge. Three bridges with smaller aggregations were located within 50 m of one another, whereas the other three bridges, which contained larger aggregations, were located at least 300 m apart.
At our study sites, the flight season is divided into three phases. The first phase begins in mid-April to mid-May, depending on local weather conditions. Males emerge first from hibernation in their natal nests; they guard territories directly in front of nest entrances, pouncing on females as they depart from or arrive at their nest entrances. Matings also occur at other sites, such as in flower patches, but we observed matings only near nest entrances. Some males also establish territories near other landmarks and in floral patches where females may forage.
The second phase of the flight season begins several days to a couple weeks after most males have emerged, when females also emerge from their nests. Phase 2 is referred to as the nestmate provisioning phase because foragers feed adult female nestmates during this time, rather than provisioning brood. Phase 3, the brood provisioning phase, generally begins in late May or early June, when females begin provisioning brood cells.
Observation methods
Cup traps were used to catch bees leaving and entering nests in order to mark bees and track foraging behaviour (Peso and Richards Reference Peso and Richards2010). Traps consisted of plastic cups with a 1- to 2-cm hole cut in the base and with cellophane held in place with an elastic band to cover the top (Fig. 1). The cups were then placed over nest entrances and secured in place with velcro, and modelling clay was used to seal gaps around the base of each cup to prevent bees from escaping. Traps were set up upon arrival at a study site each morning (09:00 hours, local time) and were removed at the end of the day (17:00 hours). Cup traps were attached to the nest entrances at five aggregations in 2012 and 2013, at two in 2016, at five in 2017, and at six from 2018 to 2021.

Fig. 1. Cup trap used to capture bees arriving and departing from nest entrances: A, each cup has a hole cut in the base, two strips of Velcro on the base, and an elastic band and cellophane to cover the open side of the cup; B, cups were attached over each nest entrance.
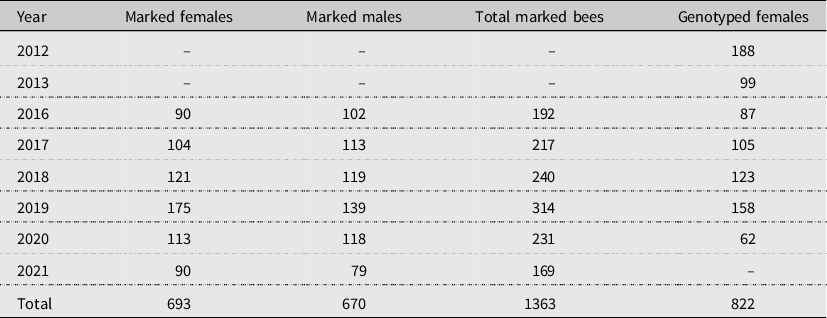
When a bee was first captured, its nest of origin and sex were recorded. Bees were also caught and marked flying near the aggregations, where their nests of origin were unknown. Collected bees were placed on crushed ice in a cooler to arrest their movements. After cooling, the left mesothoracic tarsus of each bee was removed and immersed in 0.5 mL of distilled 100% ethanol in a 1.5-mL microfuge tube. Tarsi were stored on ice until the end of each observation day before being transferred to a –80 °C freezer for eventual DNA extraction and microsatellite genotyping. Each bee was then marked with a unique tri-colour combination using enamel model paints. Paints were deposited on the bee’s thorax between the tegulae and on the head between the ocelli using a plastic pipette. After a bee was marked, it was placed back into the nest entrance from which it had departed, or it was released near the aggregation if it was caught by net. If paint wore off a bee, it was recaptured and remarked. The numbers of bees captured and marked each year are presented in Table 1.
Table 1. Sample sizes for inferring copulation frequencies using field observations and microsatellite genotyping. Visual observations of individually marked bees were based on field work carried out from 2016 to 2021. Genotype analyses were carried out for females collected in 2012, 2013, and 2016–2020.
Observations of mating behaviour
Attempted and successful copulations were recorded as part of more intensive observations of female foraging effort and male territoriality from 2016 to 2021. Observations at one aggregation per day were carried out by one person from 09:00 to 17:00 hours on sunny days without rain. Whenever copulations were noticed over the course of daily behavioural observations, they were recorded. Based on visual observations, we calculated mating frequency as the harmonic mean number of observed copulations (both complete and incomplete) per bee. Visual observations of matings around nesting aggregations underestimate actual mating frequencies because not all sites were observed each day, and copulations likely also occur away from nest sites.
To evaluate female receptivity, we distinguished between complete and incomplete copulations, presuming that copulations were less likely to be completed when females were less receptive. A complete copulation was recorded when a male mounted a female by grabbing her thorax from above with his legs, followed by abdominal thrusting with the male’s front legs on the female’s thorax. Mating pairs either landed on the ground or flew high into the air while in copula, often out of the observer’s view. An incomplete copulation was recorded when a female dislodged a male before abdominal thrusting occurred. Incomplete copulations either ended quickly or were followed by a sequence of male–female interactions for an extended period of time. For example, after dislodging a male, a female sometimes turned in flight and extended her legs out to the side, then flew towards the male, moving from side to side, while the male flew backwards and matched her movements. Males usually flew slightly higher off the ground than females during this type of interaction, maintaining their distance until females turned away, after which males either pursued females again or flew away. After some complete or incomplete copulations, females landed on the ground, and males hovered nearby. Males that hovered near landed females rarely attempted to mount females on the ground. An example of this type of mate-guarding behaviour can be seen at https://youtu.be/4TBJOBfwjuA.
DNA extraction and microsatellite genotyping
Chelex 100 Resin (Bio-Rad Laboratories, Hercules, California, United States of America) was used to extract DNA from tarsal samples following protocols described by Casquet et al. (Reference Casquet, Thebaud and Gillespie2012). Ethanol was removed from each tube by drying the template for 4–6 hours in a 45 °C incubator. Following the incubation step, we added 150 µL of 10% Chelex Resin solution (1.5 g Chelex 100 Resin and 15 mL Milli-Q water) and 10 µL of Proteinase K (Qiagen®, Hilden, Germany) to each microfuge tube. The tubes were then placed in a thermoshaker at 55 °C and 400 rpm for 6–8 hours. Following incubation, DNA templates were either stored at 4 °C for samples to be amplified the same week or at –80 °C for samples to be amplified later.
Genomic DNA was amplified at 16 previously described microsatellite loci (Vickruck Reference Vickruck2015). Bees previously collected in 2012 and 2013 were genotyped at nine loci: XV3, XV7, XV23, XV24, XV27, XV30, XV39, XV42, and XV43 (Vickruck Reference Vickruck2015; Vickruck and Richards Reference Vickruck and Richards2021). Bees from 2016 were genotyped at eight of these same loci, excluding XV23. Bees from 2017 to 2020 were sequenced at 16 loci, the nine listed above, plus XV1, XV9, XV10, XV12, XV14, XV28, and XV29 (Vickruck Reference Vickruck2015). Each DNA sample was amplified with a 15-µL polymerase chain reaction using 40–70 ng of DNA, 0.5 units of Taq DNA polymerase (New England Biolabs, Ipswich, Massachusetts, United States of America), 1× Thermobuffer (New England Biolabs), 0.2 mM dNTPs, 0.2 µM forward primer, and 0.2 µM reverse primer. Each forward primer contained a poly-A fluorophore, 56-FAM, or HEX. The polymerase chain reaction conditions were 95 °C for 3 minutes, 40 cycles of 94 °C for 30 seconds, 60 °C for 30 seconds, and 72 °C for 30 seconds, and then a final extension of 72 °C for 300 seconds. Electrophoresis of each polymerase chain reaction product was conducted using an ABI 3730×l analyser (Applied Biosystems Corporation, Thermo Fisher Scientific, Waltham, Massachusetts) at the Peter Gilgan Centre for Research and Learning Genetic Analysis Facility (Hospital for Sick Children, Toronto, Ontario, Canada). Each run contained positive and no-template controls for each locus to account for variation between reactions. Alleles were called manually by A. Proulx using the free software, Applied Biosystems Microsatellite Analysis Software (MSA by Thermo Fisher Scientific). The numbers of female bees genotyped each year are presented in Table 1.
Inferring female mating frequencies from microsatellite genotypes
A singly mated (monandrous) female produces daughters that are all full sisters, whereas a multiply mated (polyandrous) female produces daughters that can be a mix of full and half sisters. Therefore, the proportions of monandrous and polyandrous females in the population each year can be inferred from the proportions of full sibships and maternal half sibships among genotyped females.
We used COLONY, version 2.0.6.4 (Jones and Wang Reference Jones and Wang2010), to identify probable full and half sisters from three different data subsets, based on the 9, 8, or 16-locus genotypes described above (Table 2). Because female eastern carpenter bees can overwinter twice (Richards and Course Reference Richards and Course2015), sisters may be collected in consecutive years. We therefore included females collected in multiple years in the input data for COLONY but then excluded predicted relationships that were three or more years apart. Each data subset was run five times using different starting seeds in order to detect all possible sibling relationships. Sibships were inferred using the full-likelihood method in COLONY, based on the following assumptions: random mating, possibly polygamous male and female parents, haploid males, and diploid females. We used a medium-length run with medium likelihood precision, with run specifications and sibship priors set to default values, an initial allele mistyping rate of 0.0001, and an initial allelic dropout rate set to 0.0001 for each locus.
Table 2. Three different data subsets were used for COLONY assignment analyses. The first and second subsets used different numbers of females using the same number of loci, whereas the second and third subsets consisted of the exact same females with different numbers of loci. Genotyped females with fewer than six loci (subsets 1 and 2) or 12 loci (subset 3) were excluded from analyses.

COLONY produces a list all possible pairs (dyads) of full sisters, maternal half sisters (same mother, two different fathers), and paternal half sisters (same father, two different mothers) with likelihoods of 0.1 or greater. We focused on dyads with a likelihood of 0.7 or greater and of 0.8 or greater. We then assembled the dyads into larger sibships, represented by short networks (Fig. 2). No paternal half-sister dyads reached the likelihood thresholds of 0.7 or 0.8, so we analysed only maternal sibships and could not estimate male mating frequencies. Because all high-likelihood dyads represented maternal siblings, we made the simplifying assumption that sibships were the offspring of a single mother. We also assumed that sibships could extend across two consecutive years because some females overwinter twice, but we excluded three-year sibships from consideration.
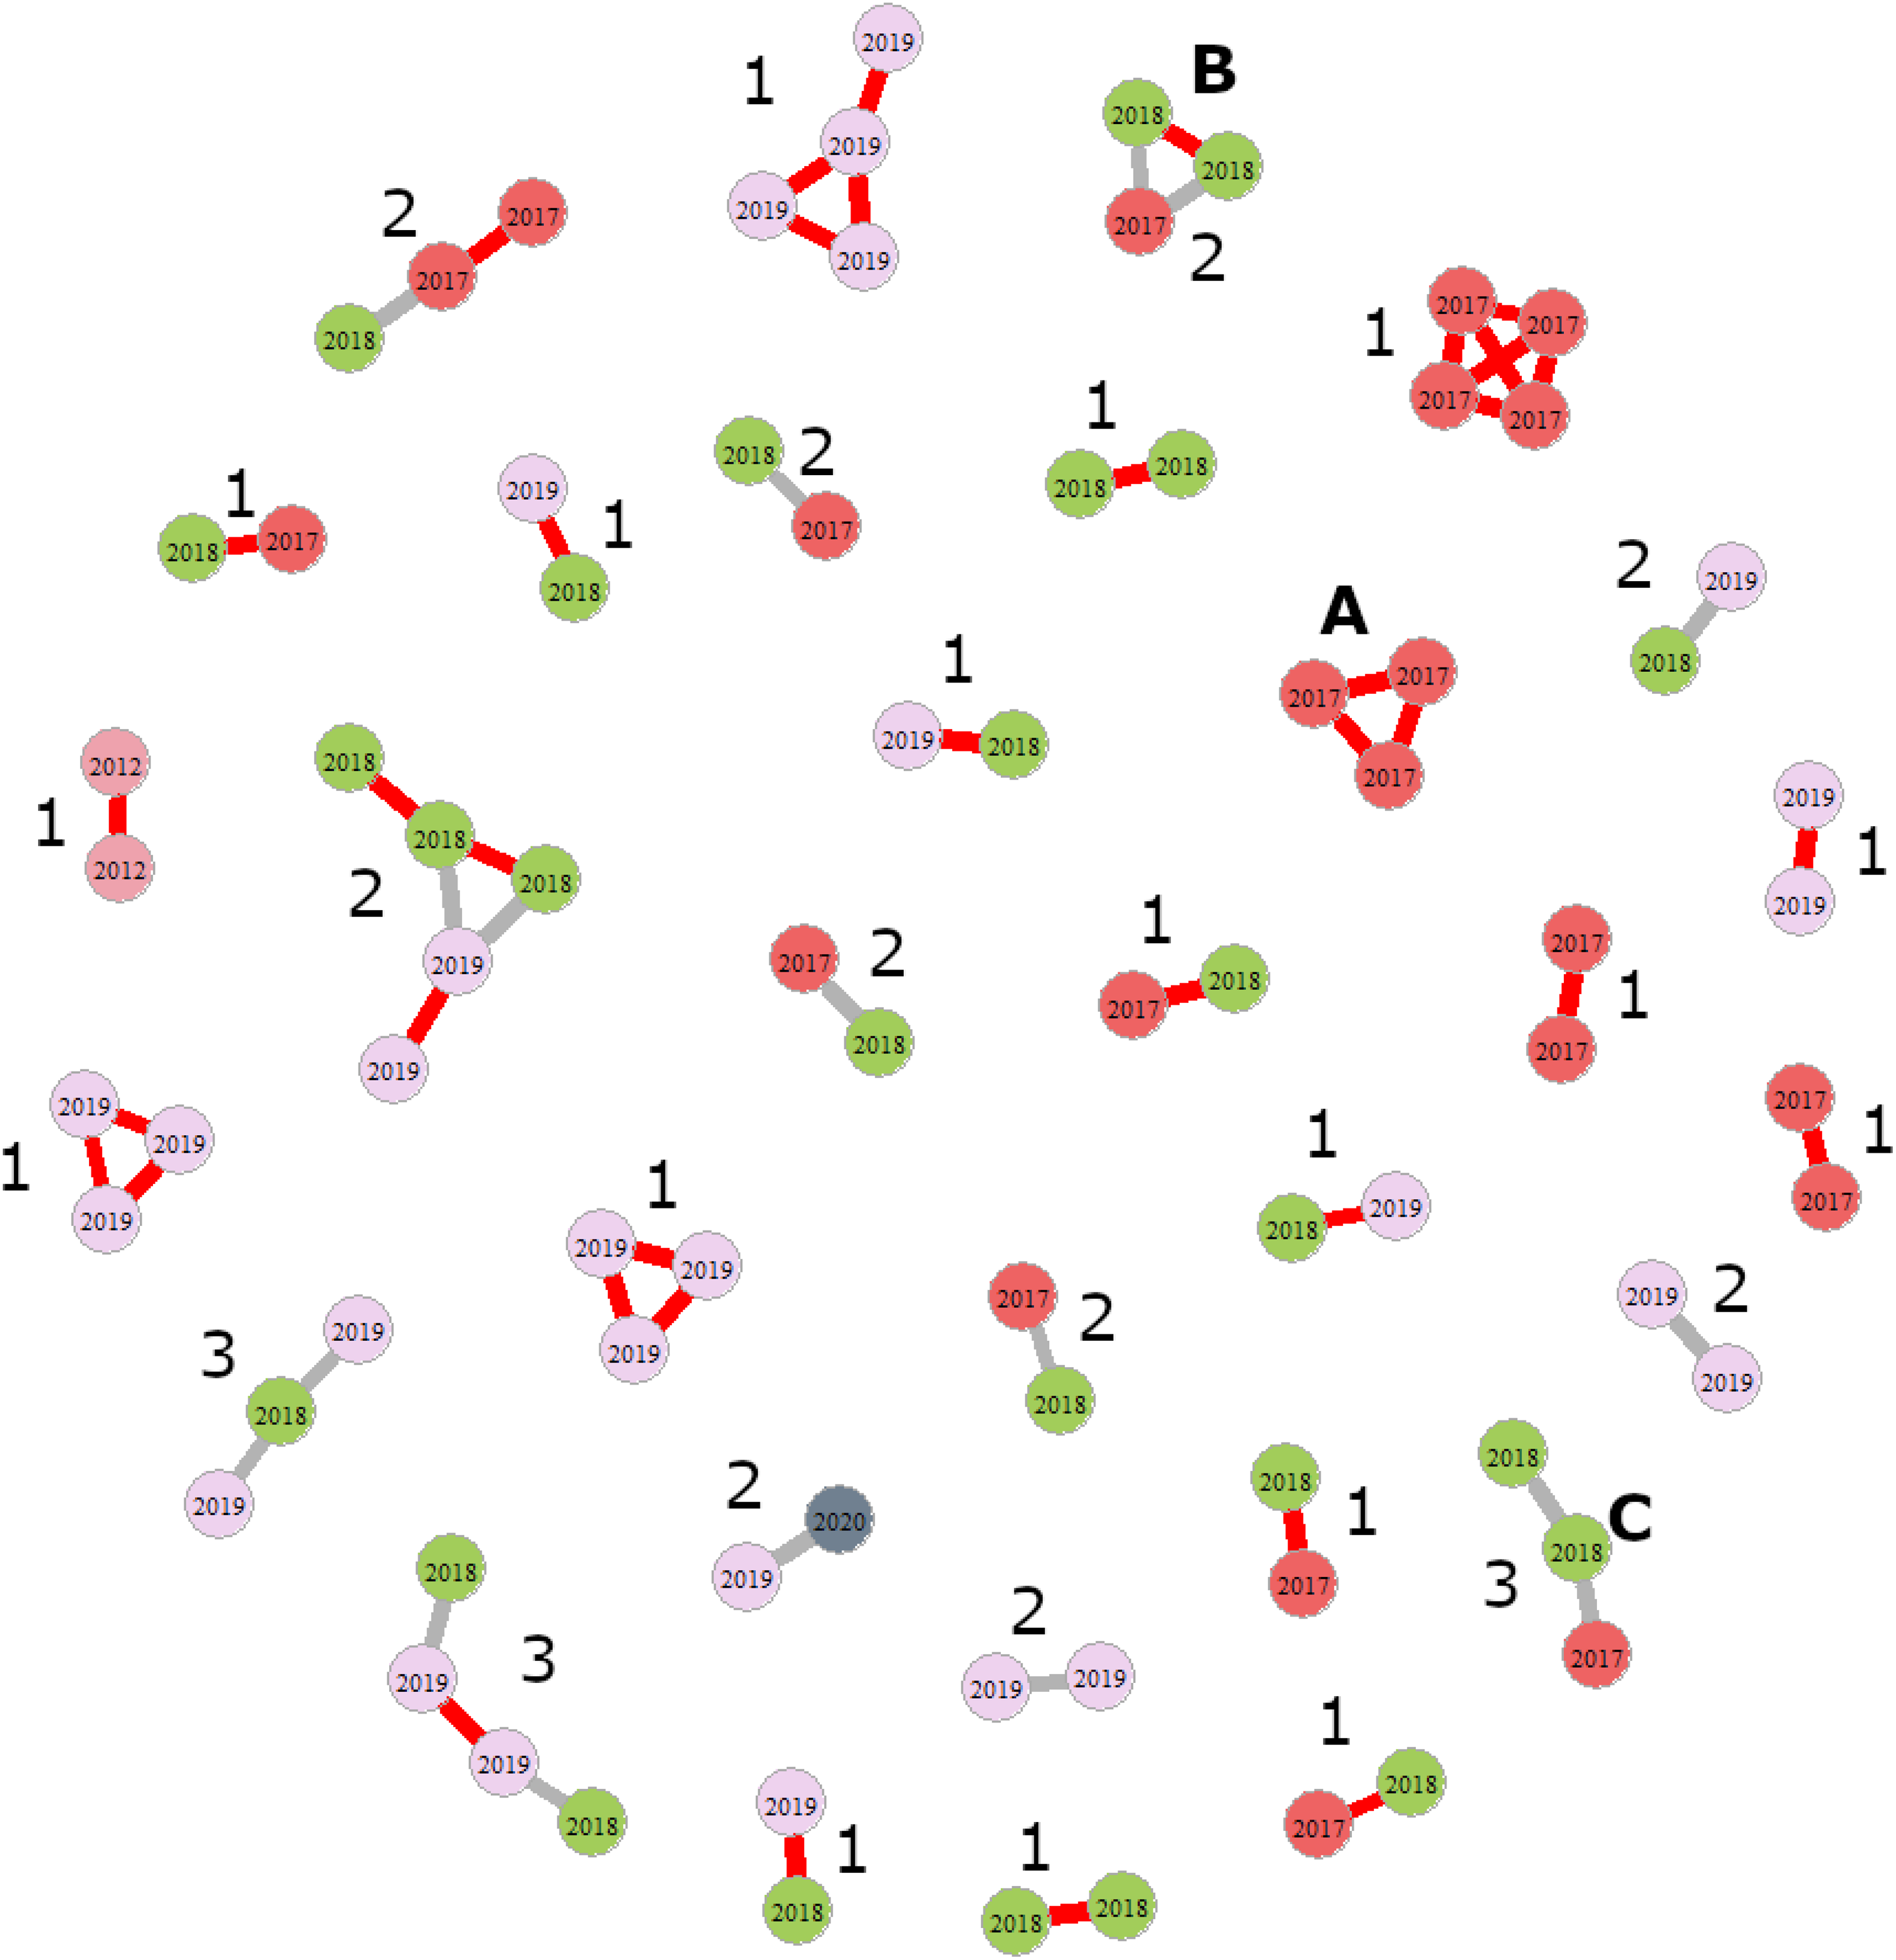
Fig. 2. Diagram illustrating how full- and half-sister sibships were counted for one run of COLONY based on data subset 3. Nodes (circles) represent individual females, with colours representing the year in which they were collected. Full sisters are linked by red lines and half sisters are linked by gray lines. In total, there are 19 full-sister and 13 half-sister sibships (the latter may contain a mix of full and half sisters). A is a fully Euclidean, full-sister sibship, B is a fully Euclidean, half-sister sibship, and C is a non-Euclidean half-sister sibship. Numbers beside each sibship indicate the most likely number of fathers, given the assumption that each sibship was produced by a single mother.
To illustrate how dyads were assembled into sibling networks such as those depicted in Figure 2, we considered several examples. In the first example, COLONY predicts three full-sister dyads: females A and B, B and C, and A and C. Because each female is the full sister of the other two females (relatedness among siblings is fully Euclidean), these three dyads can be collapsed into a single, full-sister sibship, such as that illustrated in Figure 2A, representing the daughters of one mother mated to one father. Likewise, if COLONY predicts a full-sister dyad for females D and E and two half-sister dyads for females D and F and females E and F, then these three dyads can be collapsed in a single sibship with two full sisters and one half sister, such as that illustrated in Figure 2B. Some predicted sibships are not fully Euclidean. Consider the situation in which COLONY predicts a full-sister dyad (G and H) and one half-sister dyad (G and I). These would be assembled into a non-Euclidean sibship such as that illustrated in Figure 2C. Inferring the number of fathers in Euclidean networks is straightforward; full-sister networks represent the offspring of a single mother and a single father (Fig. 2A), whereas half sisters represent the offspring of a single mother and two or more fathers (Fig. 2B). Inferring the number of fathers in non-Euclidean sibships is more challenging because we cannot always distinguish multiple maternity from multiple paternity. To solve this conundrum, we assumed that sibships were the offspring of a single mother because COLONY failed to predict any paternal half-sister dyads with a likelihood greater than 0.7 or greater than 0.8 in any data subset. For a sibship such as that shown in Figure 2C, this would suggest a single mother and two fathers. If this assumption were violated, the effect would be to overestimate the numbers of fathers (i.e., the number of times a mother mated). We used the networks to count full-sister versus half-sister networks (half-sister networks comprised a mix of full- and half-sister relationships) and then inferred the most likely number of fathers for each sibship. We then calculated the harmonic mean number of fathers per sibship as our measure of female mating frequency.
Additional analyses
Network visualisations and statistical analyses were performed in R, version 4.1.2, running under the R-Studio shell, version 1.1.383 (R Core Team 2022; RStudio Team 2022). We used the igraph package to assemble dyads into networks by designating individual bees as network nodes and their relationships as network edges. Chi-square tests were used to compare female and male mating frequencies and how the proportions of complete and incomplete copulations differed across foraging phases.
Results
Mating frequencies of females and males inferred from field observations
From 2016 to 2021, 85 females and 66 males were observed in a total of 121 copulation attempts, of which 44 (36.4%) resulted in complete copulation and 77 (63.6%) resulted in incomplete copulation. Most females were observed copulating with only one male, but three females were observed mating with two males and one female had three mates (Table 3). Three of the multiply mated females were observed mating with different males on the same day. The fourth multiply mated female was observed first in an incomplete copulation then in two complete copulations with two different males on different days. One pair was observed in two complete copulations on the same day. Males observed in copulations were more likely than females to have multiple mates (Table 3).
Table 3. Numbers of mates for individually marked females and males based on field observations from 2016 to 2021. In total, 44 copulations were observed. We pooled the numbers of mates equal to two and three, creating a 2 × 2 contingency table. We ran a chi-square test of homogeneity with a Yates continuity correction on the 2 × 2 contingency table. Proportionately, more males were likely to be involved with multiple mates. P-value in bold is significant.

Complete copulations were observed more often during the nestmate provisioning phase than during the brood provisioning phase (Table 4). Thus, females appeared to be more receptive during the nestmate provisioning phase and less receptive later during the brood provisioning phase.
Table 4. The numbers of complete and incomplete copulations in early (nestmate provisioning) and late (brood provisioning) phases of the colony cycle, from 2016 to 2021. Complete copulations were more frequent during the nestmate provisioning phase than the brood provisioning phase (χ 2 test of homogeneity with Yates continuity correction). P-value in bold is significant.

Genotypic evidence for single and multiple mating by females
We analysed three data subsets each, using five separate runs of COLONY; the network of full and maternal half sibships inferred from a single run of COLONY with 12–16 loci and a likelihood threshold of 0.7 is provided as an example in Figure 2. The proportions of full- and maternal half-sister sibships were strongly influenced by the number of loci on which the calculations were based (Table 5; Supplementary material, Table S2). Regardless of the number of females, the number of loci used in each analysis, or the likelihood threshold, the evidence suggests a mix of single and multiple mating. The best estimates likely are those based on more loci, which suggested that approximately equal numbers of full- and maternal half-sister sibships occurred from 2017 to 2020. This in turn implies that half of the mothers of these sibships were singly mated and half were multiply mated, which resulted in inferred mating frequencies that ranged from 1.25 to 1.41 at a likelihood threshold of 0.7 and from 1.13 to 1.21 at a likelihood threshold of 0.8 for data subset 3.
Table 5. A comparison of the relative proportions of full-sister and maternal half-sister sibships based on three subsets of genotype data. The numbers in parentheses are the mean and standard deviation of the number of dyads that were full- or half-sister sibships using a likelihood threshold of greater than 0.7 or greater than 0.8. For each subset, five runs of COLONY with different starting seeds were used to generate the average proportions of full- and half-sister sibships. Data subsets are described in Table 2. Data from each run of COLONY are described in Supplementary material, Table S1. Values in bold are proportions.

Discussion
Evidence for multiple mating by females of the eastern carpenter bee
In our study, both behavioural and genetic evidence suggested that female Xylocopa virginica are facultatively polyandrous. Behavioural observations suggested that more than 90% of females mated with a single male, whereas fewer than 10% mated with 2–3 males. However, the genetic evidence demonstrates that multiple mating was common: estimates based on 12–16 genotype loci indicate that about one-quarter to one-half of all mothers mated multiple times. Clearly, reliance on behavioural observations led to a significant underestimate of female mating frequency. Facultative polyandry and moderate levels of polyandry have also been observed in the small carpenter bees (Ceratina spp.) (Shell and Rehan Reference Shell and Rehan2018; Mikát et al. Reference Mikát, Janošík, Černá, Matouškováa, Hadravaa, Bureša and Strakaa2019). In fact, females of many bee species have the capacity to mate with multiple males, as evidenced by mating frequencies greater than one (Supplementary material, Table S1).
We observed a greater proportion of complete copulations early in the colony cycle, during the nestmate provision phase, than later in the colony cycle, during the brood provisioning phase. This temporal pattern suggests that females are more receptive to males’ copulation attempts during the nestmate provisioning phase and that, with the onset of the brood provisioning phase, females become less receptive to mating. In solitary bee species, females are usually sexually receptive to males for a short period of time early in adulthood (Paxton Reference Paxton2005; Danforth et al. Reference Danforth, Minckley, Neff and Fawcett2019). Although this may be true in X. virginica, a decline in female receptivity could also suggest female mate choice. In spring, X. virginica males emerge from nests and begin guarding territories several weeks before peak female emergence (Skandalis et al. Reference Skandalis, Richards, Sformo and Tattersall2011). Large males tend to dominate early in the season, and small males may gain territories only later (L. Corbin, L. Duff, and M. Richards, unpublished data). To the extent that large size is in an indicator of male quality, this would suggest that male quality is higher during the nestmate provisioning period than later, during the brood provisioning period. Thus, a temporal decline in female receptivity may be a reaction to a temporal decline in average male quality.
We observed two types of male mating behaviour that may increase a male’s chance that the female with which he has just mated will actually use his sperm. In some complete copulations, males grab females and the pair fly high into the air while in copula, which may help to remove females from the vicinity of competing males. We also occasionally observed mate-guarding, with males hovering near females after copulation, sometimes chasing other males away. That males try to prevent females from mating with other males is indirect evidence that female carpenter bees frequently copulate with multiple males.
Undoubtedly, multiple mating by egg-laying females would act to lower nestmate relatedness in social groups of eastern carpenter bees. Although oviposition in social nests may be monopolised by a single dominant female, in many nests the dominant egg-layer is eventually superseded by secondary egg-layers, so multiple maternity occurs in many colonies. The combination of multiple maternity, frequent female polyandry, and relocations of females away from their natal nests undoubtedly explains low relatedness and the prevalence of non-kin-based sociality in eastern carpenter bees. Another carpenter bee species, X. sonorina, also exhibits fluid group social structure with low nestmate relatedness; perhaps multiple mating is frequent in this species too (Ostwald et al. Reference Ostwald, Dahan, Shaffer and Fewell2021).
Conclusions
Our study demonstrates that despite years of observations of marked individuals, it is difficult to assess mating frequencies in the field because copulations are rarely observed. Our study demonstrates that estimates of polyandry can be much higher when larger numbers of highly polymorphic loci are used to analyse familial relationships. This suggests that many bees, both solitary and social, may be considerably more polyandrous than is currently presumed. Genotyping more solitary, communal, and non-kin social species populations might reveal more instances of multiple mating and contribute to our understanding of these systems.
Supplementary material
To view supplementary material for this article, please visit https://doi.org/10.4039/tce.2022.51.
Acknowledgements
This research was funded by a Natural Sciences and Engineering Research Council (NSERC) of Canada Discovery Grant to M.H.R. and an NSERC Postgraduate Scholarship to L.D., and by internal funding sources from Brock University. The authors thank the Niagara Region for access to field sites, even amid a global pandemic, and members of the Brock Bee Lab for their helpful comments on the manuscript.
Statements and declarations
The authors declare that they have no conflicts of interest.


 Open access