


Impact statement
Tropical cyclones (TCs) cause severe coastal flooding in the middle latitudes. Hurricane Katrina in 2004, which made landfall in Louisiana, caused more than 1,800 people dead or missing and caused USD 108 billion in economic damage. Typhoon Haiyan hit the Philippines in 2014, leaving 8,123 people dead or missing. The main cause of these events was the storm surge caused by the TCs. TC intensity will be expected to increase due to climate change by global warming. TC intensity and the other TC characteristics are linked to future changes in extreme storm surges and wave climates in middle latitudes. Therefore, it is important to estimate future long-term changes in extreme water levels, the contribution of increased storm surges, and wave height for coastal hazard mitigation. In addition, finding a hot spot with large changes in hazard levels and adaptation strategies is important for designing a safer coastal region.
Future changes in sea-level rise and tropical cyclones for coastal hazard assessment
Storm surges, ocean waves, and tsunamis are the major external force for coastal regions. Of these, storm surges and ocean waves are affected by climate change due to global warming (denotes climate change, hereafter). Therefore, in the following in this article, these are referred to as coastal hazards, and the effects of climate change on coastal flooding, especially due to future changes in tropical cyclones (TCs), are outlined. While other coastal hazards such as coastal erosion, delta subsidence, and saltwater intrusion can be listed, TCs-induced coastal forces, storm surges, and ocean waves are focused.
Future sea-level rise (SLR) associated with global warming will directly influence coastal hazards. The SLR projections have been made under future scenarios assuming the future increase in greenhouse gas (GHG) concentration (e.g., Church and White, Reference Church and White2006; Hermans et al., Reference Hermans, Gregory, Palmer, Ringer, Katsman and Slangen2021). The latest global average SLR projections are compiled in the IPCC AR6 WGI (Fox-Kemper et al., Reference Fox-Kemper, Hewitt, Xiao, Aðalgeirsdóttir, Drijfhout, Edwards, Golledge, Hemer, Kopp, Krinner, Mix, Notz, Nowicki, Nurhati, Ruiz, Sallée, Slangen, Yu, Masson-Delmotte, Zhai, Pirani, Connors, Péan, Berger, Caud, Chen, Goldfarb, Gomis, Huang, Leitzell, Lonnoy, Matthews, Maycock, Waterfield, Yelekçi, Yu and Zhou2021) for different levels of GHG concentration scenarios. It is summarized as 0.44 m for SSP126, which is the low GHG concentration scenario expecting the +2 K global temperature warming (projection range 0.32–0.62 m), and 0.77 m for SSP585, the high concentration scenario expecting +4 K warming (projection range 0.63–1.01 m) at the year 2100 from the baseline period of 1995–2014. Unlike temperature, SLR has a long time scale over the decades. Therefore, the projected SLR will continuously increase after 2100, even with substantial reductions in GHG emissions. Therefore, it is inevitable to consider the impact of SLR in coastal conservation planning, which has decades to century time scale. The IPCC AR6 WGII (Chapter 3; Cooley et al., Reference Cooley, Schoeman, Bopp, Boyd, Donner, Ito, Kiessling, Martinetto, Ojea, Racault, Rost, Skern-Mauritzen, Pörtner, Roberts, Tignor, Poloczanska, Mintenbeck, Alegría, Craig, Langsdorf, Löschke, Möller, Okem and Rama2022) has called for the design of coastal protection facilities and coastal urban planning to take SLR into account in the field of coastal engineering to promote climate change adaptation measures. For this purpose, it is a major scientific challenge to know the long-term sea level at the coast of each region in addition to the global average.
Long-term changes in the climate system (climate change and climate variability) are projected to affect not only temperature increase and SLR, but also various climatic and meteorological phenomena. For coastal hazards, the most important projected future changes in climate are TC and extratropical cyclone (ETC). Climate change is expected to affect sea surface temperature rise, atmospheric stability, and atmospheric circulation fields, which are important for developing cyclones. Therefore, climate change can affect the intensity and frequency of cyclones. IPCC AR6 WGI Chapter 11 “Weather and extreme climate events in a changing climate” (Seneviratne et al., Reference Seneviratne, Zhang, Adnan, Badi, Dereczynski, Di Luca, Ghosh, Iskandar, Kossin, Lewis, Otto, Pinto, Satoh, Vicente-Serrano, Wehner, Zhou, Masson-Delmotte, Zhai, Pirani, Connors, Péan, Berger, Caud, Chen, Goldfarb, Gomis, Huang, Leitzell, Lonnoy, Matthews, Maycock, Waterfield, Yelekçi, Yu and Zhou2021) summarized the cyclone characteristics, but we here focus on their impacts on the coast.
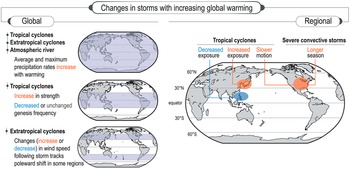
For the coastal hazards, TC intensity, frequency, and track changes are linked to future changes in extreme storm surges and wave climates in middle latitudes. Global warming is expected to affect the characteristics of TCs, such as frequency, intensity, and tracks. The IPCC AR6 WGI (Seneviratne et al., Reference Seneviratne, Zhang, Adnan, Badi, Dereczynski, Di Luca, Ghosh, Iskandar, Kossin, Lewis, Otto, Pinto, Satoh, Vicente-Serrano, Wehner, Zhou, Masson-Delmotte, Zhai, Pirani, Connors, Péan, Berger, Caud, Chen, Goldfarb, Gomis, Huang, Leitzell, Lonnoy, Matthews, Maycock, Waterfield, Yelekçi, Yu and Zhou2021), as well as the Special Report on the Ocean and Cryosphere (SROCC; Pörtner et al., Reference Pörtner, Roberts, Masson-Delmotte, Zhai, Tignor, Poloczanska and Weyer2019), summarized that the number of TCs generated in the future will be fewer overall, but the intensities will be stronger on a global scale. In addition, the ratio of intense TC (categories 4–5) is expected to increase from the current climate condition because of climate change (e.g., Emanuel, Reference Emanuel2013; Yoshida et al., Reference Yoshida, Sugi, Mizuta, Murakami and Ishii2017; Seneviratne et al., Reference Seneviratne, Zhang, Adnan, Badi, Dereczynski, Di Luca, Ghosh, Iskandar, Kossin, Lewis, Otto, Pinto, Satoh, Vicente-Serrano, Wehner, Zhou, Masson-Delmotte, Zhai, Pirani, Connors, Péan, Berger, Caud, Chen, Goldfarb, Gomis, Huang, Leitzell, Lonnoy, Matthews, Maycock, Waterfield, Yelekçi, Yu and Zhou2021). Figure 1 shows a schematic view of past and projected changes in TC and ETC by IPCC AR6 WGI (Seneviratne et al., Reference Seneviratne, Zhang, Adnan, Badi, Dereczynski, Di Luca, Ghosh, Iskandar, Kossin, Lewis, Otto, Pinto, Satoh, Vicente-Serrano, Wehner, Zhou, Masson-Delmotte, Zhai, Pirani, Connors, Péan, Berger, Caud, Chen, Goldfarb, Gomis, Huang, Leitzell, Lonnoy, Matthews, Maycock, Waterfield, Yelekçi, Yu and Zhou2021). However, historical and future changes in TC characteristics, such as frequency and intensity, are still quantitatively uncertain on regional and global scales. Especially the extreme value distribution of the TC intensity is important for coastal hazard assessment. Difficulty in estimating “historical” change and maximum intensity of TC comes from the shortness of historical observation records. Operational satellite observations of TC started in the 1980s. Recently, centennial to millennial-scale TC behaviors have been estimated using sedimentary historical records (e.g., Wallace et al., Reference Wallace, Coats, Emanuel and Donnelly2021) and coastal boulders (e.g., Minamidate et al., Reference Minamidate, Goto, Watanabe, Roeber, Toguchi, Sannoh, Nakashima and Kan2020). The recent challenges to project future changes in TC on both global and regional scales are reviewed below.
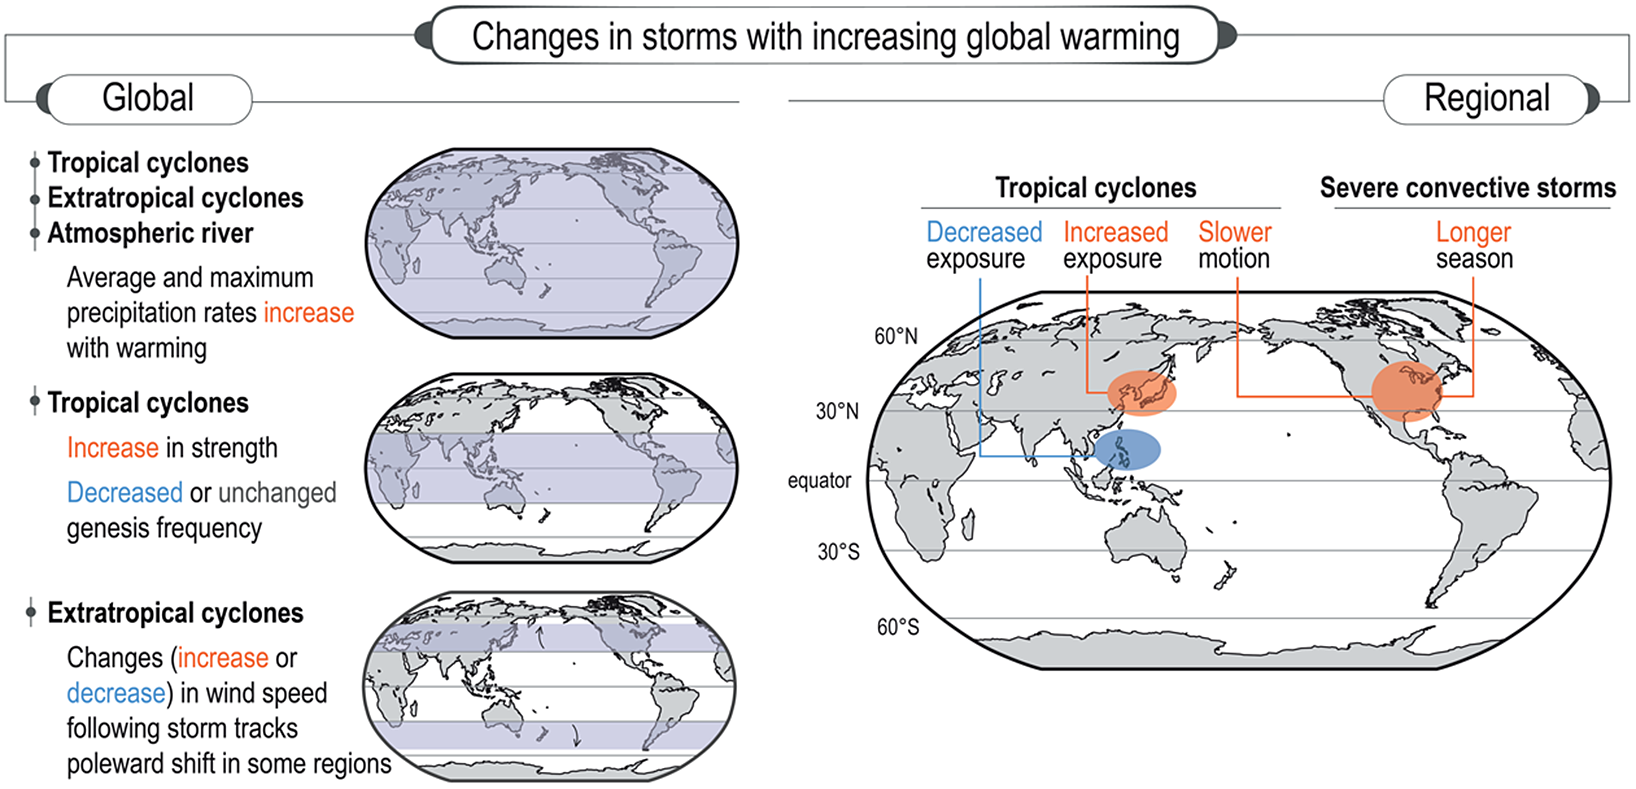
Figure 1. Schematic view of changes in TC and ETC characteristics from past to projected future (Figure 11.20, Chapter 11, IPCC AR6 WGI). Atmospheric river and severe convective storms are not referred in this article.
Assessing extreme events with long return periods is particularly important for coastal hazard assessments. In general, climate projections simulate future climate system changes by incorporating GHG concentrations’ effects into global circulation models (GCMs). In this process, the GCMs are time-integrated from the present to the future, and the integration time scale is about decades to 100 years. Furthermore, a high-resolution horizontal grid and corresponding cloud physics scheme are important for TC simulations. On the other hand, the water levels of storm surges and ocean waves, which are often used in hardware design and countermeasures, have a return period of 50–200 years. Therefore, it is difficult to estimate the present or future values of these extreme events’ probability from the results obtained from conventional climate change projections due to the coarse resolution of GCM and the short sampling period. For this reason, climate projections have become more high-resolution and multi-ensemble since the IPCC AR5 WG1 (2013). For example, the HighResMIP experiment has been conducted by collecting high-resolution GCM projections with large ensembles (Roberts et al., Reference Roberts, Camp, Seddon, Vidale, Hodges, Vanniere, Mecking, Haarsma, Bellucci, Scoccimarro, Caron, Chauvin, Terray, Valcke, Moine, Putrahasan, Roberts, Senan, Zarzycki and Ullrich2020). The HighResMIP summarized that six members are required to detect climate change signals adequately, and enhanced resolution toward 25 km typically leads to more frequent and stronger TCs.
In the Japanese climate research community, a large-scale ensemble experiment was conducted using a global 60-km resolution atmospheric GCM so-called d4PDF (Mizuta et al., Reference Mizuta, Murata, Ishii, Shiogama, Hibino, Mori, Arakawa, Imada, Yoshida, Aoyagi, Kawase, Mori, Okada, Shimura, Nagatomo, Ikeda, Endo, Nosaka, Arai, Takahashi, Tanaka, Takemi, Tachikawa, Temur, Kamae, Watanabe, Sasaki, Kitoh, Takayabu, Nakakita and Kimoto2017; Ishii and Mori, Reference Ishii and Mori2020). d4PDF is a type of single model initial-condition large ensembles (SMILEs; Maher et al., Reference Maher, Milinski and Ludwig2021), in which 100- and 90-member ensemble projections are performed for present and future climates, respectively. One member consists of a 60-year climate simulation; total simulation lengths are 6,000 years (60-year times 100 ensemble) and 5,400 years (60-year times 90 ensemble) for present and +4 K warming future climate, respectively. While the statistical characteristics of extreme TCs, such as TC intensity of a 100-year return period, are difficult to be estimated by just several decades to 100-year data, the large ensemble enabled us to analyze the future changes in the statistical characteristics of extreme TCs. Based on the d4PDF ensemble, future decreases in TC frequency were projected (Yoshida et al., Reference Yoshida, Sugi, Mizuta, Murakami and Ishii2017); the number of global TCs in the present climate is #85/year, which is close to the observed average, while the number of TCs in the future climate expecting +4 K warming condition is #55/year. The intensity of TCs is significantly intensified (lower central pressure) under the future climate conditions in the Northwestern Pacific and other ocean regions. In particular, the future change in TC intensity around Japan is larger than the global average, and the number of strong TCs with a minimum central pressure below 940 hPa increases (Mori et al., Reference Mori, Shimura, Yoshida, Mizuta, Okada, Fujita, Khujanazarov and Nakakita2019). In addition to the number and intensity of TCs, future changes in the distribution of extreme values of minimum central pressure and storm surge, as well as TC tracks, can be evaluated (Mori et al., Reference Mori, Shimura, Yoshida, Mizuta, Okada, Fujita, Khujanazarov and Nakakita2019). The representation of TC characteristics in climate simulations has biases compared with observation. The bias correction is needed for quantitative estimation.
Since d4PDF is a single-model ensemble, it is impossible to discuss the prediction uncertainty caused by GCMs using d4PDF alone. However, future development of large ensembles with high accuracy of TC representation is anticipated, such as SMILE (Maher et al., Reference Maher, Milinski and Ludwig2021), and evaluate their impact on coastal hazards.
Projection of extreme sea level in coastal regions
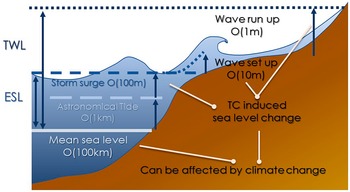
The IPCC SROCC (Pörtner et al., Reference Pörtner, Roberts, Masson-Delmotte, Zhai, Tignor, Poloczanska and Weyer2019) started discussing the importance of changes in extreme sea level (ESL) and total water level (TWL) in addition to traditional SLR, as shown in Figure 2. The sea level discussed in SLR is the medium- to long-term change in mean water level (MWL), such as monthly or annual time scale. The ESL is defined as the MWL plus the maximum astronomical tide level and the short-time water level change due to storm surges (Wahl et al., Reference Wahl, Haigh, Nicholls, Arns, Dangendorf, Hinkel and Slangen2017). TWL is defined as the ESL plus the wave set-up and wave run-up due to waves (see Figure 2) and is used to evaluate near-coast inundation and the stability of structures such as breakwaters.
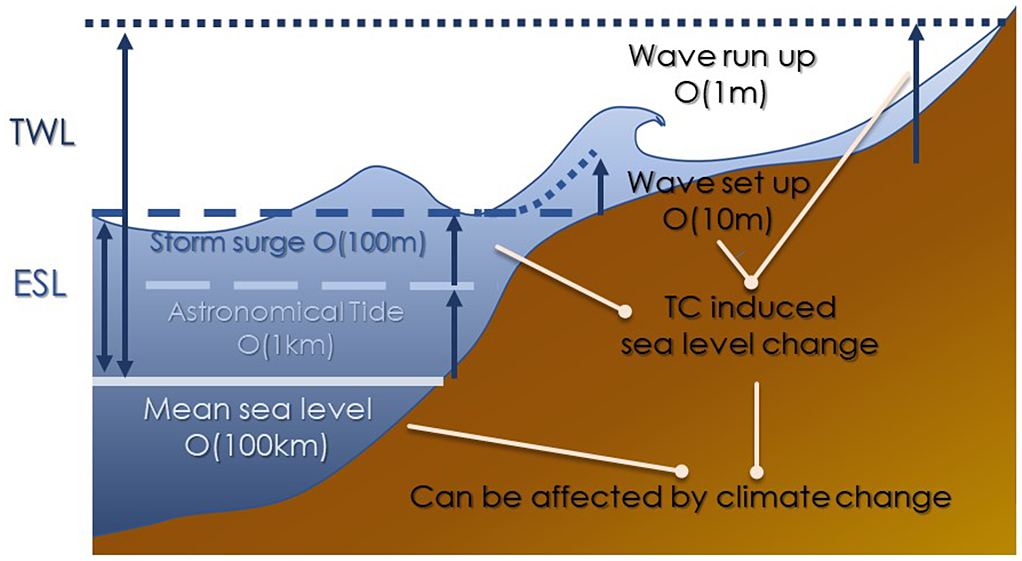
Figure 2. Definition of total water level (TWL), extreme sea level (ESL), mean sea level (MSL), tide, storm surge, wave setup and wave run-up. The spatial scale of each phenomenon are described by O().
Present values and future changes in TWL and ESL are directly related to making a coastal disaster risk reduction plan. In IPCC AR6 WGII, the Summary for Policymakers (IPCC AR6 SPM, Reference Pörtner, Roberts, Poloczanska, Mintenbeck, Tignor, Alegría, Craig, Langsdorf, Löschke, Möller and Okem2022) states that “In coastal cities, the combination of more frequent ESL events (due to SLR and storm surge) and extreme rainfall/river flow events will make flooding more probable (high confidence).” Additionally, the IPCC AR6 SPM warns that anticipated low-likelihood occurrence events and scenarios in the future cannot be excluded and are part of the risk assessment. Therefore, it is important to assess extreme storm surges in a future climate for developing adaptation strategies in low-lying coastal areas in the mid-latitudes of the Pacific, North Atlantic, and Indian Oceans. However, the number of observed extreme storm surge events is extremely limited. Therefore, it is difficult to conduct a probabilistic assessment of extreme storm surges based on historical events. Furthermore, compared to SLR, storm surges and waves have a finer spatial and temporal scale. Therefore, it requires evaluation on a spatial scale of the order of 100 m for storm surge, the order of 1 km for wave height in ocean areas where water depth is not affected, and the order of 1 m for wave run-up on a slope. Furthermore, the mechanism of occurrence of each phenomenon above is also different, so evaluations other than GCM projections are required.
Future changes in storm surges due to climate change have been investigated at a wide variety of regional scales: projections at the regional scale based on climate projections from GCMs and regional climate models (RCMs; e.g., Yasuda et al., Reference Yasuda, Nakajo, Kim, Mase, Mori and Horsburgh2014), pseudo-global warming (PGW) experiments targeting specific past events (e.g., Mori and Takemi, Reference Mori and Takemi2016), stochastic TC models (e.g., Hassanzadeh et al., Reference Hassanzadeh, Lee, Nabizadeh, Camargo, Ma and Yeung2020). The extension from storm surge projection to ESL has been done by Vousdoukas et al. (Reference Vousdoukas, Mentaschi, Voukouvalas, Verlaan and Feyen2017) for European coasts using statistical methods based on observations, followed by a global assessment (Vousdoukas et al., Reference Vousdoukas, Mentaschi, Voukouvalas, Verlaan, Jevrejeva, Jackson and Feyen2018). However, the storm surge projection is still limited on a global scale.
Muis et al. (Reference Muis, Verlaan, Winsemius, Aerts and Ward2016) have assessed hourly historical extreme water levels using a dynamical storm surge model. The historical ESL was calculated by adding the storm surge water level calculated by the dynamical model forced by atmospheric reanalysis ERA-Interim and the modeled astronomical tide. Kirezci et al. (Reference Kirezci, Young, Ranasinghe, Muis, Nicholls, Lincke and Hinkel2020) extended the results of Muis et al. (Reference Muis, Verlaan, Winsemius, Aerts and Ward2016). They used the results of global past ESL assessments to assess future extreme water levels, inundation, and the associated cost of damages.
While future projections of ESL have been made, how to evaluate TC future change projections in storm surges remains a major issue. Mori et al. (Reference Mori, Shimura, Yoshida, Mizuta, Okada, Fujita, Khujanazarov and Nakakita2019) demonstrated storm surge probability assessments for several Japanese bays using direct d4PDF wind speed and sea-level pressure. As a result, the storm surge height in Osaka Bay in Japan will be increased by 0.6–0.7 m for a 100-year return period in the +4 K warming future climate condition. This study on future changes in storm surges also reveals that the relationship between changes in TC frequency and intensity is important for future changes in storm surges. Shimura et al. (Reference Shimura, Pringle, Mori, Miyashita and Yoshida2022) conducted a global storm surge simulation using a dynamic storm surge model and found that changes in TC frequency predominantly drive the annual maximum storm surge.
Overall, it is difficult to use a dynamic model to simulate storm surges for a long-term assessment, if the number of TC events is increased dramatically using stochastic or climatological models; as such, computational costs are a major challenge for very long climate simulations of 1,000 years or longer (e.g., Gönnert and Gerkensmeier, Reference Gönnert and Gerkensmeier2015; Wahl et al., Reference Wahl, Haigh, Nicholls, Arns, Dangendorf, Hinkel and Slangen2017). The challenge is developing a projection method that balances computational accuracy, modeling, and cost. Furthermore, since storm surge is a localized phenomenon (with a scale of tens to a few 100 m), each bay will have different characteristics caused by different geometrical features. Therefore, conducting a global or regional scale assessment is necessary to identify regions most at risk of climate change. Moreover, it has become necessary to make projections of the maximum class storm surges considering the above research progress in climate change projections and impact assessments. Nevertheless, it is very difficult to (1) make projections of extreme storm surge over wide spatial areas (regional) and long temporal scales (climate), (2) determine the statistical stability of the projections, or (3) estimate the trends of long-term changes from the present to the future.
In terms of ocean waves, future changes from a global perspective have been investigated more than storm surges for these 15 years. Global ocean wave climate projection has started to be mentioned since IPCC AR4 WGI (Meehl et al., Reference Meehl, Stocker, Collins, Friedlingstein, Gaye, Gregory, Kitoh, Knutti, Murphy, Noda, Raper, Watterson, Weaver, Zhao, Solomon, Qin, Manning, Chen, Marquis, Averyt, Tignor and Miller2007). Based on the work by a statistical ocean wave model of Wang and Swail (Reference Wang and Swail2006), IPCC AR4 WGI stated the possibility of future changes in wave heights due to climate change. Mori et al. (Reference Mori, Yasuda, Mase, Tom and Oku2010) first conducted the global ocean wave climate projection using a dynamical ocean wave model. Then some research groups have followed the study, which can enable us to estimate the future changes in wave climate by a community-derive multi-model ensemble. Based on the strong demand for wave projection, the Coordinated Ocean Wave CLImate Project (COWCLIP; Hemer et al., Reference Hemer, Fan, Mori, Semedo and Wang2013) was launched and supported by WMO/JCOMM in 2011. COWCLIP summarized the existing global ocean wave climate projections and showed the general tendency of wave climate changes and uncertainty. Referring to the study of Hemer et al. (Reference Hemer, Fan, Mori, Semedo and Wang2013), IPCC AR5 WGI (Church et al., Reference Church, Clark, Cazenave, Gregory, Jevrejeva, Levermann, Merrifield, Milne, Nerem, Nunn, Payne, Pfeffer, Stammer, Unnikrishnan, Stocker, Qin, Plattner, Tignor, Allen, Boschung, Nauels, Xia, Bex and Midgley2013) stated with medium confidence that the enhanced westerly surface winds would lead to larger waves in the Southern Ocean. However, IPCC AR5 WGI concluded that wave climate projections are low confidence in general because of uncertainties of future wind states and the limited number of model simulations. After IPCC AR5, the number of global ocean wave projections conducted by several research groups has increased drastically. Eventually, the second community-derive multi-model ensemble (148 ensemble members) wave projection was conducted in COWCLIP Phase 2 (Morim et al., Reference Morim, Hemer, Wang, Cartwright, Trenham, Semedo, Young, Bricheno, Camus, Casas-Prat, Erikson, Mentaschi, Mori, Shimura, Timmermans, Aarnes, Breivik, Behrens, Dobrynin, Menendez, Staneva, Wehner, Wolf, Kamranzad, Webb, Stopa and Andutta2019). This study concluded that 50% of the world’s coastline has the risk of mean wave climate (wave height, period, and direction) changes (Figure 3). Based on the study of Morim et al. (Reference Morim, Hemer, Wang, Cartwright, Trenham, Semedo, Young, Bricheno, Camus, Casas-Prat, Erikson, Mentaschi, Mori, Shimura, Timmermans, Aarnes, Breivik, Behrens, Dobrynin, Menendez, Staneva, Wehner, Wolf, Kamranzad, Webb, Stopa and Andutta2019), IPCC AR6 WGI (Fox-Kemper et al., Reference Fox-Kemper, Hewitt, Xiao, Aðalgeirsdóttir, Drijfhout, Edwards, Golledge, Hemer, Kopp, Krinner, Mix, Notz, Nowicki, Nurhati, Ruiz, Sallée, Slangen, Yu, Masson-Delmotte, Zhai, Pirani, Connors, Péan, Berger, Caud, Chen, Goldfarb, Gomis, Huang, Leitzell, Lonnoy, Matthews, Maycock, Waterfield, Yelekçi, Yu and Zhou2021) stated that there is medium confidence in the “mean” wave climate projection. Therefore, applying the mean wave climate projection to impact assessment on coastal morphology and another coastal environment becomes possible.
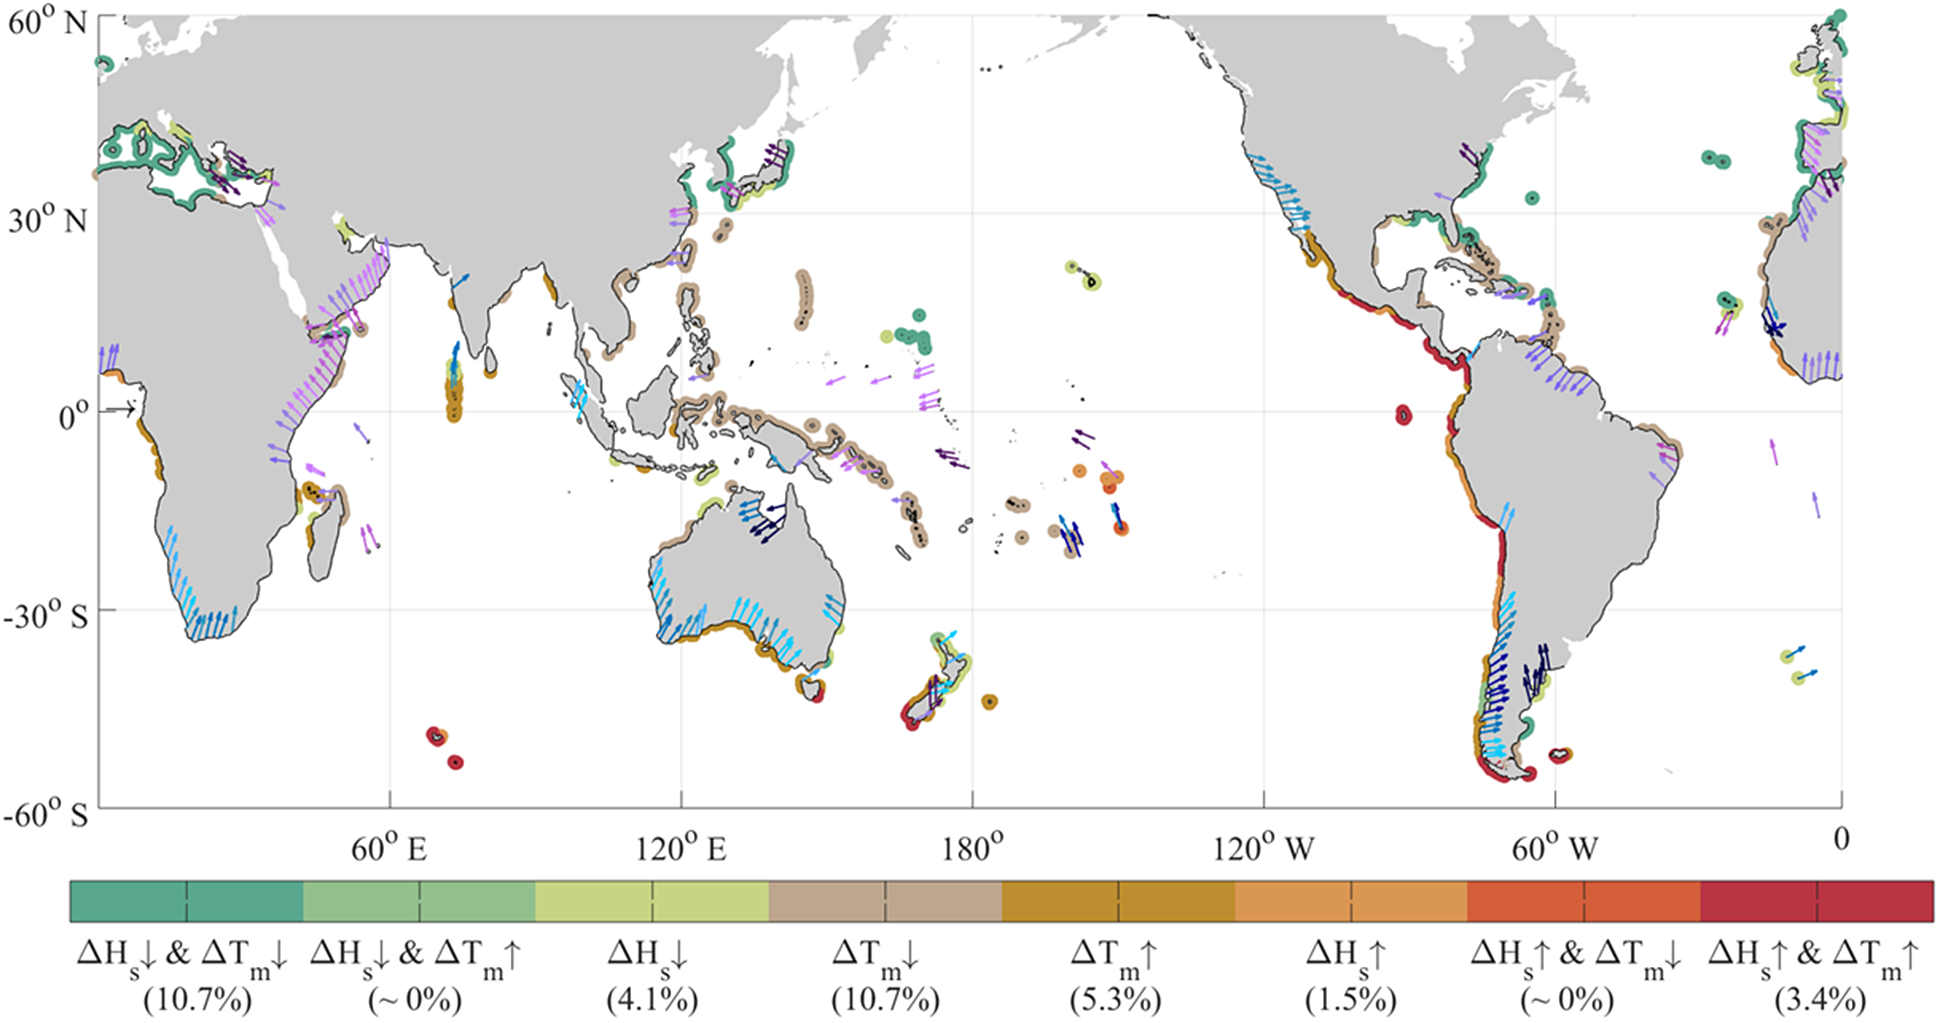
Figure 3. Robust projected changes in mean significant wave height $ {\overline{H}}_s $
, period
$ {\overline{H}}_s $
, period $ {\overline{H}}_m $
, and direction
$ {\overline{H}}_m $
, and direction $ {\overline{\theta}}_m $
for 2080–2100 (under RCP8.5) in the vicinity of the world’s coastlines. (Figure form Morim et al., 2019). ↑ and ↓ mean increase and decrease, respectively.
$ {\overline{\theta}}_m $
for 2080–2100 (under RCP8.5) in the vicinity of the world’s coastlines. (Figure form Morim et al., 2019). ↑ and ↓ mean increase and decrease, respectively.
On the other hand, “extreme” wave climate changes which can contribute to TWL (Melet et al., Reference Melet, Meyssignac, Almar and Le Cozannet2018; Marcos et al., Reference Marcos, Rohmer, Vousdoukas, Mentaschi, Le Cozannet and Amores2019) are still highly uncertain, although some studies have started to investigate the extreme wave height changes which occur once per decades and century (e.g., Meucci et al., Reference Meucci, Young, Hemer, Kirezci and Ranasinghe2020; Lobeto et al., Reference Lobeto, Menendez and Losada2021; Shimura et al., Reference Shimura, Pringle, Mori, Miyashita and Yoshida2022). Most previous studies on wave climate projection were based on the coarse spatial resolution of GCMs (>100 km), which cannot simulate TC well. Extreme wave climate projection highly depends on the performance of TC simulation by GCM, as demonstrated by Shimura et al. (Reference Shimura, Mori and Hemer2017, Reference Shimura, Pringle, Mori, Miyashita and Yoshida2022). Therefore, the study on wave-induced TWL changes with resolving TC well is currently highly limited. Furthermore, even if TC-induced extreme waves change is projection satisfactory extreme wave-induced TWL is difficult to estimate because it is an exceedingly local phenomenon depending on local topography (e.g., O’Grady et al., Reference O’Grady, McInnes, Hemer, Hoeke, Stephenson and Colberg2019). Therefore, global to the local estimation of extreme wave and wave-induced TWL is important same as storm surge. Therefore, the general tendency and uncertainty of future changes in extreme wave-induced TWL need to be estimated by inter-comparison among ensembles as done by the mean wave climate projection study (Morim et al., Reference Morim, Hemer, Wang, Cartwright, Trenham, Semedo, Young, Bricheno, Camus, Casas-Prat, Erikson, Mentaschi, Mori, Shimura, Timmermans, Aarnes, Breivik, Behrens, Dobrynin, Menendez, Staneva, Wehner, Wolf, Kamranzad, Webb, Stopa and Andutta2019).
For the projection of TWL, including wave run-up, further research is needed, including how to convert offshore wave information calculated in spectral energy into run-up heights and model it. The second is to develop detailed global topographic information to enable run-up calculations or simulations. In addition, there is a lack of observational data to validate the results of the simulations of TWL yet.
Outlook
Suppose a worst-case scenario society like the SSP585 scenario will be realized at the end of this century. In that case, an increase in extreme water levels of 1–1.6 m or more can occur at the end of this century, which is the sum of the SLR plus the change in storm surge deviation compared to the current design water level of disaster prevention facilities in coastal areas. Such a future could appear in 70–80 years.
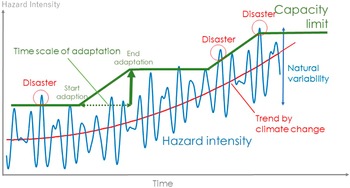
Figure 4 shows the relationship between extreme water levels such as ESL and TWL (blue) and the assumed level of protection (green). The green dotted line schematically shows the time and scale of adaptation measures. As ESL and TWL increase with climate change, the timing and extent of adaptation measures (new or raised levees) will depend on changes in water levels and local conditions. Hardware development requires a budget and construction period, which may take 10 years or even longer in some cases. There are a few cases in which some new areas would be subjected to coastal protection. In reality, breakwaters, seawalls, and other facilities already in place will be aging and will be replaced by the middle of this century. At this time, adaptation to climate change should be promoted, and there may not be a chance to implement adaptation measures as many times as the green line in Figure 4 before the end of the century. We need to reduce the vulnerability of coastal areas in a timely and wise manner by looking at climate projections and realistic plans. In addition, adaptive construction methods need to be developed. We focused on the future changes in coastal flooding-related hazards (sea level) and the coastal structure design as climate change adaptation. The coastal population and resultant coastal hazard risk would be changed in the future (Neumann et al., Reference Neumann, Vafeidis, Zimmermann and Nicholls2015). Coastal hazard risk in a changing climate depends on changes in hazard, vulnerability (coastal structure design level), and exposure (population and asset). Therefore, it is important to consider the projected changes in global population distribution depending on future socio-economic scenarios (Jones and O’Neill, Reference Jones and O’Neill2016). Although Kirezci et al. (Reference Kirezci, Young, Ranasinghe, Muis, Nicholls, Lincke and Hinkel2020) estimated the exposed population and assets to coastal flood by future ESL, population and assets data of the present state are used. Both changes in future external forces and socio-economic scenarios need to be considered for a better adaptation measure strategy. Adaptation countermeasure is not limited to hardware protections (coastal structure design). Other measures are ecosystem-based measures (Spalding et al., Reference Spalding, Ruffo, Lacambra, Meliane, Hale, Shepard and Beck2014), beach nourishment (de Schipper et al., Reference de Schipper, Ludka, Raubenheimer, Luijendijk and Schlacher2021), and migration (Black et al., Reference Black, Bennett, Thomas and Beddington2011), whose validity depends on location.
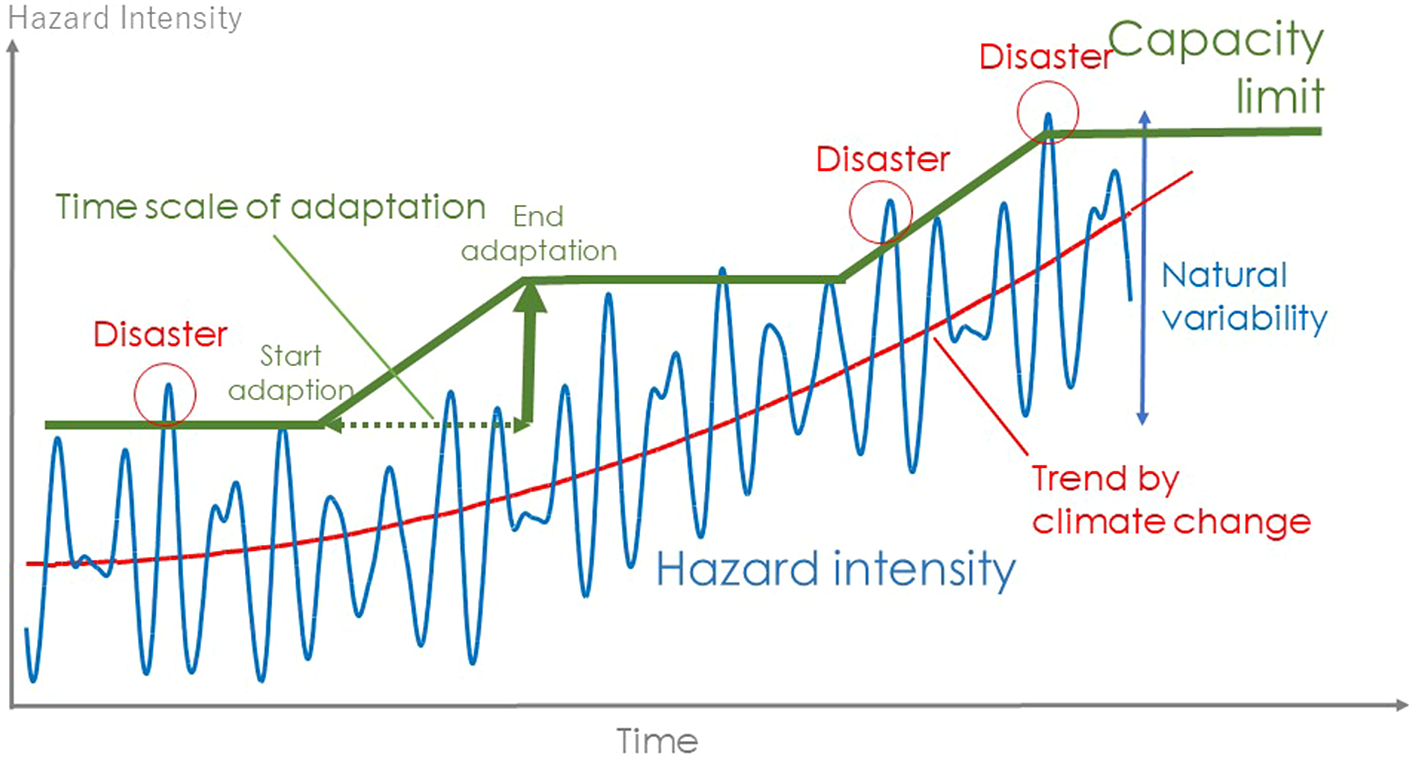
Figure 4. Schematic view of hazard and acceptance level including adaptation (blue: hazard intensity (e.g., water level), green: limit of capacity (e.g., dikeheight), red: climate change trend). Acceptance level means the maximum hazard intensity threshold preventing disaster because of countermeasures.
Future SLR, storm surge, and wave changes (and river discharge) will significantly impact beach shape, which can change relative sea levels. Therefore, new countermeasures to address coastal hazards considering beach evolution should also be considered. Vousdoukas et al. (Reference Vousdoukas, Ranasinghe, Mentaschi, Plomaritis, Athanasiou, Luijendijk and Feyen2020) indicated that half of the global sandy beach is threatened extinction due to SLR at the end of this century. However, Cooper et al. (Reference Cooper, Masselink, Coco, Short, Castelle, Rogers, Anthony, Green, Kelley, Pilkey and Jackson2020) casted doubt on the estimation because the study of Vousdoukas et al. (Reference Vousdoukas, Ranasinghe, Mentaschi, Plomaritis, Athanasiou, Luijendijk and Feyen2020) ignored the capacity of sediment supply depending on location. Generally, the long-term projection of beach shape evolution due to climate change considering SLR, storm surge, and wave changes has not been established as reviewed by Toimil et al. (Reference Toimil, Camus, Losada, Le Cozannet, Nicholls, Idier and Maspataud2020). Combined studies by climatologists, oceanographers, coastal engineers, and coastal geologists will be essential to solving these problems.
Open peer review
To view the open peer review materials for this article, please visit http://doi.org/10.1017/cft.2022.6.
Author contributions
Both authors planned and wrote this manuscript equally.
Financial support
N.M. is supported by the SENTAN Program (Grant no. JPMXD0722678534) supported by the Ministry of Education, Culture, Sports, Science and Technology (MEXT), Japan, the Environment Research and Technology Development Fund (JPMEERF20S11812) of the Environmental Restoration and Conservation Agency of Japan, and JSPS KAKENHI Grant-in-Aid for Scientific Research (A) 19H00782. T.S. is supported by JSPS KAKENHI Grant-in-Aid (22K14329).
Competing interests
The authors declare no competing interests exist.


 Open access
Comments
Upon your invitation, we are pleased to send you a copy of the Standard Review manuscript. We look forward to a constructive review of your manuscript.
Please note that two of the figures are taken from other papers and the other two are original.