


Globally, undernutrition is the single biggest contributor to child mortality(1). Although the underlying determinants of undernutrition are complex and interacting, inadequate nutrient intake is an immediate cause(2,Reference Black, Alderman and Bhutta3) . The prevalence of undernutrition is decreasing; however, there are still 144 million children under 5 years who suffer from chronic malnutrition, more than a third of whom live in Africa(4). Accurate and timely data are essential for identifying populations at risk for undernutrition due to poor quality diets, for implementing appropriate interventions and for evaluating change(Reference Livingstone, Robson and Wallace5–Reference Foster and Bradley8).
Current methods of quantitative dietary assessment are reliable but resource-intensive. To address the need for a rapid, inexpensive and simple-to-administer method with a low participant burden, reliable population-level food group indicators for measuring diet quality requiring only semi-quantitative dietary data were developed. Cross-country analyses assessing their performance for predicting nutrient adequacy have shown moderate, but variable, associations(9–Reference Arimond, Wiesmann and Becquey11). Two indicators in particular – a dietary diversity score (DDS) for children under 5 years and a DDS for women of reproductive age living in low- and middle-income countries – have been validated and are now in widespread use globally(12–14). Corresponding global minimum dietary diversity (MDD) standard thresholds have also been validated and are in widespread use(12,13,15) . Assessing dietary diversity using the DDS or other food group-based indicators is, in comparison, much simpler and requires only assessing whether any representative foods of each food group in the index were consumed.
‘Gold standard’ quantitative dietary assessment methods, such as direct observation and repeated weighed food records (WFR), are used to accurately and reliably assess the foods consumed as well as the amount of eatable portion of each food consumed by individual consumers. They are seldom used to routinely collect dietary data due to high financial and time costs, participant burden and requisite expertise(Reference Gibson16–Reference Thompson, Subar, Coulston, Boushey, Ferruzzi and Delahanty18). Instead, retrospective diet assessment tools using a multiple-pass 24-h ‘free’ recall technique, which entails mothers recalling all foods consumed by their child or themselves on the previous day, are commonly used for estimating food consumption. The accuracy of all food recall methods relies upon the respondent’s memory and motivation, as well as the skill and persistence of the interviewer. Misreporting of foods consumed may occur, either unintentionally – for example, for foods that are infrequently consumed – or intentionally, due to interviewer, social desirability or approval biases(14). Such errors can result in either underreporting or over-reporting (or both) of food groups defining the DDS. The 24-h recall (24HR) method is also susceptible to other measurement errors(Reference Gleason, Boushey and Harris19,Reference Fosgate20) .
There is a long history of using photos to overcome the limitations of traditional food recall methods. ‘Portion-size estimation aids’ involve the use of gradated food photos (representing the range of portion sizes commonly consumed) when collecting semi-quantitative data(Reference Nelson and Haraldsdóttir21–Reference Amougou, Cohen and Mbala31). They are among the earliest approaches to incorporating food photography into diet assessment methods to reduce recall bias and have now been validated in both high- and low-income countries. Another approach to incorporating food photography (or illustrations) into traditional diet assessment methods is the use of a pictorial food chart to help low-literacy subjects in Sub-Saharan Africa prospectively self-record foods consumed(Reference Gibson and Ferguson17,Reference De Bruyn, Msuya and Ferguson32,Reference Thakwalakwa, Kuusipalo and Maleta33) .
In high-income country contexts, validation research has also been conducted, in controlled settings, into the use of prospective photos taken by the study subject (often using a mobile phone) during food preparation and/or eating episodes(Reference Kaczkowski, Jones and Feng34–Reference Ashman, Collins and Brown37). In these studies, information documented in the photos regarding foods consumed, portion sizes and wastage is later used by researchers to compute nutrient intake. Such ‘active’ photography methods may reduce unintentional errors but do not eliminate the possibility of intentional over- or under-estimation due to social desirability bias. And, although often preferred to traditional methods, active prospective food photo methods require a high level of technical competence among study participants, which further limits its use in large-scale surveys.
New digital media technologies offer opportunities for improving upon traditional 24HR methods of assessing dietary diversity(Reference Kelly, Marshall and Badland38–Reference Pettitt, Liu and Kwasnicki41). A life-logging wearable camera (LLWC) worn by a study participant can be used to prospectively and passively capture food/beverage consumed, which may provide a more objective method of data collection for assessing women’s and children’s dietary diversity than the 24HR method, with low respondent and interviewer burden. In high-income countries, limited validation research on image-assisted recall (IAR) methods for assessing quantitative dietary data suggests that a LLWC can reduce underreporting of energy intake(Reference Gemming, Rush and Maddison42,Reference Gemming and Ni Mhurchu43) . Yet, questions remain about their validity, acceptability and feasibility(Reference Smith, Stanley and Signal44,Reference Kamar, Evans and Hugh-Jones45) .
In addition to a range of socio-cultural factors that may affect the acceptability of the LLWC in rural low-income country settings, the contexts pose unique technical challenges for wearable cameras, such as lack of electricity with which to illuminate food preparation and consumption at night or indoors and to charge the wearable devices; rugged conditions that expose the camera to water and dirt; and lack of familiarity among participants to digital technology and social media – in particular to first-person photos – which may hamper their interpretation. Furthermore, logistical challenges can be anticipated in assessing dietary diversity for young children. For example, using a LLWC attached to the caregiver may not fully capture a child’s food intake if the child spends substantial time out of the direct supervision of the primary caregiver (and therefore not in sight of the camera).
This study was undertaken in rural Eastern Uganda to evaluate the concurrent criterion validity, for assessing maternal and child DDS and MDD, of a LLWC-based IAR method and the 24HR method. Direct observation with WFR was the criterion method. Previous studies have evaluated the validity of photo-assisted methods to assess nutrient intake in high-income country contexts. No study, to our knowledge, has examined the validity, for estimating DDS or MDD, of the 24HR method or an IAR method using a LLWC in either free-living or controlled settings.
Methods
Study design
A cross-sectional study of mothers and their child aged 12–23 months (n 211) was conducted between January and February (dry season) 2018 in Bugiri and Kamuli Districts, Eastern Region, Uganda. This study was nested within another study designed to examine the impact of a labour-saving technology (a mechanised maize sheller) on women’s time for childcare, food preparation and dietary practices.
In our study, food/beverage consumption of mothers and their child was assessed, for the same day, using three concurrent methods: (1) direct observation (15 h) via WFR, (2) 24HR and (3) IAR using a LLWC (wearable camera). Data were collected over five consecutive days, following one of the two possible patterns (Fig. 1). Specifically, for both patterns, on day 1, eligibility was confirmed, a structured questionnaire was administered and anthropometric data were collected for all participants. Day 1 data were collected at a predefined meeting place in the village. All other data were collected at the participants’ home. For half of the study participants, on day 2, food/beverage consumption data were collected using direct observation via WFR and recorded on the wearable camera attached to the mother. On day 3, a 24HR was administered, followed by an IAR using photos captured on day 2 by the wearable camera. On day 4, food/beverage consumption data were again recorded via the wearable camera only (i.e. no observation). On day 5, an IAR was administered using photos captured on day 4 by the wearable camera. The other half of the study participants began with the wearable camera only (i.e. days 2 and 4 were switched) and ended with all three methods (i.e. days 3 and 5 were switched). For all participants, on the 5th day, a final structured questionnaire was also administered. All data collection was performed by trained enumerators. Dietary data collection was distributed across all days of the week to minimise any day-of-the-week effect, and for each mother–child dyad, the enumerator assigned to conduct the direct observation was different from the enumerator assigned to administer the 24HR and IAR.

Fig. 1. Data collection household pattern (HHP).
Ethical approval was obtained from the Uganda National Council for Science and Technology (A24ES), the London School of Hygiene & Tropical Medicine Observational/Interventions Research Ethics Committee (project ID: 1420) and the University of Greenwich Faculty of Engineering and Science Ethics Committee (project ID: B0501). The data collection protocols followed the ethical guidelines for LLWC research to ensure that privacy of the participants was maintained(Reference Kelly, Marshall and Badland38). Following community sensitisation, verbal explanation of the study and demonstration of the wearable camera, written consent or thumb print was obtained from all mothers who participated in our study.
Participants and sampling
Twenty-two villages were purposefully selected, for this study, of which eleven had access to labour-saving technology and eleven did not. These villages participated in the Sasakawa Global 2000 Uganda (SG2000 Uganda) country programme (the local implementing partner for the parent study). The sample size calculation (n 264; twenty-two communities, twelve households per community) was based on requirements of the time allocation study within which this current study was nested. A sample size of 132 per group enabled detection of a 30-min inter-group difference between women with access to a labour-saving device and households without access to a labour-saving device, assuming a sd of 49 min, a design effect of 1·47, 80 % power and P value of 0·05 and allowing for 10 % attrition. This sample size was deemed sufficient for the current validation study, using the Bland–Altman method of analysis(Reference Martin Bland and Altman46–Reference Bland and Altman49).
The sampling frame, for each village, was a household listing of all mothers with children born between 1 January 2016 and 1 May 2017 inclusive (to recruit children aged 12–24 months at the time of data collection). These lists were generated by the SG2000 community-based facilitators. Twelve mother–child dyads in each village were randomly selected to participate in the study; substitutions were made, as needed, until twelve mother–child dyads who met the inclusion/exclusion criteria were recruited. Mother–child dyads were excluded if the child was <12 months or >23 months of age, was not yet eating solid foods on a regular basis, was a multiple-birth child, the mother was unable to communicate in Lusoga, Luganda or English; either the mother or child had a severe disability; the mother was not the biological mother of the child; the mother was a co-wife with another mother selected to participate in the study; or either the mother or child was not available for the duration of the study.
Instruments and protocol
The enumerators administered two structured questionnaires to the mother. The first questionnaire collected information on: household socio-demographics, wealth (adapted from the Uganda 2012 Poverty Probability Index), expenditure and production (adapted from the Abbreviated Women’s Empowerment in Agriculture Index); knowledge, attitudes and practices regarding infant and young child feeding and care; factors related to women’s empowerment (adapted from the Abbreviated Women’s Empowerment in Agriculture Index) and the child’s health (adapted from Demographic and Health Surveys). The second questionnaire was administered at the end of the period of data collection. Response options in this questionnaire included a four-point Likert for questions related to participants’ perceptions of their experiences with each of the three food/beverage data collection methods, and categorical scales for questions related to mobile phone access, ownership and use, and willingness to participate in a future study using 24HR or wearable cameras, in addition to open-ended comments. Duplicate, serial anthropometric measurements of weight and height/length were taken from participating mothers and children.
For the criterion diet assessment method (i.e. WFR), enumerators weighed and recorded all food/beverage consumed by mothers and children, from approximately 06.00 to 21.00 hours using dietary scales (±1 g, Salter Disc Electronic Digital Scale Model 1036) and a standard WFR protocol(Reference Gibson16). Recipe data were also collected by weighing the recipe ingredients and final cooked food and recording the cooking methods (e.g. fried, boiled and stewed). If the child was left in the care of another person, the enumerator remained with the mother and information about any foods or beverages consumed while the child was away was collected from the secondary caregiver via recall upon their return. The amounts of food/beverage consumed by the mother or child before 06.00 or after 21.00 hours were recalled and recorded.
On the day after the WFR was collected, two semi-quantitative multiple-pass 24-h dietary recalls were administered to the mother to collect information on all foods and beverages consumed the previous day – one for herself and then one for the child(Reference Gibson16). For each recall, in the first pass, the mother was asked to list everything she (or her child) consumed the previous day; in the second pass, additional details about each food were recorded, including the time of consumption and ingredients in mixed dishes. In the third pass, mothers were asked to confirm the food groups consumed. The quantity of each food consumed was not recorded.
The same day as WFR data collection, a small, lightweight, LLWC was attached to a t-shirt worn by the mother at approximately 06.00 hours and removed at approximately 21.00 hours. Participants were instructed to wear the camera while continuing their usual activities, covering or removing the camera as needed for privacy. The wearable camera automatically recorded a picture every 30 s, storing all photos (approximately 1800) on a memory card.
The following day, an enumerator first reviewed the photos captured by the wearable camera on a tablet and annotated the foods she thought – based on the photos – were consumed by the mother and child, that is, the enumerator image interpretation (EII). The enumerator estimated the DDS for the mother and child based on her interpretation of the photos and demarcated the series of eating episodes for later review with the mother. Upon meeting with the mother, the enumerator first administered the two standard 24HR (one for the mother and one for her child). Then, the enumerator reviewed the photos with the mother on the tablet. During this interview, the enumerator probed the participant based on ‘the 4 Ws, where appropriate; for example, questions such as: ‘What were you doing?’, ‘Who were you with?’, ‘Where were you?’, ‘Where were you going?’, ‘Where was the index child?’, ‘Why did you go there?’, or ‘Why were you doing that?’ The enumerator revised her original annotations (i.e. the EII) of foods consumed by the mother and child, as needed, based on the mother’s feedback. Finally, having reviewed and discussed the previous day’s photos with the mother, the enumerator asked the mother to confirm the food groups that she and her child had or had not consumed (i.e. the IAR).
The IAR protocol was adapted from one used in high-income country contexts(Reference Gemming, Doherty and Kelly39). The protocol followed ethical guidelines for LLWC research to ensure that the privacy of the participants was maintained(Reference Kelly, Marshall and Badland38). The IAR protocol was pilot-tested prior to the start of the study.
Data processing
The food/beverage recorded over a period of 24 h were coded into food groups, and a DDS was calculated for each mother and child for each method (WFR, 24HR and IAR). The DDS for children was based on seven food groups: namely grains, roots and tubers; legumes and nuts; dairy products; flesh foods; eggs; vitamin A-rich fruits and vegetables; and other fruits and vegetables(12). The DDS for women was based on ten food groups: namely grains, white roots and tubers, and plantains; pulses; nuts and seeds; dairy products; meat, poultry and fish; eggs; dark green leafy vegetables; other vitamin A-rich fruits and vegetables; other vegetables; other fruits(13). The percentage of women and children achieving MDD was calculated. The threshold MDD used for women was five food groups out of ten; the threshold MDD for children was four food groups out of seven. Breast milk intake was not included in the comparison of the three methods.
Weight-for-age z-score, length-for-age z-score and weight-for-length z-score were calculated for each child using the 2006 WHO growth standards(50), and BMI was calculated for each mother. The proportions of children who were underweight (<–2 sd from median weight-for-age z-score), stunted (<–2 sd from median length-for-age z-score) and wasted (<–2 sd from median weight-for-length z-score) were calculated. The proportions of mothers who were thin (BMI < 18·5 kg/m2), normal (BMI 18·5–24·9 kg/m2) and overweight/obese (BMI ≥ 25·0 kg/m2) were also calculated. The Ugandan 2012 Poverty Probability Index was calculated, as well as the proportion of the population living below $1·25/d(Reference Schreiner51).
Data analysis
The primary outcome variables analysed for both mothers and children were DDS and MDD. Data were analysed using Stata/SE version 15.1. P values <0·05 were considered significant for all tests. Cases with incomplete data for any of the three methods (WFR, 24HR or IAR) were eliminated from analysis. A minimum threshold of 13 h of observation and photos from the wearable camera were deemed adequate; any cases not meeting this threshold were eliminated from analysis to ensure the integrity of the comparison (with the 24HR). The Wilcoxon signed-rank sum and McNemar’s tests were used to compare the distributions of DDS and MDD, respectively, obtained via the criterion method (WFR) v. the 24HR or IAR. The medians of the DDS differences (24HR minus WFR and IAR minus WFR) were computed, and the distribution of the median DDS differences was also compared. Key socio-demographic characteristics for participating and missing households were compared using the Mann–Whitney two-sample statistic for continuous data, and the Fisher Exact test for categorical data. DDS and MDD for mothers and children in participating households collected via IAR were also calculated for the non-observation day and compared with those of the corresponding observation day, using the Wilcoxon signed-rank sum and McNemar’s tests, respectively.
Treating DDS as a continuous measure, the inter-tool agreement between WFR and 24HR or IAR was assessed using the Bland–Altman limits of agreement (LOA) method(Reference Martin Bland and Altman46). Specifically, for each individual, the difference between the methods (DDS estimated using either the 24HR or IAR minus the criterion measure of DDS) v. the mean of the methods was plotted; the relative bias and the 95 % LOA (mean difference ± 2 sd of the differences) were estimated. Finally, DDS estimates via the 24HR and IAR methods against the criterion method were also compared using the weighted Cohen’s κ coefficient for inter-rater agreement. It was interpreted as follows: <0·00 poor agreement; 0·00–0·20 slight agreement; 0·21–0·40 fair agreement; 0·41–0·60 moderate agreement; 0·61–0·80 substantial agreement; 0·81–1·00 almost perfect agreement(Reference Landis and Koch52,Reference Farooq, Doulah and Parton53) .
Results
Characteristics of the sample
Overall, 211 mother–child dyads were recruited into the study. Among those recruited, six participants voluntarily withdrew and forty-two participants were eliminated from analysis due to incomplete data (Fig. 2). Characteristics of the study population are presented and compared with participants who were lost to the study in Table 1. These comparisons show there were no differences between participating and missing households, with the exception of child breast-feeding status (61 % for participating children v. 42 % for non-participating children). The median household size was six members, and nearly one-quarter of participating households lived below $1·25/d. Most participating mothers were married and between the ages of 20 and 29 years. Nearly two-thirds of participating mothers had not completed primary school, and just under one-half were literate. Most mothers were either pregnant, breast-feeding or both. Most women were of normal BMI.

Fig. 2. Study population. IAR, image-assisted recall.
Table 1. Characteristics of households, mothers and children participating in and lost to the study
(Numbers and percentages; median values and 25th and 75th percentiles)

PPP, purchasing power parity; P, P value using Mann–Whitney U test to compare the medians and Fisher’s exact test to compare the categorical data.
The median age of participating children was 16·7 months, approximately evenly split between males and females. Nearly all children were initially breastfed, although just 61 % were breast-feeding at the time of data collection. Among this population, children were fed by several caregivers in addition to their mother. More than a third of children were fed by at least one caregiver <13 years of age. Approximately a quarter of children were stunted but <3 % of children were wasted.
Diet diversity
The median DDS, for both mothers and children and all methods, was four food groups (Table 2). The estimated percentage of mothers achieving the MDD ranged from 41 % for the WFR to 47 % for the 24HR and for children it ranged from 55 % for the WFR to 60 % for the 24HR (Table 2). The percentage achieving the MDD estimated via the 24HR and IAR, for both mothers and children, was consistently higher than the WFR estimates.
Table 2. Inter-method comparisons of the median dietary diversity scores (DDS) and percentage achieving minimum dietary diversity (MDD) (Median values and 25th and 75th percentiles; numbers and percentages)

WFR, weighed food record; 24HR, 24-h recall; IAR, image-assisted recall.
* Mother DDS is out of ten food groups; child DDS is out of seven food groups.
† Mother MDD is DDS ≥ 5; child MDD is DDS ≥ 4.
‡ P value of Wilcoxon signed-rank sum test of DDS compared with WFR < 0·05.
§ P value of McNemar’s test of the MDD proportion difference compared with WFR < 0·05.
Median DDS and MDD for mothers estimated via IAR on the non-observation day were slightly higher than those collected via IAR on the observation day (5 v. 4, P = 0·2862; and 54 v. 42 %, P = 0·1161) (see online Supplementary Tables S1a and b). For children, median DDS and MDD estimated via IAR on the non-observation day were similar to those collected via IAR on the observation day (4, P = 0·5243; and 56 v. 58 %, P = 0·3428) (see online Supplementary Table S1a and b).
Measure of agreement
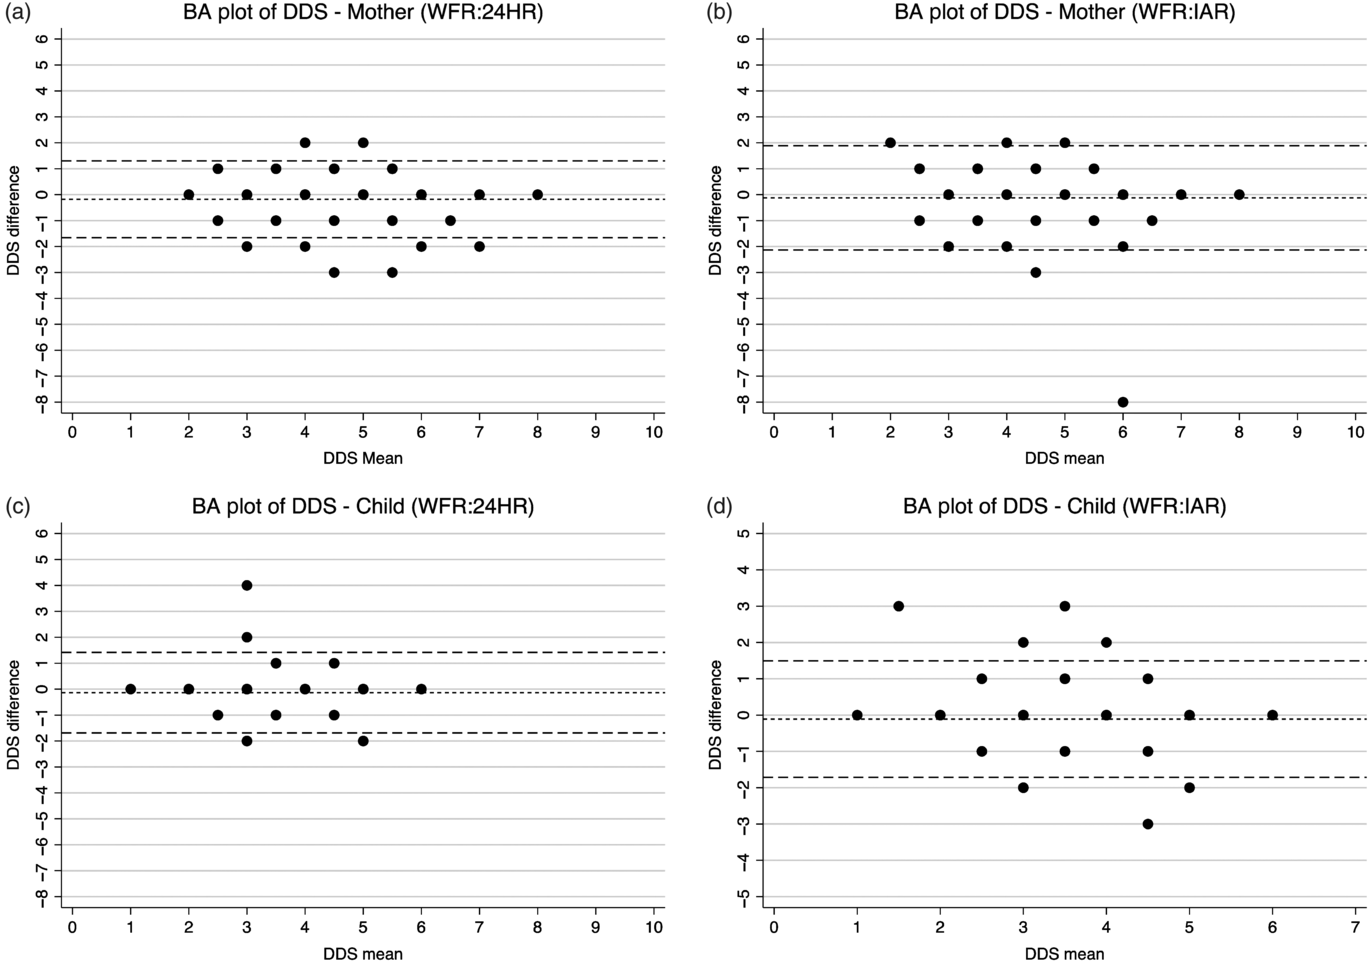
The Bland–Altman plots showed a consistent and uniform pattern across the range of mean DDS for all analyses (Fig. 3). The relative bias was low for the 24HR (–0·1801 for mothers; –0·1358 for children) and the IAR (–0·1227 for mothers; –0·1104 for children) (Table 3). The percentage of DDS that were identical comparing the IAR or 24HR with the criterion method ranged from 58 % (IAR for mothers) to 70 % (24HR children). Between 6 and 9 % of the estimates were erred by two or more food groups (see online Supplementary Fig. S1). Although the relative bias was not clinically important, the LOA were wide (–1·6615 to 1·3012 and –1·6883 to 1·4167 for mothers and children via 24HR, respectively; –2·1322 to 1·8868 and –1·7130 to 1·4921 for mothers and children via IAR, respectively). For DDS estimated via 24HR and IAR, Cohen’s κ coefficient was 0·68 and 0·59, respectively, for the mothers, and 0·60 and 0·59, respectively, for the children (Table 4). For mothers, Cohen’s κ indicated slightly higher inter-method agreement for the 24HR (substantial reliability) than the IAR (moderate reliability), whereas for children, the inter-method agreements for the 24HR and IAR are both moderate.

Fig. 3. Bland–Altman (BA) plots of maternal and child dietary diversity (DDS) score difference v. the mean. WFR, weighed food record; 24HR, 24-h recall; IAR, image-assisted recall.
Table 3. Inter-method comparisons of the relative bias and limits of agreement (LOA) (Mean values and standard deviations)

24HR, 24-h recall; IAR, image-assisted recall.
* Relative mean difference.
† ± 2 sd from the relative mean difference.
Table 4. Inter-method comparisons of Cohen’s κ coefficient (κ Values and 95 % confidence intervals)

24HR, 24-h recall; IAR, image-assisted recall; DDS, dietary diversity score.
* Mother DDS is out of ten food groups; child DDS is out of seven food groups.
† Using weighted Cohen’s κ for interrater agreement. Landis & Koch(Reference Landis and Koch52) suggest the following benchmark scale for interpreting the κ statistic: <0·00 poor; 0·00–0·20 slight; 0·21–0·40 fair; 0·41–0·60 moderate; 0·61–0·80 substantial; 0·81–1·00 almost perfect.
Discussion
This is the first study, to our knowledge, validating the 24HR and IAR method using a LLWC for assessing DDS and MDD. Both the 24HR and the IAR provided an accurate estimate of the sample median DDS for women and young children, for the same day of food intake, but tended to overestimate the proportion of women or children that achieved MDD, indicating that the 24HR and the IAR may over-estimate diet quality, at least among women and young children of Eastern Uganda during the dry season.
Although the relative bias seen in this study was low, the high LOA observed for both methods (24HR and IAR) across population groups (mothers and children) was substantial. There are no validation studies of IAR methods for estimating DDS with which to compare these results. However, similar results have been seen in image-assisted quantitative diet recall validation studies(Reference Huybregts, Roberfroid and Lachat29,Reference Thakwalakwa, Kuusipalo and Maleta33,Reference Norman, Kjellenberg and Torres Aréchiga35,Reference Ashman, Collins and Brown37,Reference Lombard, Steyn and Charlton54) . Such error usually serves to attenuate the association between DDS and health or other outcomes and diminish power to detect it(Reference Thompson, Subar, Coulston, Boushey, Ferruzzi and Delahanty18). This study indicates that attenuation levels might remain high even after accounting for day-to-day variation in DDS because food groups are misreported by a substantial proportion of individuals.
It is well documented that, in quantitative dietary assessment, measurement error (the difference between reported intake and true intake) commonly occurs(Reference Thompson, Subar, Coulston, Boushey, Ferruzzi and Delahanty18). This study suggests that a high degree of measurement error also occurs when diet quality is assessed by the number of selected food groups consumed. In this study, individual estimates of DDS could differ by more than two food groups from observed values. It is remarkable that both 24HR and IAR mis-classified over a third of maternal and child DDS. Although there is no globally accepted threshold LOA for DDS, a difference of one or two food groups (out of seven for children and ten for women) is substantial. Errors appear to occur equally at lower and higher ends of the DDS spectrum.
The cause of the wide LOA observed in this study is not immediately evident. Further exploration of the data shows that reported consumption of vitamin A-rich fruits and vegetables was higher (≥5 %) in the IAR and 24HR than the WFR for mothers and children, and a higher percentage of mothers reported consuming other fruits (62 v. 56 %) and dairy products (22 v. 17 %) in the IAR compared with WFR (see online Supplementary Table S2a and b), whereas a lower percentage of mothers reported consumption of other vegetables in the IAR compared with the WFR (90 v. 95 %).
Our finding that the LOA in assessing DDS were high, for both the 24HR and IAR collected for the same day as the criterion method, was somewhat surprising. Compared with the 24HR, we had expected viewing one’s own passively collected photographs (IAR) would reduce errors due to memory, social desirability and other biases commonly known to contribute to inaccurate estimates when recalling foods consumed.
There are several plausible contributing factors. For instance, mothers may have become bored and/or fatigued after four similar series of questions about the food groups consumed, thus resulting in more random error in IAR than 24HR, because the mother and child 24HR were administered before the mother and child IAR. Further review by the author (A. L. S. B.) of the data inconsistencies in the procession from WFR to EII to IAR among participants with large discrepancies in DDS suggests that inflation of the DDS from WFR to the IAR may have been due to errors introduced by the mother during the last step of the IAR protocol (i.e. the final confirmation of food groups consumed). In addition to boredom or fatigue, social desirability bias may have contributed to inflation of DDS. No pattern was observed for those that under-estimated the DDS.
Alternatively, and consistent with the long-standing theory that low levels of education and pictorial literacy may affect subjects’ capacity to interpret food photos, some women in this study struggled to interpret the first-person photos from the wearable camera(Reference Fuglesang55). Enumerators were instructed to record foods consumed as reported by the mother, even if it conflicted with their own interpretation of the photos. Thus, error may have occurred, in the IAR, if photos were misinterpreted by the mother.
A thorough analysis of the feasibility and acceptability, using results from the questionnaire administered at the end of the period of data collection and administrative records, will be reported separately (manuscript in preparation). These results may provide further insights into factors contributing to the wide LOA observed in this study.
Based on the results of this study, the EII (i.e. the enumerator working independently – without the aid of the mother – to interpret from the wearable camera photos foods consumed by the mother or child) did not provide a reliable estimate of DDS for mothers or children. When enumerators annotated foods consumed based on their interpretation of the photos, without the assistance of the mother, they consistently underestimated the variety of foods consumed by both mothers and children compared with the mother-assisted IAR and WFR (see online Supplementary Table S2a and b). For example, based on enumerators’ review of photos alone, only 35 % of mothers consumed animal source foods compared with 62 % when the mother-assisted IAR was used (and 65 % in the WFR). For children, only 36 % (EII) compared with 60 % (IAR) and 59 % (WFR) was estimated to have consumed pulses. This suggests that study participants themselves are crucial in interpreting wearable camera images for the purposes of estimating DDS.
DDS and MDD estimated via IAR on observation days were similar to those estimated on non-observation days. The results of this study therefore indicate low reactivity to observation. However, the results achieved in this study may still reflect a higher level of agreement between the 24HR and IAR v. WFR than might otherwise be expected. Owing to higher percentage of breast-feeding children included in the analyses compared with those lost to the study, children in this study may have remained in closer proximity to their mother, thus enabling more consistent monitoring of the child’s dietary intake. Also, mothers may have been more vigilant of the child’s food intake due to reactivity to the wearable camera.
Overall, dietary quality for mothers and children in this study population was poor (see online Supplementary Table S2a and b). Consumption of most nutrient-dense foods, such as dairy products, eggs, and dark leafy greens and other vitamin A-rich fruits and vegetables by mothers and children, respectively, was low. Data collection was conducted during the dry season, and, consequently, vitamin A-rich fruit consumption may have been lower than that in other seasons. Even though the consumption of animal source foods is relatively high, due to the widespread consumption of small fish, less than half of mothers and <60 % of children achieved the MDD.
This study was conducted in Bugiri and Kamuli Districts in the Busoga Region of Eastern Uganda where 29 % of children under 5 years of age are stunted and 7 % of women are underweight(56). In Busoga Region, 66 % of women are illiterate, only 12 % of women have completed primary school and more than a third have no regular access to radio, television or the newspaper(56). By comparison, in our study, less than half of the participants were literate and just over one-third had only a primary school level of education. Our results show markedly better child diet quality (MDD = 55 %) compared with that reported by the most recent Demographic and Health Surveys for the Busoga region (MDD = 31 %) (DDS was not reported)(56). Relatively higher levels of education and literacy among mothers in this study may be a factor in higher-than-expected child MDD. Participation in the Sasakawa programme, seasonality, method of data collection or secular changes in food consumption patterns may also contribute to differences in the prevalence of children having achieved MDD.
Limitations
This study set out to pilot test and evaluate the potential of using an inexpensive LLWC to estimate the DDS and MDD of women and young children. Our hypothesis was that prospectively capturing food consumption data would reduce systematic and random errors inherent to dietary recalls and reduce respondent/interviewer burdens inherent to WFR and might allow accurate dietary diversity data collection at scale for programmatic purposes in rural low-income country (LIC) contexts. Our results indicate that, although the relative biases of both the 24HR and IAR were low, the high individual-level error observed in both methods may be expected to attenuate associations between DDS and outcomes measured. Therefore, where DDS are estimated via 24HR or IAR data, the true associations between DDS and outcomes may be stronger than they appear as a result of misreporting of food group consumption by a large proportion of the population.
In the design of the IAR protocol used in this study, several trade-offs were made. To keep equipment costs low (for LIC contexts), human interaction was required at every step of data processing. For example, although the wearable cameras are fully automated, annotation of the photos (e.g. foods consumed) required for analyses was paper-based and labour-intensive. Humans acting as the bridge between information technology systems provide ample opportunity for error and loss of data.
There were a few common scenarios in which, for the IAR, foods consumed were based solely on recall and were not, in actuality, image-assisted. For example, for reasons of enumerator safety, the wearable cameras often had to be removed before the end of the participants’ day, and consequently food preparation and cooking, eating and feeding activities at the end of the day were often missed. Also, the camera was attached to the mother, so there was no visual record of foods consumed by the child under the care of someone else or when the mother was not facing her child. For this reason, we would have expected a more accurate DDS estimate via IAR for mothers than children. However, this was not observed in any of the key indicators evaluated in this study, indicating that other logistical or technical limitations were more important factors contributing to poor agreement. For example, determining ingredients – especially nutrient-dense ingredients commonly consumed in small quantities – posed a serious challenge. In this study, it was rare to see the addition of milk – for example, into tea or porridge – in photos. Milk was either added by someone other than the mother or otherwise added off camera. Milk and other ingredients may be stored in non-descript, solid-coloured containers, and mothers and children commonly drink from solid-coloured plastic mugs, making it difficult to determine the contents (e.g. to differentiate black tea from milk tea) once served. Differentiating white from yellow tubers, which have different nutrient values, was also a challenge.
In this Ugandan context, food is usually prepared at the family level and can take hours to cook, with ingredients being added long before consumption, and by various people in the household throughout the day. Also, it was a common practice for mothers in this study to prepare food, eat and feed children while seated on the ground, at an angle such that food consumption was not captured on camera. Food consumption and preparation steps may have also been missed between 30-s photo increments. Fruit, in particular, is often picked and consumed quickly, appearing in just 1 or 2 frames (out of 1800), or not at all.
Finally, where there is no electricity, pictures taken before dawn, after dark or inside the kitchen – where a lot of cooking occurs – are too dark to see, and movement of the camera can render photos indecipherable. Addressing these logistical and technical limitations may improve the relative validity of the IAR for estimating DDS and MDD for mothers and children. For children, the IAR may only be an appropriate method for assessing dietary diversity when the caregiver wearing the camera exclusively feeds the child, or for children under 12 months of age who are less mobile and require more assistance during feeding.
Conclusion
The 24HR and IAR performed similarly in estimating maternal and child DDS in this rural LIC context. For both methods and populations, there was low systematic bias. Both 24HR and IAR provided an accurate estimate of median DDS at the population level, although they both tended to overestimate the percentage of mothers and children achieving the MDD. However, importantly, this first-ever study to quantify the extent of measurement error inherent in recall methods for estimating DDS suggests that the degree of attenuation may be greater than previously recognised. Given the high LOA observed here, true associations between DDS – where estimated via 24HR or IAR – and outcomes measured may be stronger than they appear. These results, however, suggest that unless the validity of the IAR can be improved, for reasons of utility, future studies should continue to use data collected using the 24HR to estimate DDS and MDD. The time required for both data collection and processing was substantially lower for the 24HR than the IAR.
Future studies should endeavour to quantify the amount of attenuation due to misreporting food group consumption inherent to common methods for assessing DDS, and to investigate factors associated with these errors across different country contexts. As an early prototype tailored to LIC settings, the IAR performed similarly to the 24HR for estimating DDS. Further research and development to address the logistical and technical challenges identified in this study are needed to fully capitalise on the strengths of LLWC for prospectively – and passively – capturing the consumption of food/beverage in a LIC context. Additional studies are needed to determine whether active photography, where participants are instructed to photograph foods when they are consumed and the ingredients added to individual recipes, better addresses the challenges of passive photography identified in this study. Future research should also seek to exploit the unique capability of wearable cameras to simultaneously gather data related to food intake and other factors driving nutrition outcomes (e.g. time allocation, care and feeding practices, availability and accessibility to food, and cleanliness of the environment) to better understand their associations and inform the design and evaluation of nutrition-sensitive programmes in LICs.
Acknowledgements
The authors thank Stephen Young (Natural Resources Institute, UK) for his assistance with statistical analyses, Aiden Doherty (University of Oxford) and Paul Kelly (University of Edinburgh) for their advice regarding the analysis of wearable camera images, the team of enumerators and supervisors who spent tireless days and nights in the field, and the mother participants and their families who made this research possible.
This study was financially supported by an Innovative Methods and Metrics for Agriculture and Nutrition Actions (IMMANA) grant, funded by UK AID (J. N., E. L. F., K. W., grant number IMMANA 2.05). IMMANA had no role in the design, analysis or writing of this article.
A. L. S. B., L. P., J. P., L. F., G. V., J. N., K. W. and E. L. F. contributed to the study design and tool development. A. L. S. B., G. V., J. N., K. W. and E. L. F. were involved in data collection and study management. G. V., B. D. G. and N. S. entered data and contributed to interpretation of the data. A. L. S. B. carried out the validation analyses, with oversight from L. P. and E. L. F., P. K. contributed to the data analysis. A. L. S. B., L. P. and E. L. F. interpreted the results. A. L. S. B. wrote the manuscript. L. P., L. F., P. K., J. N., K. W. and E. L. F. edited the manuscript. All authors read and approved the final version of the manuscript.
The authors declare that there are no conflicts of interest.
Supplementary material
For supplementary material referred to in this article, please visit https://doi.org/10.1017/S0007114520003530


 Open access